$SPX / $ES_F GEX going into 4/28:
Call resistance: 7100 (7000 0DTE)
Put support: 6940 (6900 0DTE)
Spot ~7165 → sitting right near HVL (0.15%)
Total GEX: +2.7B
Net GEX: +36M (basically neutral)
P/C GEX ~1 → balanced
IV 30D: 13.8% → still suppressed
In other words:
We’re in a balanced → fragile regime
Not strong positive gamma, not clean negative gamma = market can pin OR expand depending on flow
The edge is NOT the levels themselves.
It’s in asking:
Where are dealers long/short gamma?
Where are participants hedging?
If we break → who’s forced to chase?
Where does positioning flip from control → pain?
This is NOT complete information.
It’s just ONE layer.
You still need:
- price action
- order flow
- context
Be comfortable trading with incomplete info.
Then determine:
Does this positioning and behavior equal high probability opportunity for me
If we lose support → watch for expansion
If we stay near HVL → expect chop/pinning
Stay reactive, not predictive.
People see “👀 Someone bought $1.5m puts” and instantly think bearish.
That’s not how this works.
Big orders by themselves don’t tell you the story.
That flow could be:
• A hedge
• Part of a larger position
• Just one leg of something way bigger
Context is everything.
What’s the market doing?
Where are we trading?
What would make sense here for size to do?
You’re never getting full information in this game. Ever.
Trading is making decisions with incomplete info and putting yourself in asymmetric scenarios anyway.
That’s the edge:
• Understanding context
• Pairing it with your levels (volume profile, etc.)
• Managing risk like it actually matters
Order flow can add to the picture —
but by itself, it’s just noise.
One big order isn’t even close to the full story.
Play the probabilities and stay disciplined.
Big put buys don’t automatically mean someone’s bearish.
Could be a hedge against a long portfolio, part of a spread, or just a volatility play.
You’re seeing the trade, not the reason behind it — and that context is everything.
If you come from spot markets (futures) and use volume profile, you’re already thinking in distributions.
Options require the same framework—just formalized.
The mean becomes theoretical price (time, rates, inputs), and standard deviation becomes volatility—the spread of outcomes.
Same game. Deeper layer.
People think options increase risk, when they’re the only instrument that lets you define it precisely—down to the cent, or eliminate it entirely.
Options aren’t about symmetric outcomes. They’re about selectively owning the right tail.
With multi-leg structures, you’re shaping distributions—not guessing direction.
@ccmembersonly Heavy Weights, Sandlot, Goonies, Star Wars, Lord of the Rings, 3 Ninjas, Teenage Mutant Ninja Turtles (original), Teenage Mutant Ninja Turtles the Secret Ooze, Surf Ninjas, Ready Player One
It’s no wonder some of the greatest traders have competitive/athletic backgrounds or state they train like professional athletes.
• Jim Simons
• Paul Tudor Jones
• Steve Cohen
• @markminervini
Just to name a few
No trades for me today.
Price below prev day RTH VAL, prior low, and even 5D value low looks like breakdown… but from my experience this is not a signal of clean trend.
You’re in price discovery:
– No agreed value
– Thin liquidity
– Buyers (mean reversion) vs sellers (continuation) both active
– Trapped traders fueling both sides
Result (this is why I tend to sit on my hands with this context): high volatility, low directional efficiency.
Big deltas and large trades ≠ edge here — just participation in a fight.
The real tell:
→ Acceptance (time + volume) = trend
→ No acceptance = chop / rotation back toward value
Outside value isn’t “go time” by default… it’s a question the market hasn’t answered yet. And it’s best to be patient and allow the market to tell you where it’s accepting and where it’s rejecting.
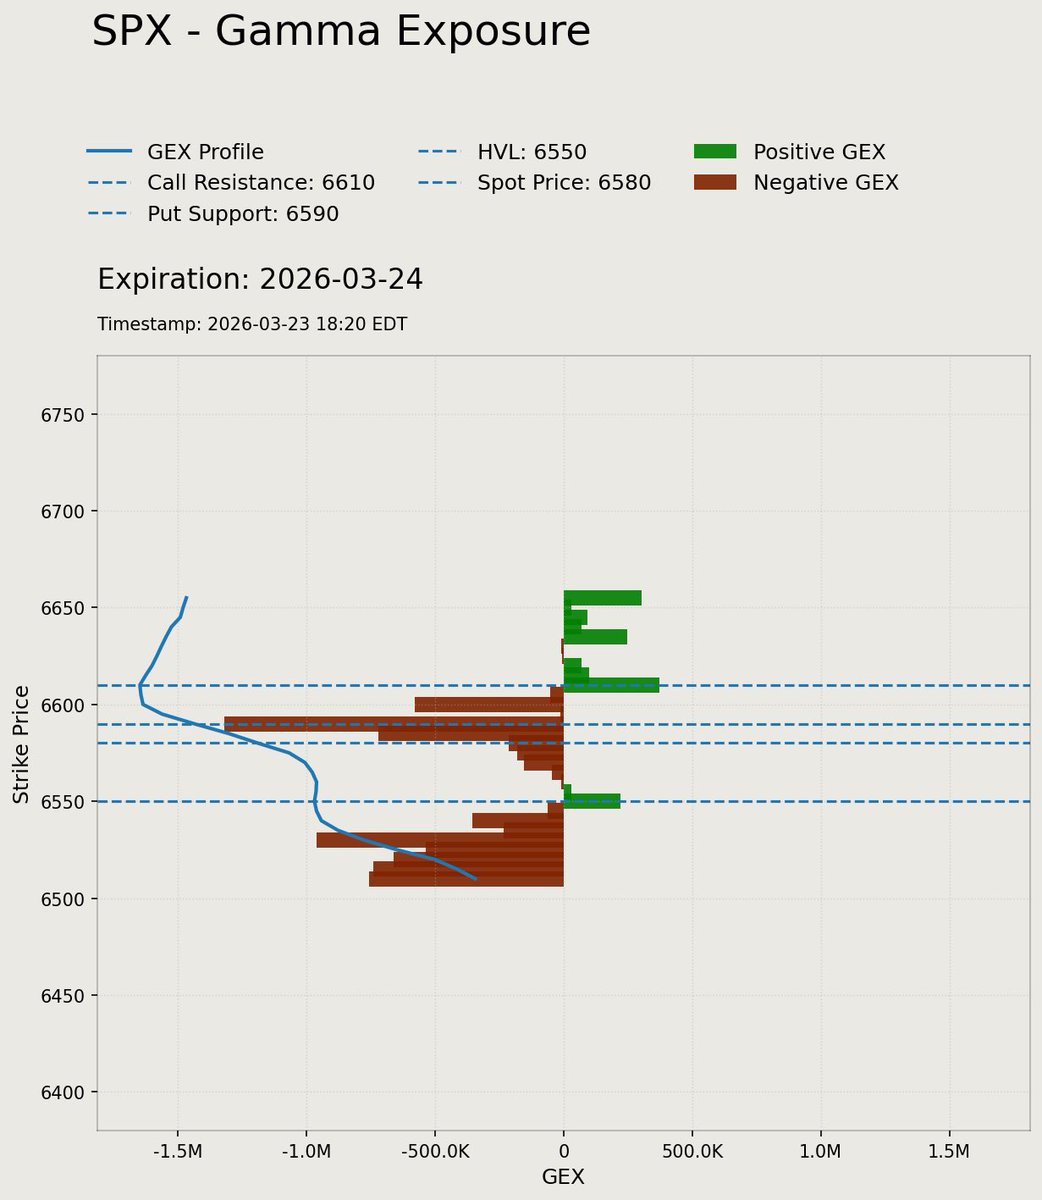
$ES_F
Back inside last week’s value after that large premarket move — auction reset, not a breakout.
Gamma still positive → expect dealer pinning unless we break levels.
• Spot ~6580 (near HVL 6550, only ~0.15% away)
• 0DTE range: 6900–7000
• 1D exp move: ±0.87% → 6879–7000
Positioning:
• Net GEX: +36M (balanced, slight pin)
• P/C GEX ~1 → symmetric, no strong skew
• IV still low (13.8) → no panic bid
Takeaway:
→ Inside value + positive gamma = mean reversion / chop
→ Only get trend if we escape HVL + break 0DTE walls
Don’t chase — fade extremes until proven otherwise.
TL;DR:
It’s overfitted.
Use CPCV with purging/embargo — otherwise you’re fitting noise.
High win rate + PF > 8 across TFs (each optimized separately) is a red flag. That’s curve-fitting, not a stable edge.
Even “out-of-sample” can leak in time series.
Test with CPCV across many paths, and focus on robustness > metrics.
If you haven’t already, read Advances in Financial Machine Learning — this is exactly what it addresses.
If you didn’t run much less get good results from CPCV this wouldn’t even make it to a forward testing sim trading phase.