7/ La cosa che mi farebbe cambiare idea?
Un'inflazione di fondo più calda del previsto. In quel caso la scommessa 'tutto rientra' salta, e il premio d'inflazione compresso è il primo a doversi riprezzare.
Tesi falsificabile, sempre.
6/ Come la leggo io.
Non è il momento di inseguire. È il momento di avere posizioni con un livello di uscita già deciso PRIMA del dato, non dopo.
La disciplina qui vale più della previsione.
📣📣 Meet Qwen-AgentWorld — a native language world model that simulates 7 agent environments (MCP, Search, Terminal, SWE, Web, OS, Android) within a single model. Environment modeling is the training objective from day one, not a post-hoc adaptation.
🤔 LLMs are trained to be better agents — better at acting in environments. But nobody has trained them to model the environments themselves.
🗺️ Our roadmap: investigate how language world modeling can push the boundaries of general agent capabilities, along two routes:
1️⃣ Build a foundation model for environment simulation — outperforming Claude Opus 4.8 and GPT-5.4 on AgentWorldBench
2️⃣ Investigate how world modeling enhances agent training:
🔬 Controllable Sim RL (agentic RL with LWM as environments) surpasses training in real environments
🧠 Learning to predict environments (LWM warm-up) makes agents stronger — remarkably, even without any agent-specific training, this predictive knowledge transfers to agentic tasks with zero fine-tuning
📑 Paper: https://t.co/Jx2l5RKq71
📖 Blog: https://t.co/7tVcKyhsx2
💻 GitHub: https://t.co/B5Lvb1UZCn
🤗 HuggingFace: https://t.co/Kw3QBL1TM5
🧩 ModelScope: https://t.co/YBnGYgMWWI
Introducing Sakana Fugu: A full multi-agent orchestration system accessible via a single model API.
Our ‘Fugu Ultra’ model matches the performance of Fable and Mythos, delivering frontier capability without the risk of export controls.
Try it: https://t.co/hhO6qTawgb 🐡
This is the rarest piece of HFT content on the internet - Robert Almgren walking through a real execution trade tick by tick
He's the co-founder of Quantitative Brokers and the man who wrote the Almgren-Chriss model - the standard execution algorithm used at Goldman, Citadel, Two Sigma
In this lecture he shows a live order from May 14 2018, every fill, every limit, every market reaction across 2 minutes and 40 seconds
Jane Street, Goldman Sachs, JP Morgan, BlackRock, Hudson River Trading, Two Sigma, D.E. Shaw.
The most expensive engineering teams in the world released their financial tools on GitHub. Here are 7 repos, one from each.
1. Jane Street, janestreet/magic-trace
https://t.co/a2G20vnewK
5.3k stars. Process tracer powered by Intel PT. When your profiler is blind, magic-trace sees every CPU instruction.
2. Goldman Sachs, goldmansachs/gs-quant
https://t.co/SMYFwP3TWD
Derivative pricing the GS traders use at their desks. MIT licensed.
3. JP Morgan, finos/perspective
https://t.co/9rgy6FxYt4
What JPM traders use to watch markets in real time. A $24k/year terminal, for free.
4. BlackRock, blackrock/lcso
https://t.co/iHwsxZDZD9
Rust optimizer for portfolio problems. Where scipy gives up, this works.
5. Hudson River Trading, hudson-trading/corral
https://t.co/YhmrQFmYaZ
Structured concurrency for C++20. The foundation of HFT infrastructure at one of the largest U.S. trading firms.
6. Two Sigma, twosigma/flint https://t.co/ebEFqcDxJ6
Time-series joins on Apache Spark with temporal tolerance. Built for billions of ticks.
7. D.E. Shaw, deshaw/pyflyby https://t.co/uYDQKtnDVd
Auto-import for IPython and Jupyter. D.E. Shaw also funded the development of IPython itself.
Bookmarked it
When I taught principal component analysis (#PCA) for #MachineLearning-based #dimensionality reduction a bunch of students asked, 'What do the component loadings look like?'
So, I coded up an interactive #Python@matplotlib#dashboard! Vary the strength of the correlation and watch the loadings & variance explained change! Super cool!
On #GitHub @ https://t.co/8kuicemoFO∀. #DataScience
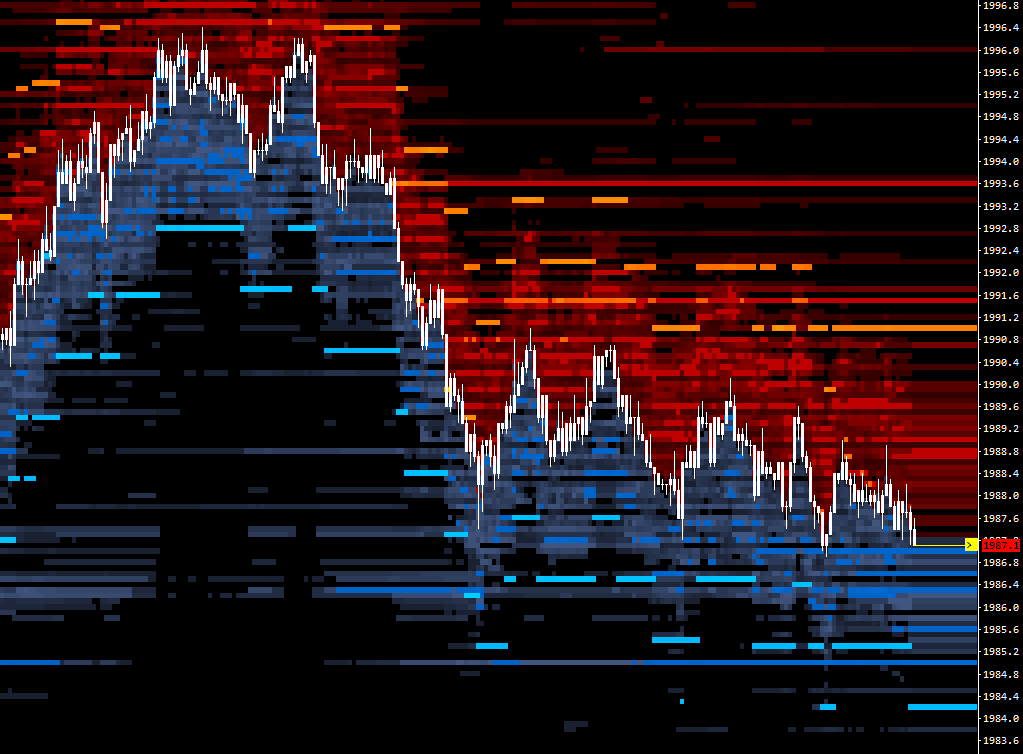
Market makers can't see your stop loss orders, but they and everyone else can see your resting limit orders.
Traders use a depth graph to visualize this data, with different colors representing various order sizes.
In this thread, I'll show you how to set one up.🧵👇