Decided to also be active at our Earth Observation group account here: https://t.co/RQKi41H7mQ…
Follow us on updates about #remotesensing#earthobservation - regular news also on our news blog https://t.co/duErky8Uoh
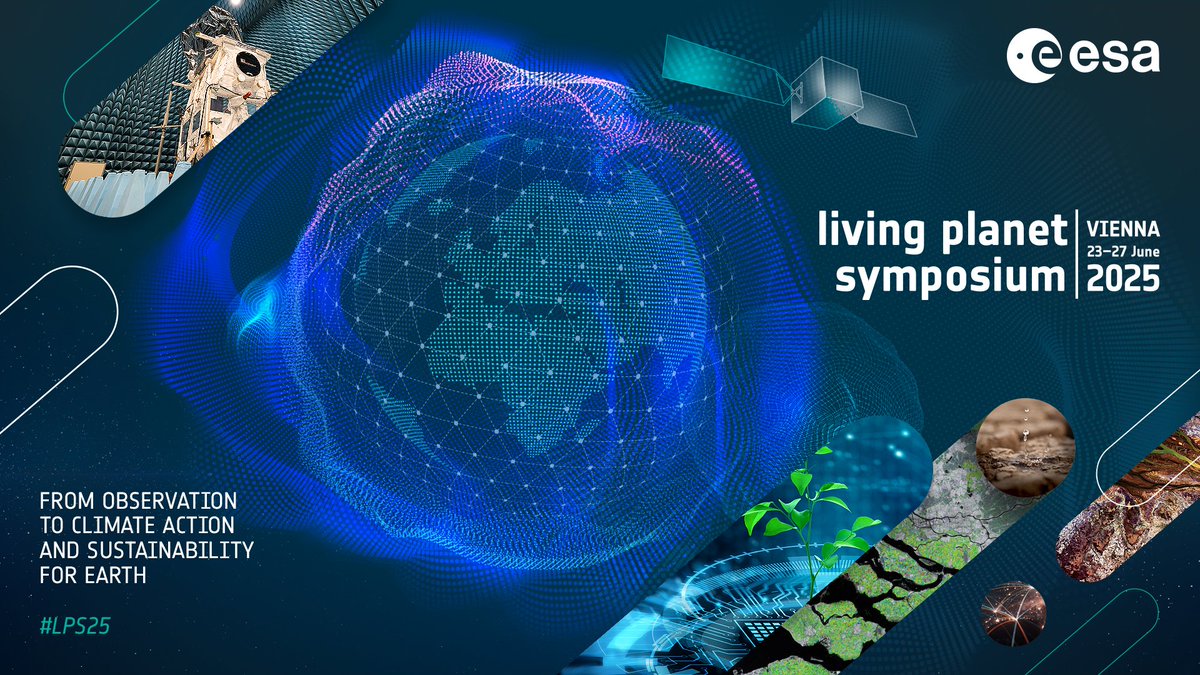
It is time for abstract for the @esa Living Planet Symposium 2025 . 🌍
The event will take place from 23–27 June 2025 at the Austria Center Vienna, Austria.🇦🇹
🔖submit your contribution at https://t.co/lrEgU6BEMB
📅Deadline for submissions 1 December 2024
#LPS25
@corneliussenf @tommaso_jucker And that can even be used for detecting moving objects like trucks - a former msc student explored it here https://t.co/1N37bllJ6b
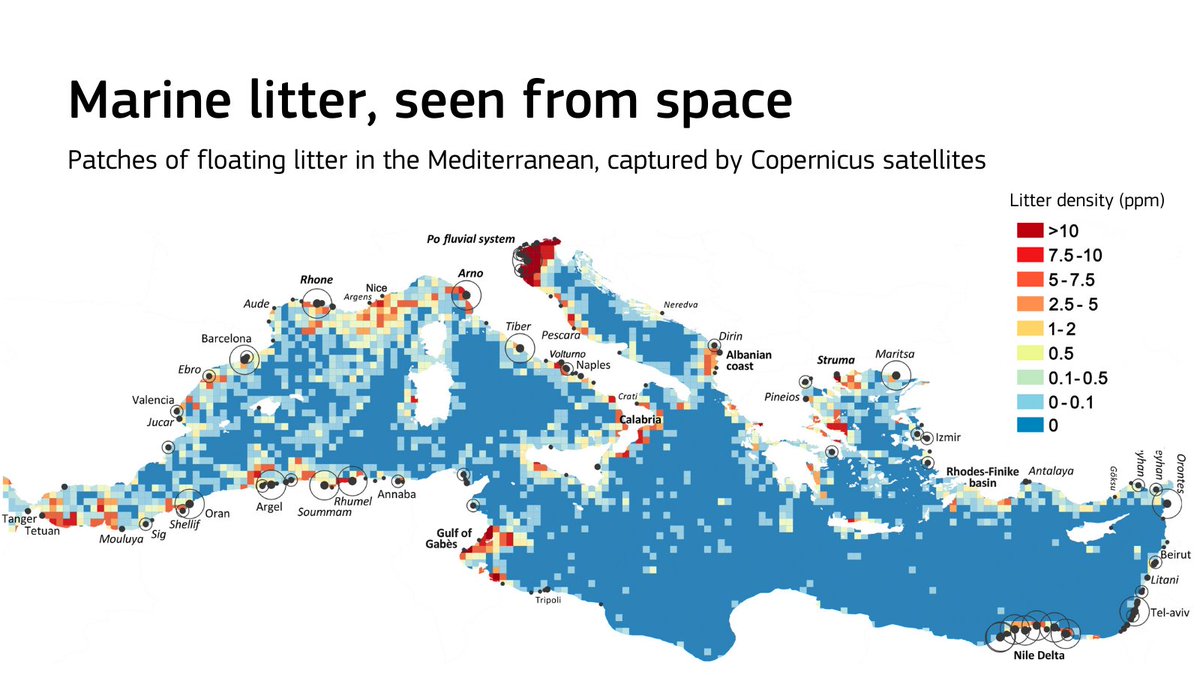
Good news: we can use satellites to find marine litter.
The size of the ocean makes it difficult to monitor pollution, but our scientists discovered they can use @CopernicusEU imagery to locate patches of floating trash.
Read the news: https://t.co/VJfrJV6aav
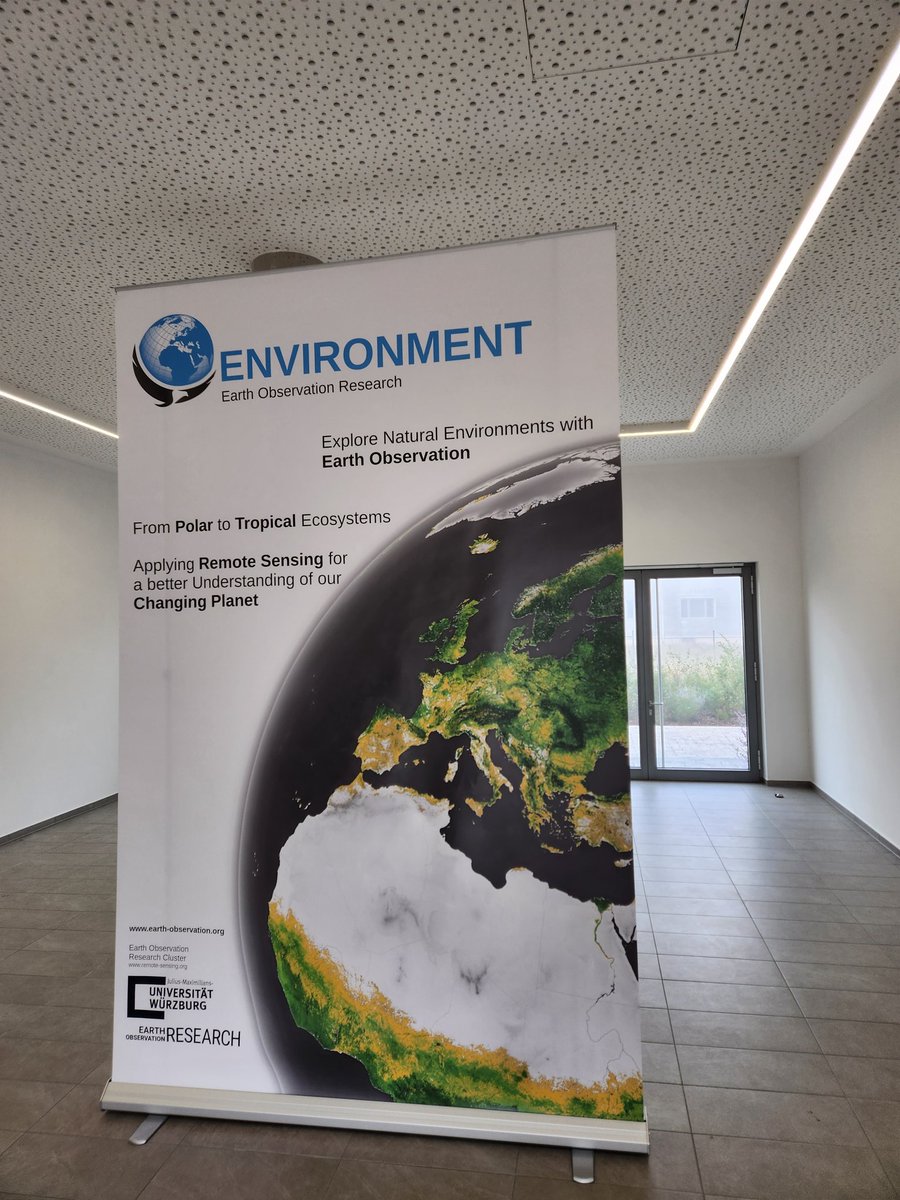
Want to become an ##earthobservation scientist and study our planet? Join our eagle research msc program and apply within the next days, until May 15th! https://t.co/h5yOnQBxSp
Want to become an ##earthobservation scientist and study our planet? Join our international msc program and apply within the next days, until May 15th! https://t.co/c4CQPokm6c
Want to become an ##earthobservation scientist and study our planet? Join our international msc program and apply within the next days, until May 15th! https://t.co/dBce10hIgK
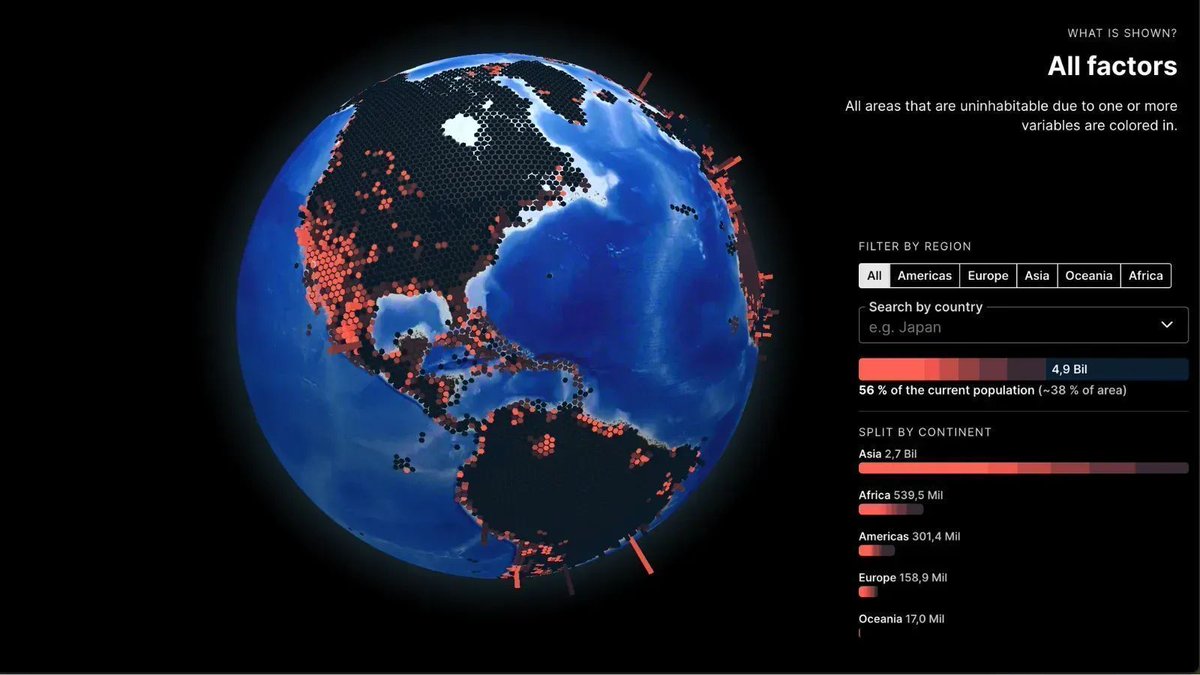
This impactful interactive map from @morgenpost shows where Earth will likely become uninhabitable by the year 2100...yikes.
Explore it here: https://t.co/dkX5wNYcHE
Our #earthobservation#remotesensing package is finally updated to #sf#terra#stars and provides #rspatial functions again! Thanks to our new maintainer konstantin ! More functions will be added soon as well ....
https://t.co/unKIBq5r3y
"In einigen Regionen Deutschlands gab es seit Beginn der Wetteraufzeichnungen noch nie so viel Niederschlag."
Gute kurze Erklärung zu Ursachen und Zukunftsaussichten mit Experten in der Tagesschau.
Really pleased this map inspired @dr_xeo to create a #rstats tutorial on how to access the GFS data via #GEE and visualise it with ggplot2. Check it out:
https://t.co/zxy4LCI5lX
It was an unbelievable year for global climate.
As data is released in the first two weeks of January, you are going to be hearing all about these new climate change records. Apologies for all my graphs in advance!! 😬
Spiral below produced by @NASAViz: https://t.co/Ejsg0F4wop