NASA's official Scientific Visualization Studio account, tweeting the best in NASA scientific visualization. We reveal the invisible by bringing data to life.
This account is going away! Love exploring our amazing visualizations? Not to worry! We'll still be sharing them to accounts like @NASAGoddard, @NASAEarth, and more, as well as https://t.co/ZBzZ4AINwm.
Reminder: Just one week left until this account is archived. Find all our latest @NASA visualizations on our dedicated visualization page. https://t.co/epzNadNGmp
Important update: This X account will soon be deactivated. Don't worry, you can find all the latest visualizations from @NASA at our dedicated visualization page: https://t.co/ZBpzLecduV
Record August temperatures confirmed summer 2023 was the hottest summer (June, July, August) in @nasa’s temperature record, by a large margin.🥵
These record-breaking months continue a long-term warming trend due to human activities. https://t.co/KmUVjZZ5Jn
Las temperaturas récord de agosto confirman que el verano meteorológico (junio-agosto) del hemisferio norte de 2023 fue el más caluroso en el registro de temperaturas de @NASAEarth, por un amplio margen.
https://t.co/exQz0VfE6Y
Summer 2023 was the hottest summer in NASA’s record, continuing a trend of long-term warming caused by human activity.
All three summer months broke heat records: https://t.co/fAbXthgoP4
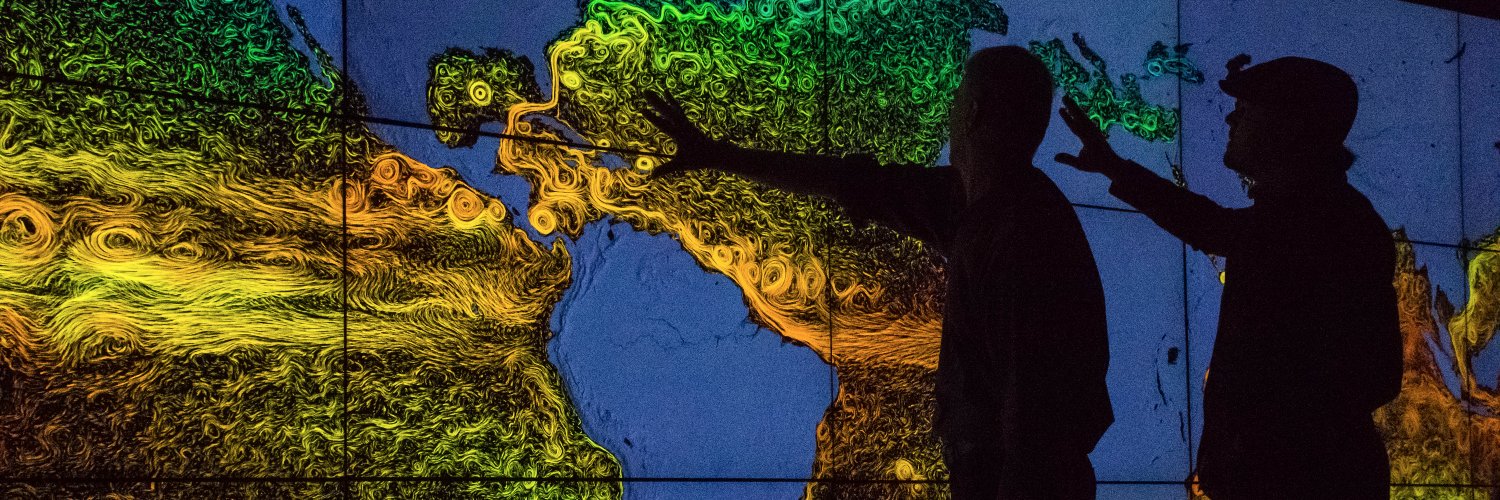
This is so cool - I definitely need to add this to my talks on climate data viz 😄
"With each projection, the distortions of these circles show how shape and area are distorted in different parts of the projection."
Created by @NASAViz: https://t.co/y4EowZK0Jr
Sea levels around the world are rising – and at an accelerating rate – as a result of human-caused global warming. 🌊
Global sea levels have risen about 10 centimeters from 1993 to 2022, as seen in this @NASAViz animation.
Get the @NASAClimate data: https://t.co/GcNKPl66sK
Congrats to @NASAViz! Their stunning depiction of OSIRIS-REx's trajectory in “A Web Around Asteroid Bennu” emphasizes the intricate navigation in collecting a sample from the asteroid Bennu, and will be shown at the SIGGRAPH awards on Aug. 8-9! 🏆
https://t.co/QTxIQLpAAx
Recently, @NASAWebb released its first images after launching on December 25, 2021.
JWST now orbits the Sun, 1.5 million kilometers (1 million miles) away from our planet. ☀️ 🔭
See its orbit and the path it took to get there: https://t.co/DrlzSqP7qB
Hey @NASASolarSystem, ready for your close-up? As part of Webb’s prep for science, we tested how the telescope tracks solar system objects like Jupiter. Webb worked better than expected, and even caught Jupiter’s moon Europa: https://t.co/zNHc724h9X
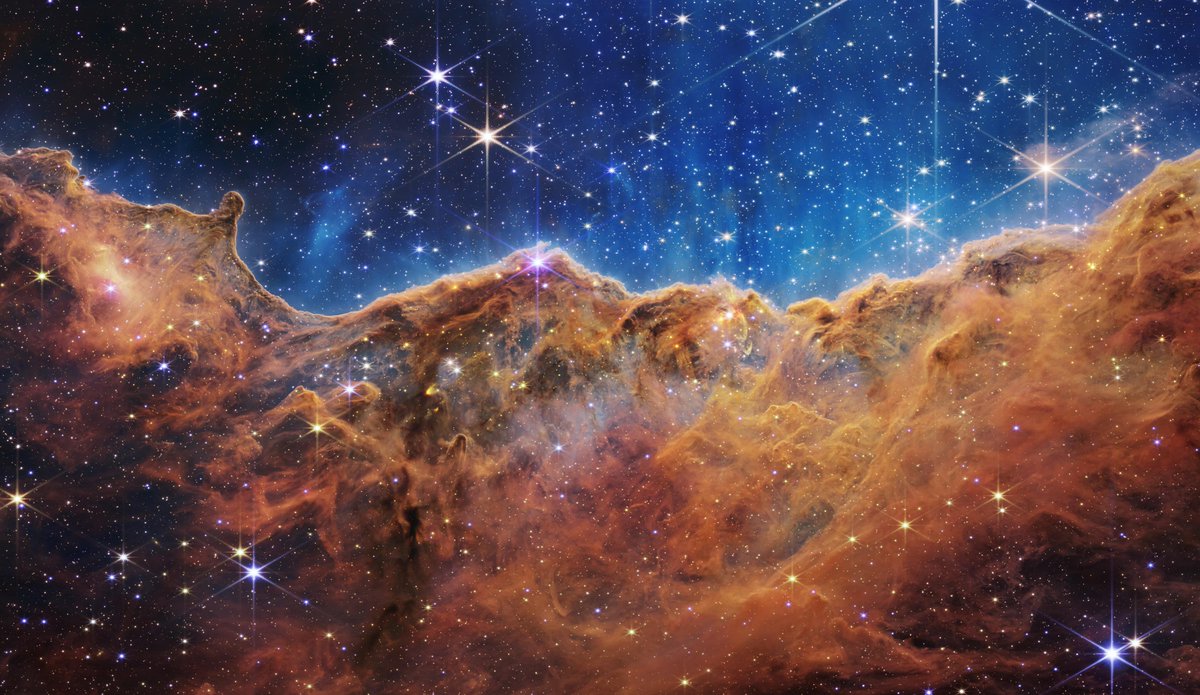
Hundreds of new stars.
Examples of bubbles and jets created by newborn stars.
Galaxies lurking in the background.
@NASAWebb Deputy Project Scientist Amber Straughn details new discoveries about Carina Nebula. https://t.co/63zxpNDi4I #UnfoldTheUniverse
Better together. International collaboration gave us the most powerful space telescope ever made, and the deepest infrared views of the universe ever seen. With our partners at @ESA and @CSA_ASC, the science can begin. Together we #UnfoldTheUniverse: https://t.co/oFA1ja4jeP
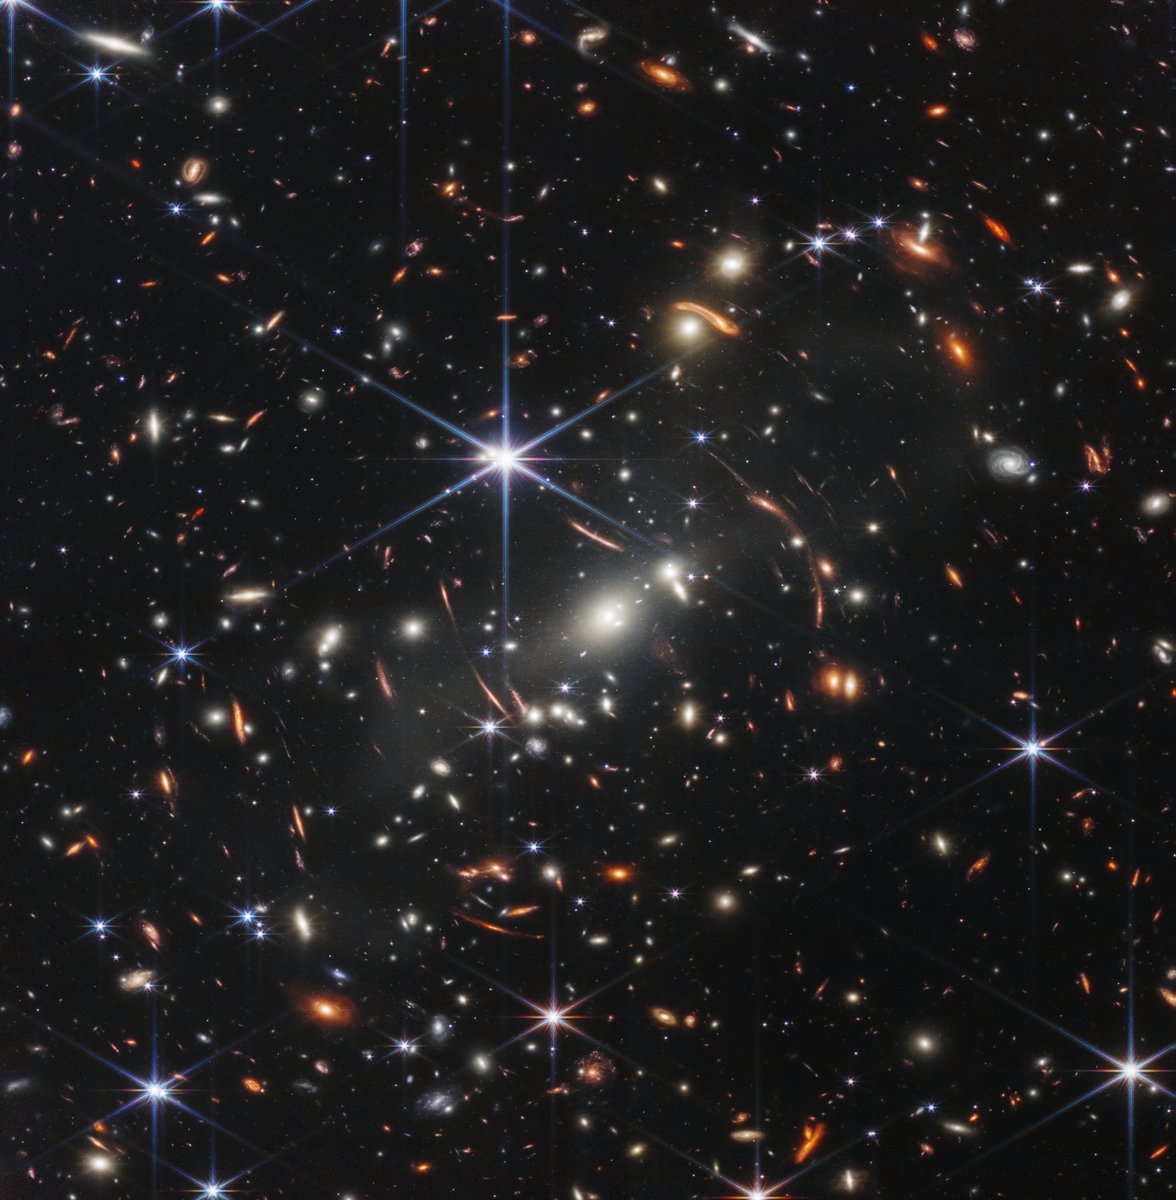
It's here–the deepest, sharpest infrared view of the universe to date: Webb's First Deep Field.
Previewed by @POTUS on July 11, it shows galaxies once invisible to us. The full set of @NASAWebb's first full-color images & data will be revealed July 12: https://t.co/63zxpNDi4I