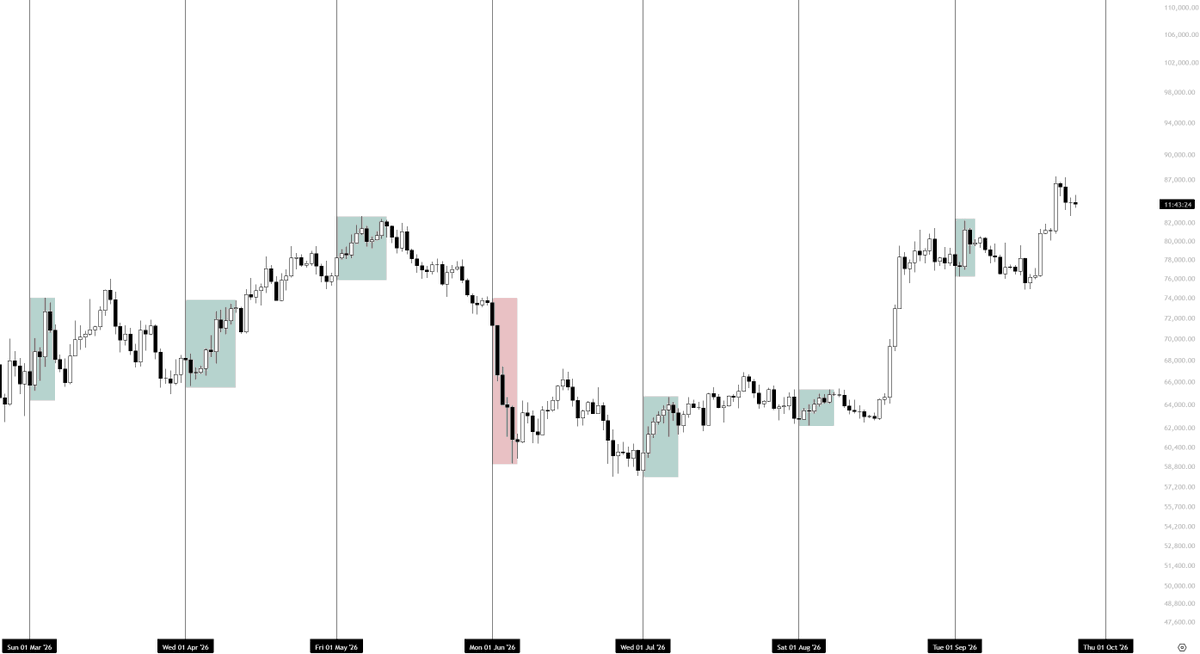
Monthly open pivot approaching.
6/7 times, $BTC has seen a pump around the monthly open, usually because PA was bearish heading into it.
So if we dump into October, I’d expect a push higher afterwards. If we pump into it instead, I’d be far more cautious.
To Supporters
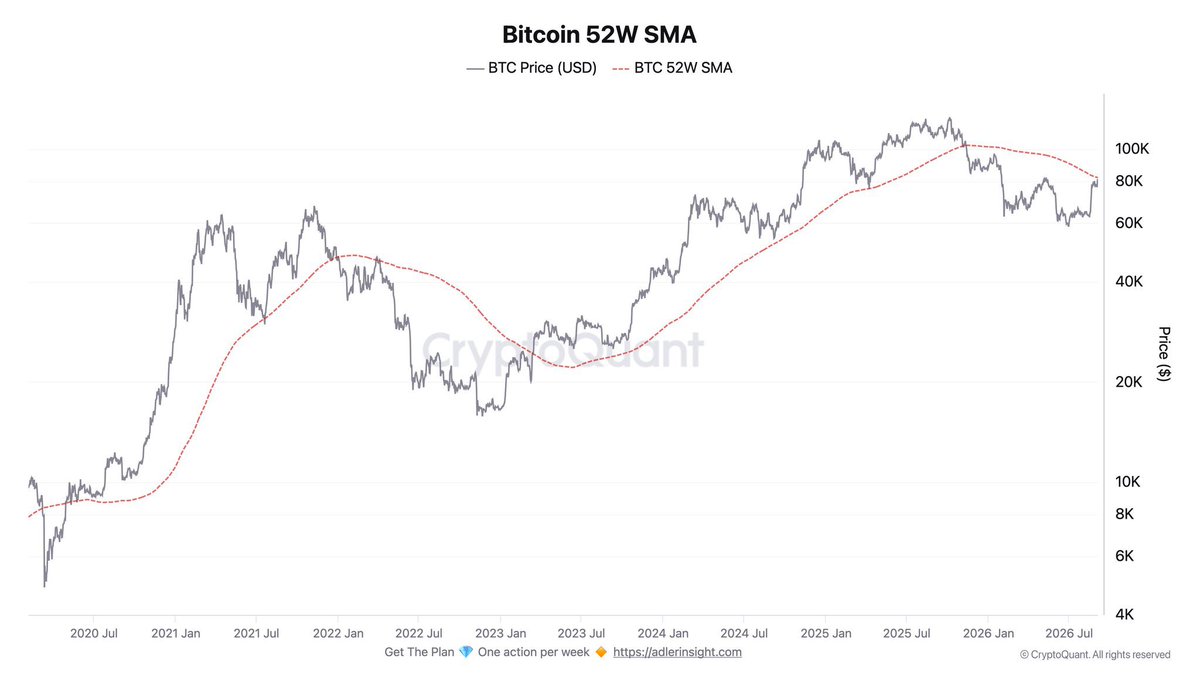
As I mentioned in yesterday’s livestream, even looking at this indicator, one of the reasons the current price zone could be Target 2️⃣ for defining a key important resistance zone…
Where was the first touch price in previous bear mkt?
h/t @AxelAdlerJr#btc
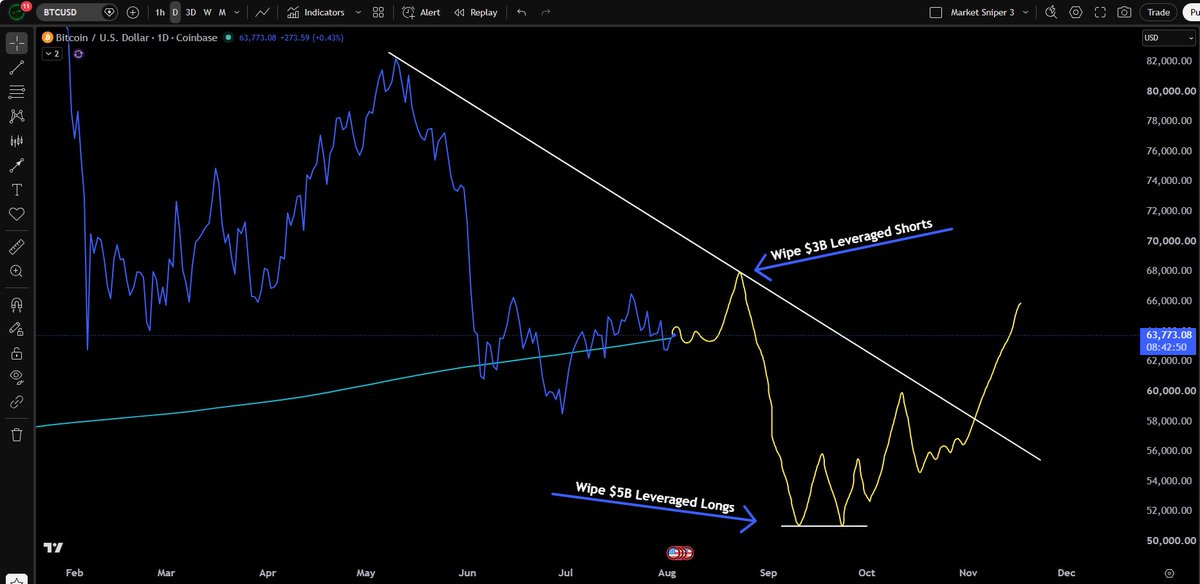
$BTC is getting closer to finding a bottom but not yet.
Wipe nearly $10B in leverage -> Saylor sells again -> Price forms bottom -> Next bull run
This would be a wild grand finale. 🍿
Therefore, the risk of further drop is still higher
In reality, it hasn’t rebounded significantly, has it?
The content I posted earlier is the true cause of this…
#btc
Probably the most important level to watch this month.
If $BTC fails to hold this area, there's a very strong chance we revisit the $60K region, and potentially even lower.
Important day for $BTC tomorrow.
FOMC could set the tone for the rest of the month.
Historically, we've seen a bearish reaction around this time 7 out of 8 times.
Right now, BTC is forming a bullish narrative into the event, but as I always say, the outcome is usually priced in before the news is released.
If recent history is any indication, we have generated far more bearish reactions than bullish ones.
We need to maintain bullish market structure from here... (64K). If not, there's a strong chance we revisit the $60K lows after this pivot.
🚨EXTREMELY BAD SCENARIO IS SET FOR $BTC
The Bank of Japan will officially raise interest rates to 1.00% next week
For the FIRST TIME IN 36 YEARS rates will cross 1% mark
Bitcoin has dropped 30-40% every time BoJ raised rates
$40,000 per $BTC is the most optimistic scenario
Every $BTC cycle follows the same playbook
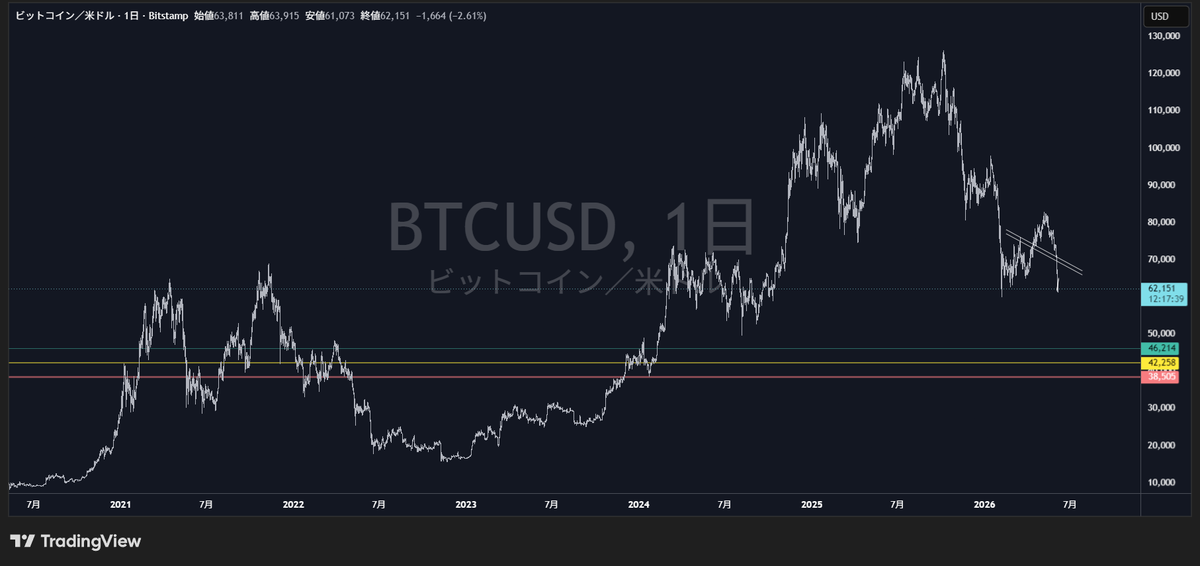
Three bull runs, each lasted ~1,065 days
Each correction: -62–83% in 365 days
Every bottom formed between the 50 and 100 MA
Buy Zone $44–52k, almost there
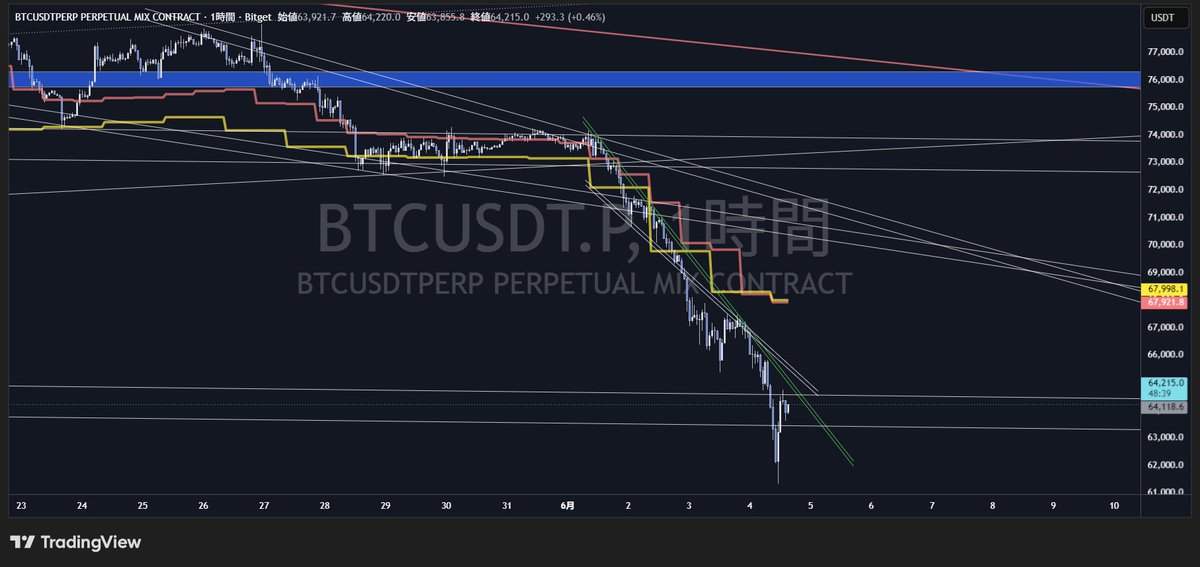
Pink waveform: 12-hour baisis downward volatility amplification boundary line
Yellow waveform: Daily baisis downward volatility amplification boundary line When
$BTC is moving under these boundary lines, there is a high possibility that the drop will continue
🚨Therefore, taking a contrarian long position carries significant risk
If you liked this post, please like & retweet
#btc
I don't think anyone knows the exact price level to which it will decline from here
However, if you have the skill to read price movement & charts, anyone can tell at which price range the market will bottom out
If you don’t know that, it simply means you haven’t been properly watching the charts on a daily basis
At the very least, all of my supporters know the conditions for the bottom, and they have the ability to identify it🤘
#btc
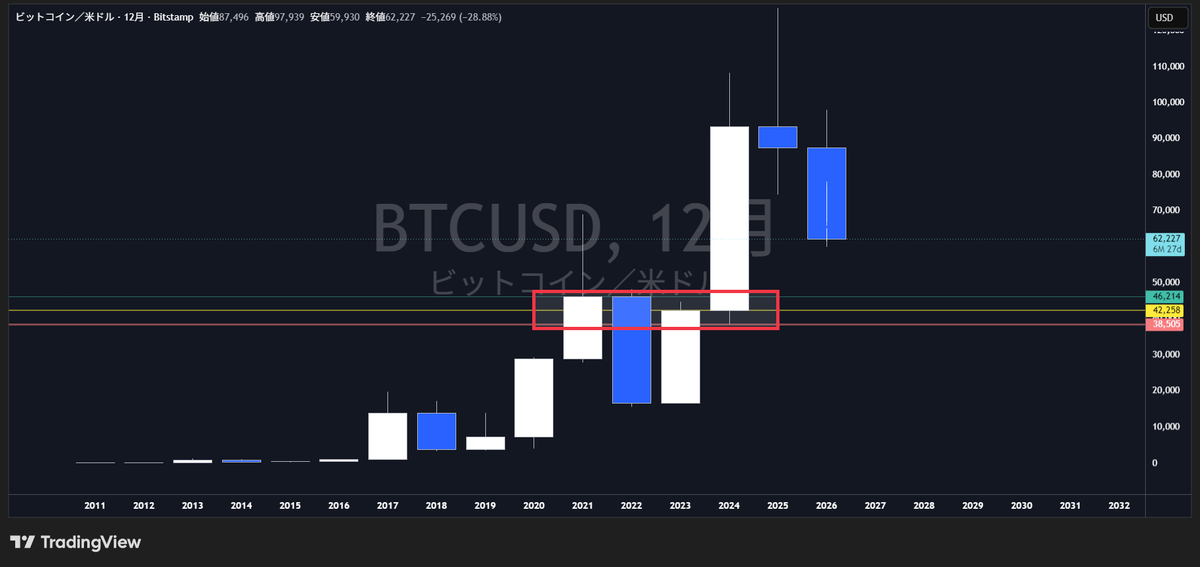
Well, even by ordinary reasoning, I think this zone - here the opening & closing prices of each yearly candle inside the red frame are densely clustered - will be a considerably strong & solid price range
#btc
If there are already people doing DCA, it’s quite premature
Right now isn't the time to start DCA
DCA should only be implemented after the price pass through the pink medium-term downtrend line
After $BTC passing through that line, mkt will hit bottom out...
#btc
If price is still trading below the pink waveform, there is a possibility that the drop will not stop, so please exercise caution
If you liked this post, please like & retweet it
#btc