Sharing a milestone in my work’s reception: I have reached 50,000 citations and my h-index is 65, as reported by Google Scholar. I want to thank all the people who supported and inspired me over the years — my students, collaborators, colleagues and readers!
When did photography really become “automated”? I made this interactive timeline that maps this process from the beginning of photography to 2020s GenAI tools. #visualculture#culturalanalytics digital humanities.Timeline:
https://t.co/NxlnwtpoWL
I am collecting global responses for a simple (but large-scale) survey about people's lifestyles & cultural likes. If you can send the link to your students and encourage them to fill it out, this will be great #CulturalAnalytics
https://t.co/PtCe58atrq
Join me for an online seminar " Medium That Thinks: Generative AI, Media Cognition, and Artistic Creation " on May 13th, 10:00 UTC/GMT (The Department of Film, Theatre & Television, The University of Reading, UK).
Please RSVP to receive a link:
https://t.co/f3sbQC5H1p
Join me for an online seminar " Medium That Thinks: Generative AI, Media Cognition, and Artistic Creation " on May 13th, 10:00 UTC/GMT (The Department of Film, Theatre & Television, The University of Reading, UK).
Please RSVP to receive a link:
https://t.co/f3sbQC5H1p
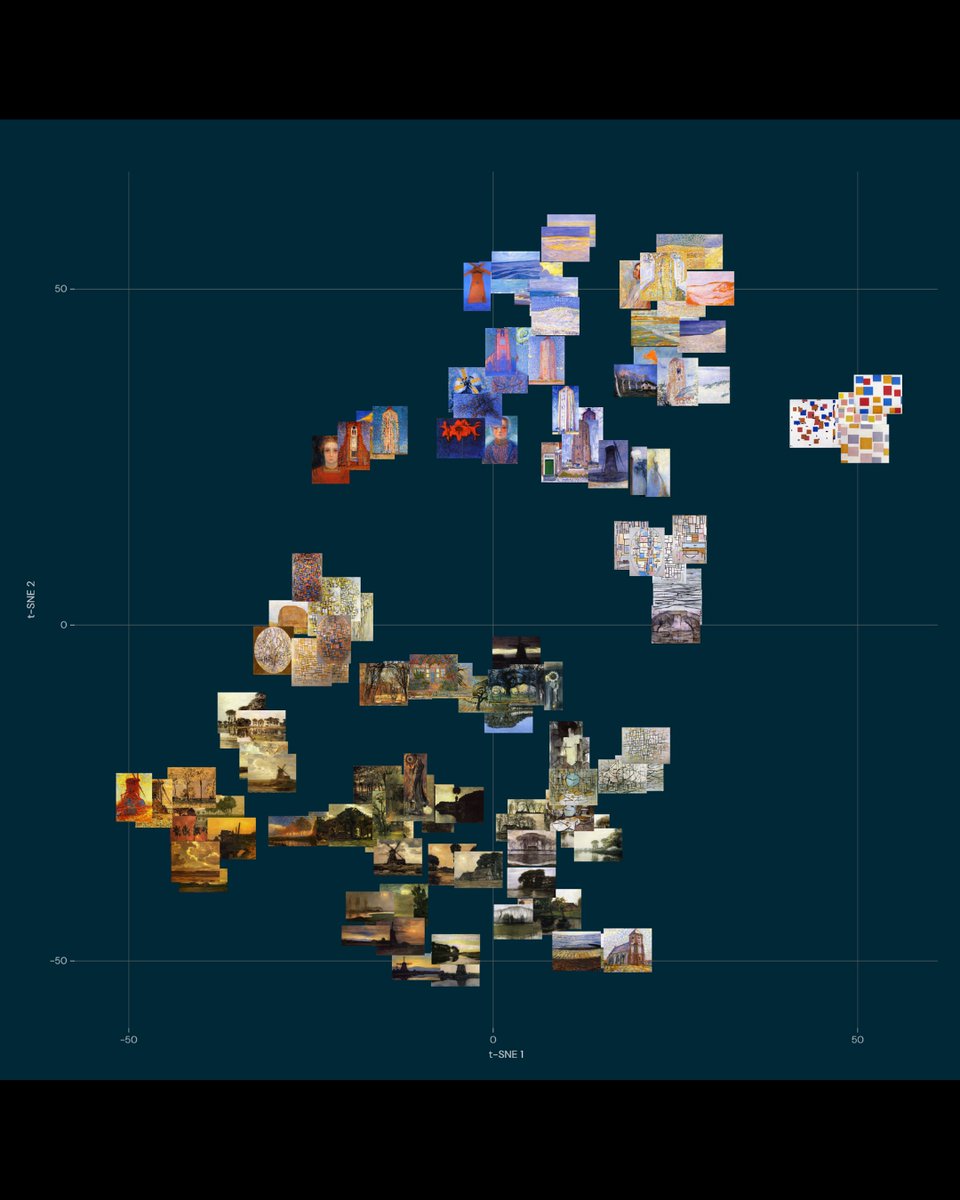
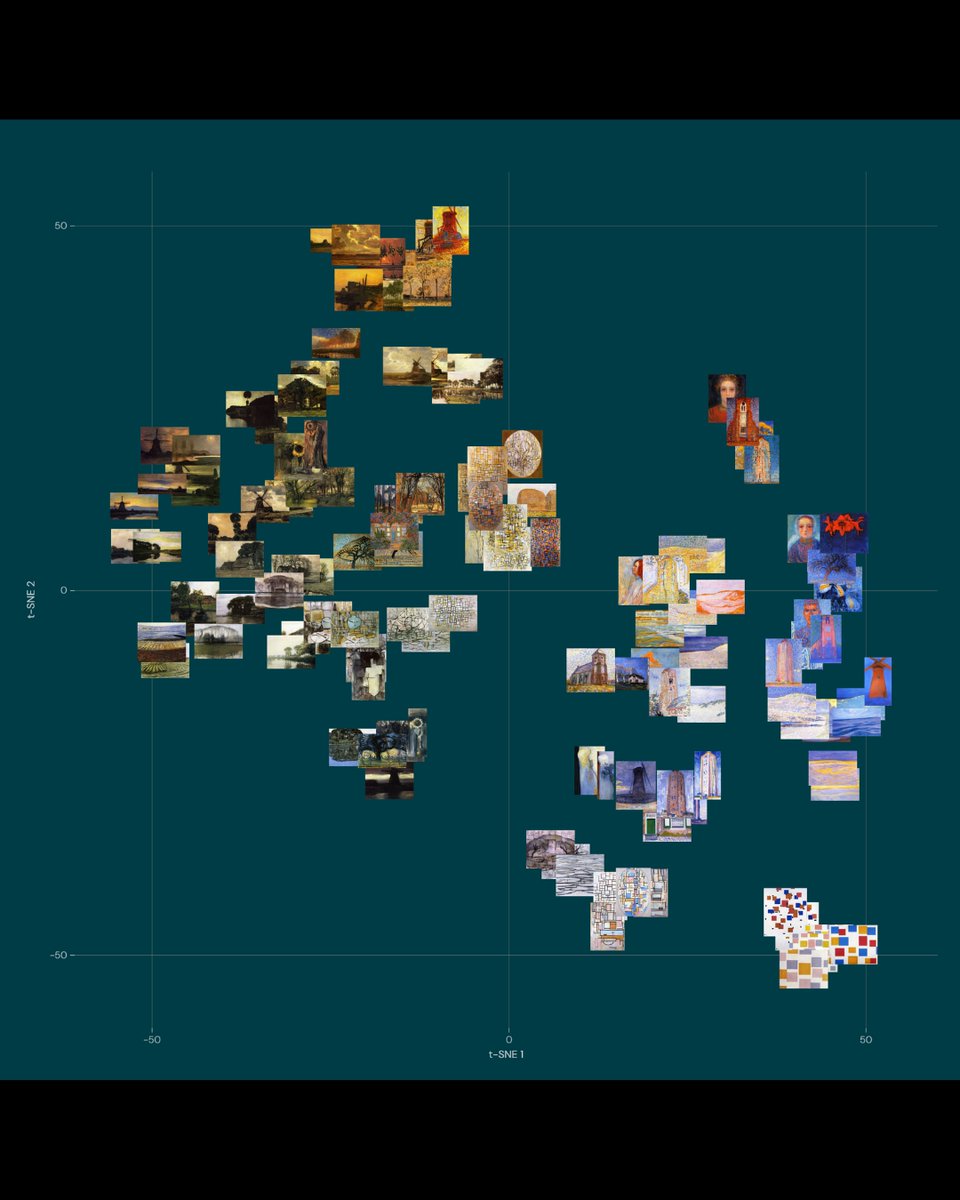
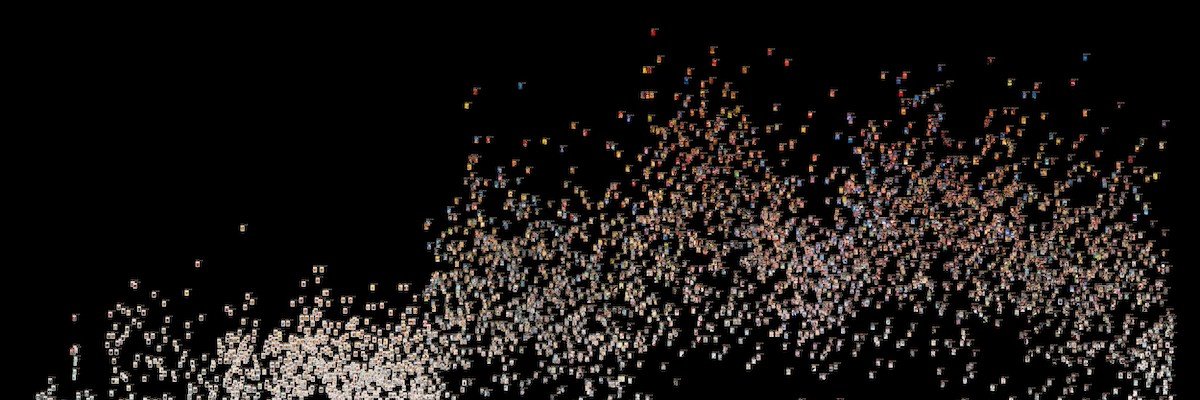
ImagePlot 2.2 in action: 1) Mondrian's evolution visualized in 77 feature space using t-SNE); 2) Comparing van Gogh's Paris and Arles paintings in - each axis uses one feature #digitalhumanities#digitalarthistory#culturalanalytics#imageplot https://t.co/uWMlCqFjOf
Today I made this dashboard to keep track of all professional invitations I am getting. First, I designed it using Perplexity AI and then finished the design in Claude.
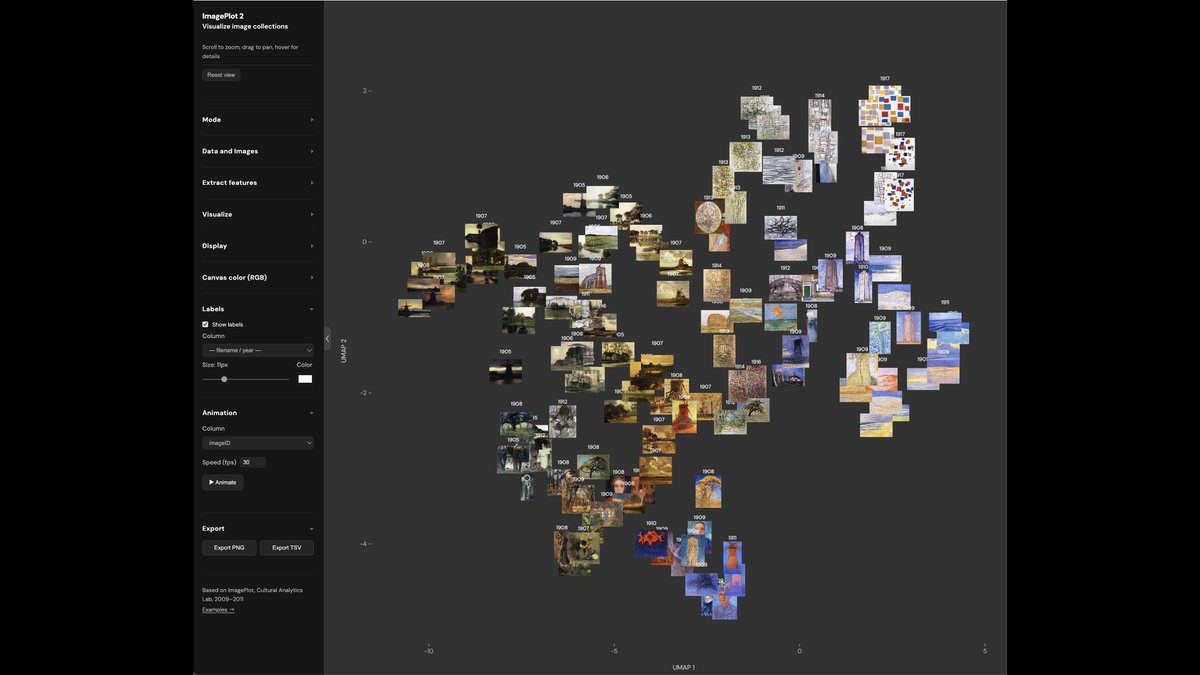
Excited to release ImagePlot 2.2 🎉 — a browser-based tool for visualizing image collections. Contained in a single HTML file New: Compare mode, UMA, Cluster visualization, 77 image features #digitalhumanities#culturalanalytics#datavisualization
🔗 https://t.co/uWMlCqFjOf
I am releasing a new version of ImagePlot 2. This free software runs in your browser and it visualizes image collections. Can use existing image metadata - or 48 visual features the tool extracts. It can visualize using PCA, t-SNE, and do animation: https://t.co/uWMlCqFjOf
@rvorias yes I will make it, but not everybody is familiar with GitHub, so this is why for now I just put files in Google Drive. The included documentation explains features, or you can show the HTML code to any AI and it will tell you!
@kolja_sam Here is the projects page of our lab (2008-) which shows lots of examples of such visualizations, explaining what they show and why it is interesting - and you can also find many publications: https://t.co/hDFp1l4amm
@egelmmm ImagePlot is a research tool to analyze patterns across image collections as opposed to simply displaying them. It extracts dozens of visual features and uses various special reading methods to create visualizations.
Introducing ImagePlot 2 - a new version of our earlier ImagePlot tool. Interactive visualization of image collections (extracts 48 visual features, calculates t-SNE, creates scatter plots with the images). Single HTML file - open in a browser. https://t.co/DdIrIbXRnk
@Andrey4Mir Well, as we know, the quality of typical chats and social media and the quality of articles published in top academic journals (especially in science) is very different. So smart people will continue to produce smart and careful work, and others may indeed degrade more))
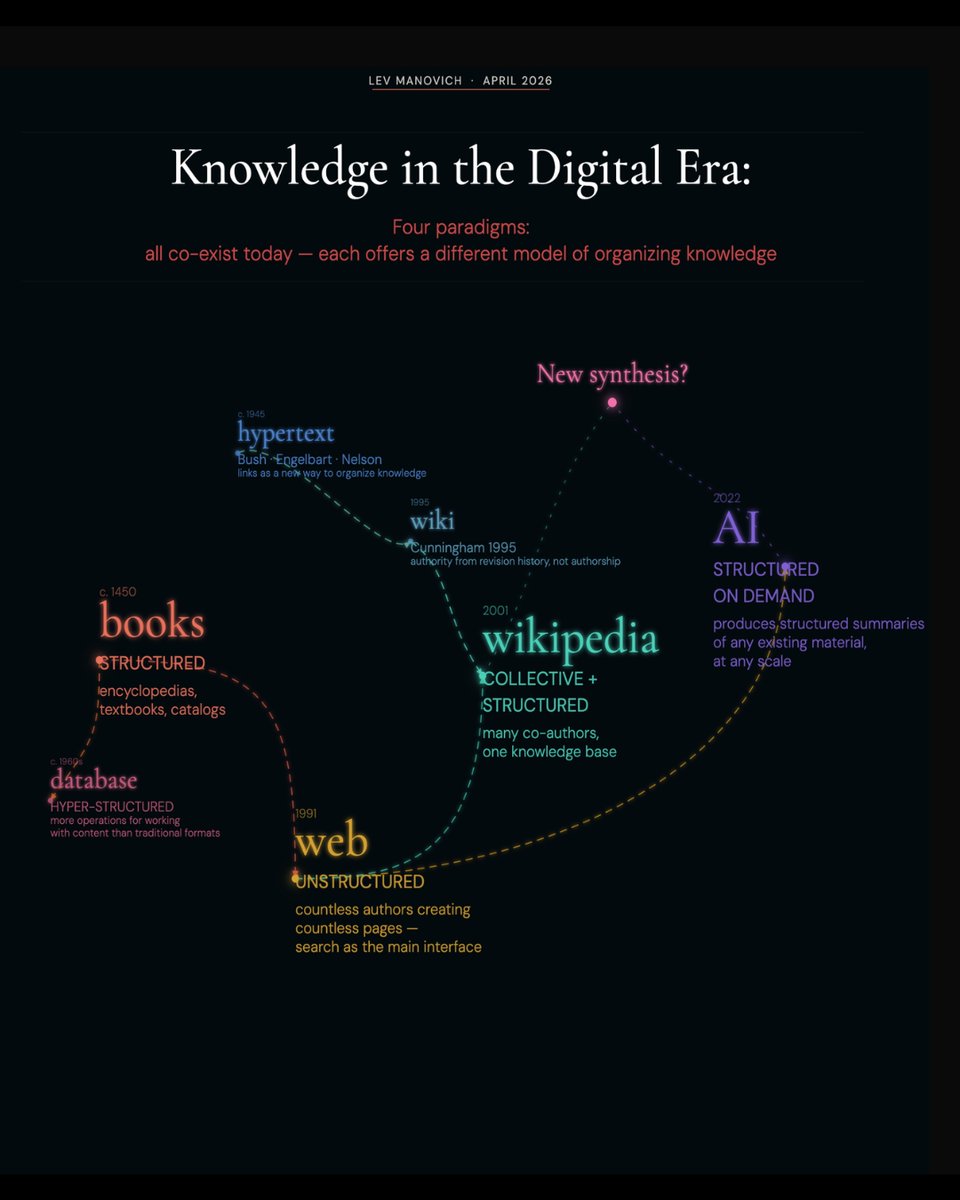
I was thinking about the evolution of knowledge formats in the digital era and how AI fits into this history - and made this diagram. Your comments are welcome!
@halecar2 Yes, you're right. Of course, I can also generate new information and knowledge. I think my diagram is only talking about organization, however.
@BEBischof I am using very traditional, standard graphs, but simplicity allowed me to think of what data to visualize and easily add layers. Next time, I will try a more interesting visualization.
As a birthday gift to myself, I made this visualization using Claude. I spent three days (March 27-29) working for a few hours each day. A big part was gradually coming up with ideas about what and how they can be visualized https://t.co/U1Ufd0d1EG