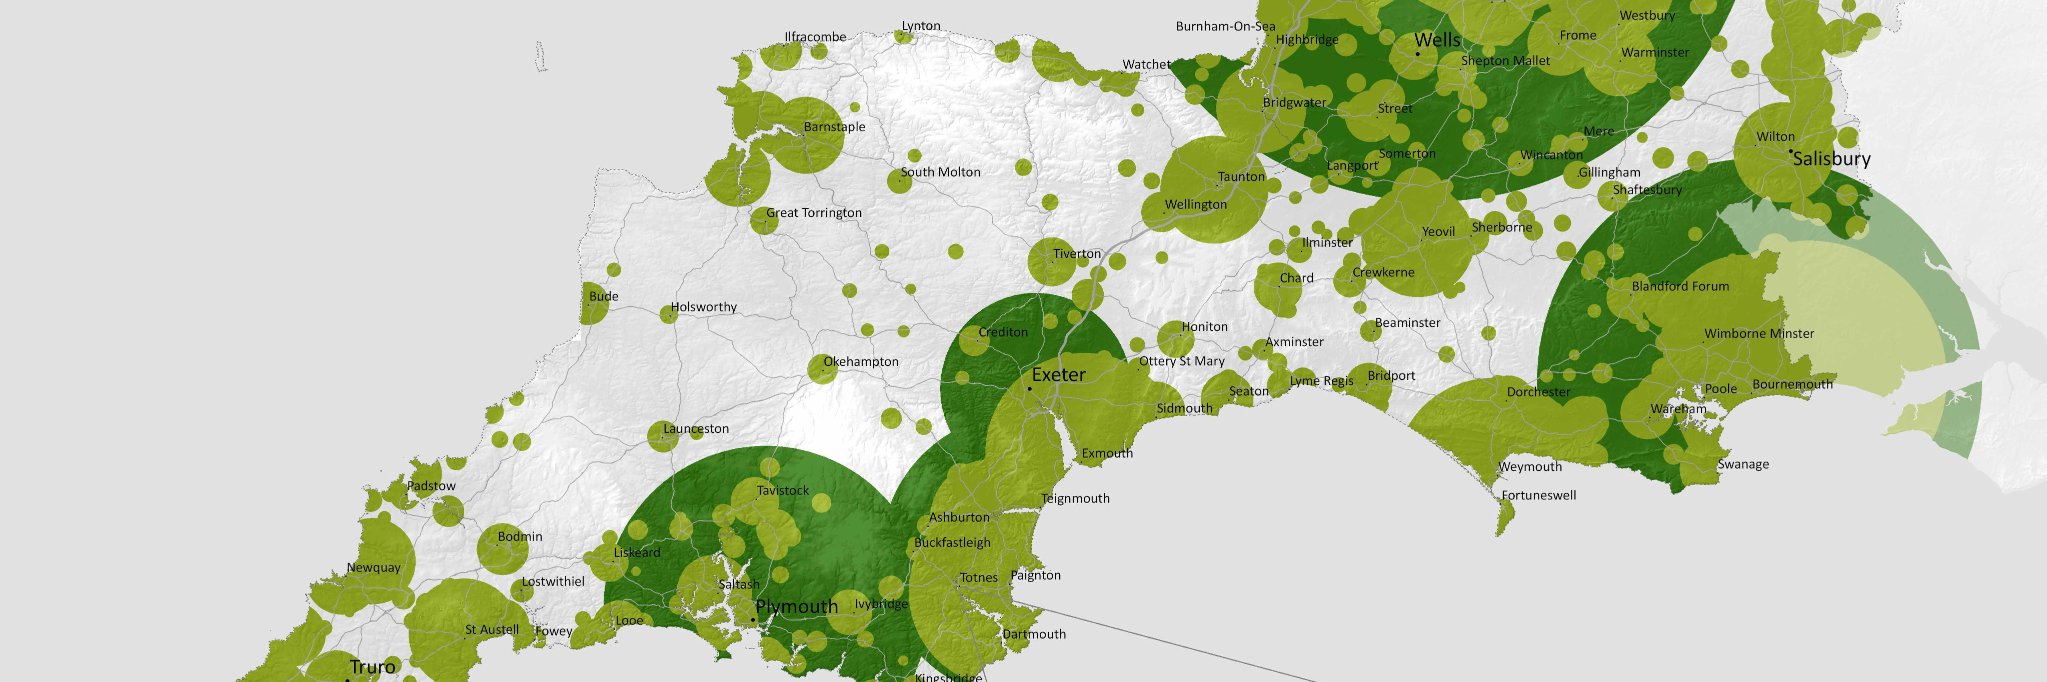
Bringing together supply & demand of people & accessible areas, biodiversity value, relative env. inequity, amenity & social value, spatial habitat links, restoration focus - understanding these spatial patterns can be done - 'Nature doesn't fit into a box' @CraigBennett3#30by30
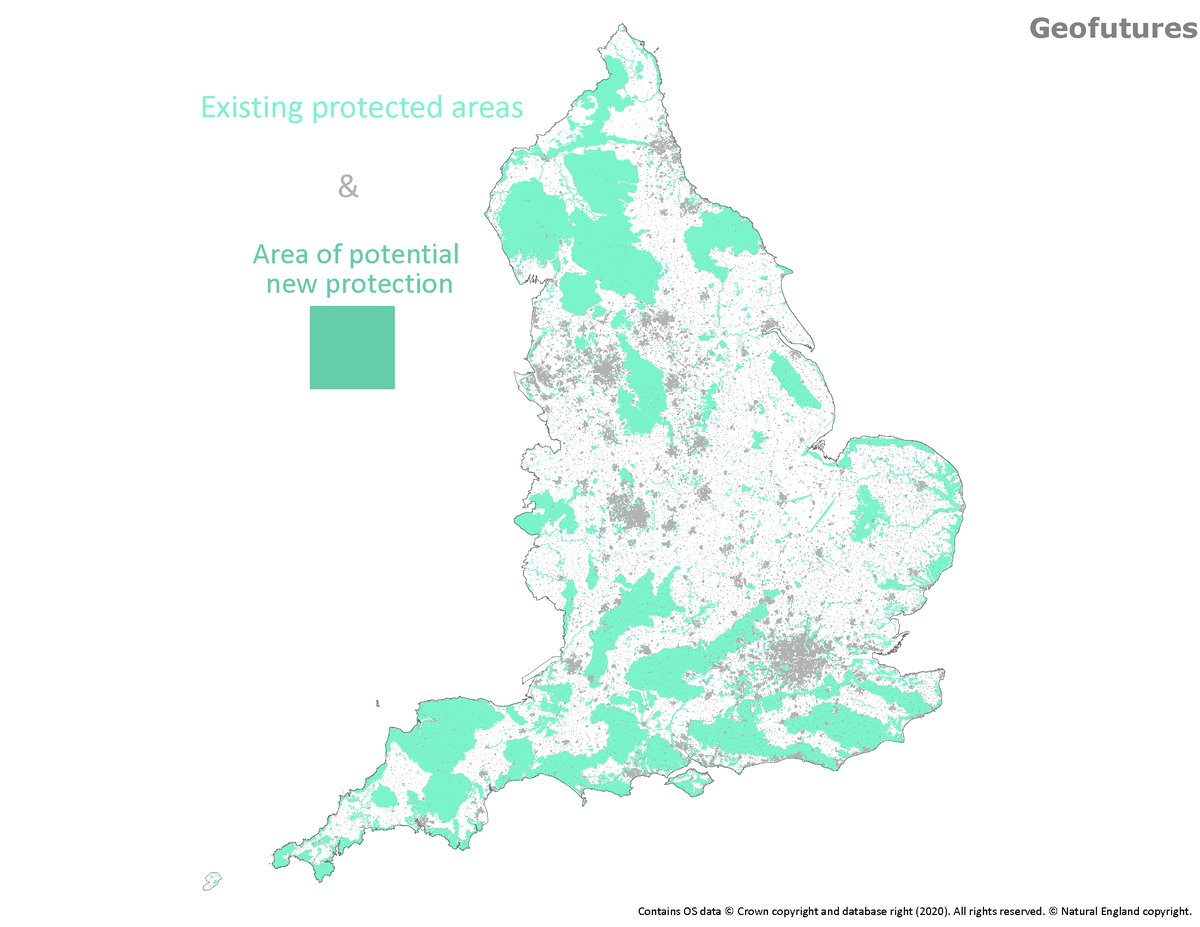
4% extra land to be protected in England https://t.co/VsSgidG6T1
A good opportunity here to use non-zonal & better data analysis to help understand where these priority places should be, including restoration within 'protected' areas.
@guyshrubsole What a great bit of analysis! Are the areas on the map tree-covered, or the extent of the land ownership? I wonder what the geography of the difference looks like e.g. is the 85% of Crown Estate land without trees in the North / South / coastal / urban?
@CarwynJThomas@DanRavenEllison@TheDeveloperUK https://t.co/wrOw7GMtdU this was an old red blaze sports pitch in Glasgow. Rewilded through lack of use and dereliction since the 1980s, and now a hugely popular spot for kids.
Last month we held our virtual networking event exploring #sustainability in the food sector. Featuring talks from experts in this field & included lightning talks from STBAH participants @mapsandstats @FlorencePardoe @CircleBristol Read the event roundup: https://t.co/94NYChmwxv
@charliejmccurdy@resfoundation@gustafmaja We used census data mostly due to the geography available and ease of using the SOC. Neighbourhoods with key workers and dependent children would be interesting to look at.
@PaulEmbery@unherd Lots of important points here. We were interested in where the communities struggling to navigate the lockdown you mentioned might be, and so we mapped them. It's not a perfect dataset, but it does start to reveal the 'sharp relief' of those places - https://t.co/GFnG1FVE3F