We curate the world’s most compelling maps to help you navigate topics affecting the planet and everyone who lives here. Submit your maps for consideration!
Snow is a key source of water for much of the American West. But snowfall during winter of 2025-2026 has been markedly absent in these areas. In other locations, like Michigan's Upper Peninsula and the Northeast, snow fell in abundance. https://t.co/5eht9lBZYI
With millions of riders across more than 400 stations, how can we detect patterns about how the system is being used? By mapping it, of course.
Explore maps from @Peterincan at @Esri, visualizing data from more than one billion subway rides in 2024.
https://t.co/LRMQ1uIwcf
See how @CartoGuophy brings clarity and beauty to the Köppen climate classification. In both static and interactive versions of these maps, the variety and complexity of Earth's climates are a joy to behold. https://t.co/567Uqy3Y4P
We recently launched a new series on @YouTube called 'Did Geo Know?'
These animated shorts explore interesting geographic phenomena through the lens of maps. And you can see new videos every week. https://t.co/g3EYxCz8O5
Wind has the power to carve mountains, shape weather, spread seeds and pollen, and even be harnessed as energy. But wind also behaves differently as you move through the atmosphere.
Learn how @windvectorapp helps make sense of this complexity. https://t.co/fPtqahr3eW
In addition to sea surface temperatures, our Earth in Action page includes daily animations for several maps related to weather, climate, and human activity.
Explore daily animations of air temperature and aerosols, including black carbon, dust, and even sea salt.https://t.co/9vV4hlC4dt
Meteorologists and forecasters are keeping a close eye on the Pacific, as signs of an upcoming El Niño are taking shape.
We've just launched 90-day sea surface temperature and anomaly animations. Both are updated daily.
https://t.co/aw9uHAIGJe
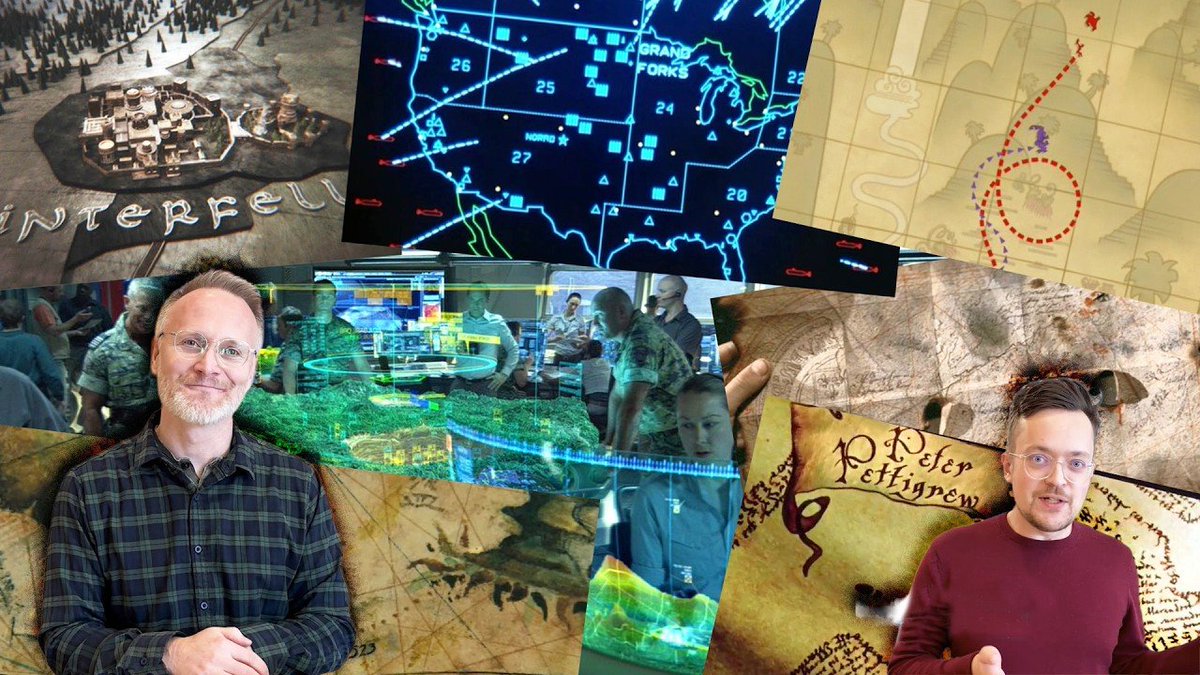
How accurate are maps on TV and in movies? And do they reflect the type of maps used beyond the silver screen?
Grab some popcorn and watch @John_M_Nelson and @Peterincan discuss some of cinema's most notorious cartography.
https://t.co/jFAQcuNrHM
What can be revealed when less is shown?
These fascinating maps from cartographer Perrin Remonté reimagine the world’s largest rivers as trees. https://t.co/MlkD8oq8kZ
The world watched as Artemis II visited the Moon and brought excitement and hope back to Earth.
Explore a timeline of humanity's lunar ambitions in this work by Anna Diederichs: https://t.co/oLLGGDJND7
We're sure it is better to be there. But even if you're still firmly on planet Earth, you too can explore the Moon.
Our map of the lunar surface shows named craters, landing sites, and other features of our only natural satellite.
https://t.co/ySwnVmhwXA
Mike Huff mapped over 600 lighthouses along the Atlantic coast.
In our latest Back to the Map, we hear more about this enormous project and Huff's creative process.
https://t.co/Ic0igJGVx5
Earth in Action by Esri's https://t.co/cxD9wuo5o9 brings planetary data to life, depicting the rise and fall of temperatures and the swirling of aerosols. https://t.co/q4R94RfToV
Arctic sea ice is experiencing a downward trend in total extent.
It's also getting thinner. See where these changes are happening in an animation from @NASA's Scientific Visualization Studio. https://t.co/pRBGumJbB2
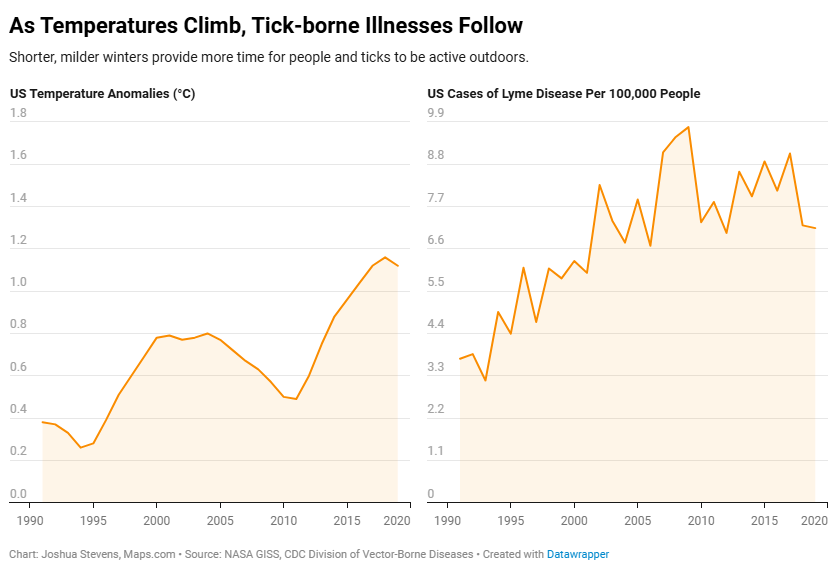
Earlier springs, longer summers, and warmer temperatures bring both people and ticks into nature at higher numbers.
And the implications for public health are serious.
Spring temperatures aren't the only thing arriving and climbing. As the weather warms, ticks are also on the move.
As spring temperatures trend warmer and earlier each year, ticks are expanding their seasonal and geographic range. The result: Lyme disease is on the rise.
https://t.co/mLTd4IEgGs
NASA recently confirmed a large meteor entered the atmosphere over Ohio. How common are these fireballs?
This map shows meteors detected by government sensors between 1988-2025: https://t.co/OF7hWMshMg
The Ohio meteor was nearly 1200 times smaller than the 2013 Chelyabinsk event.