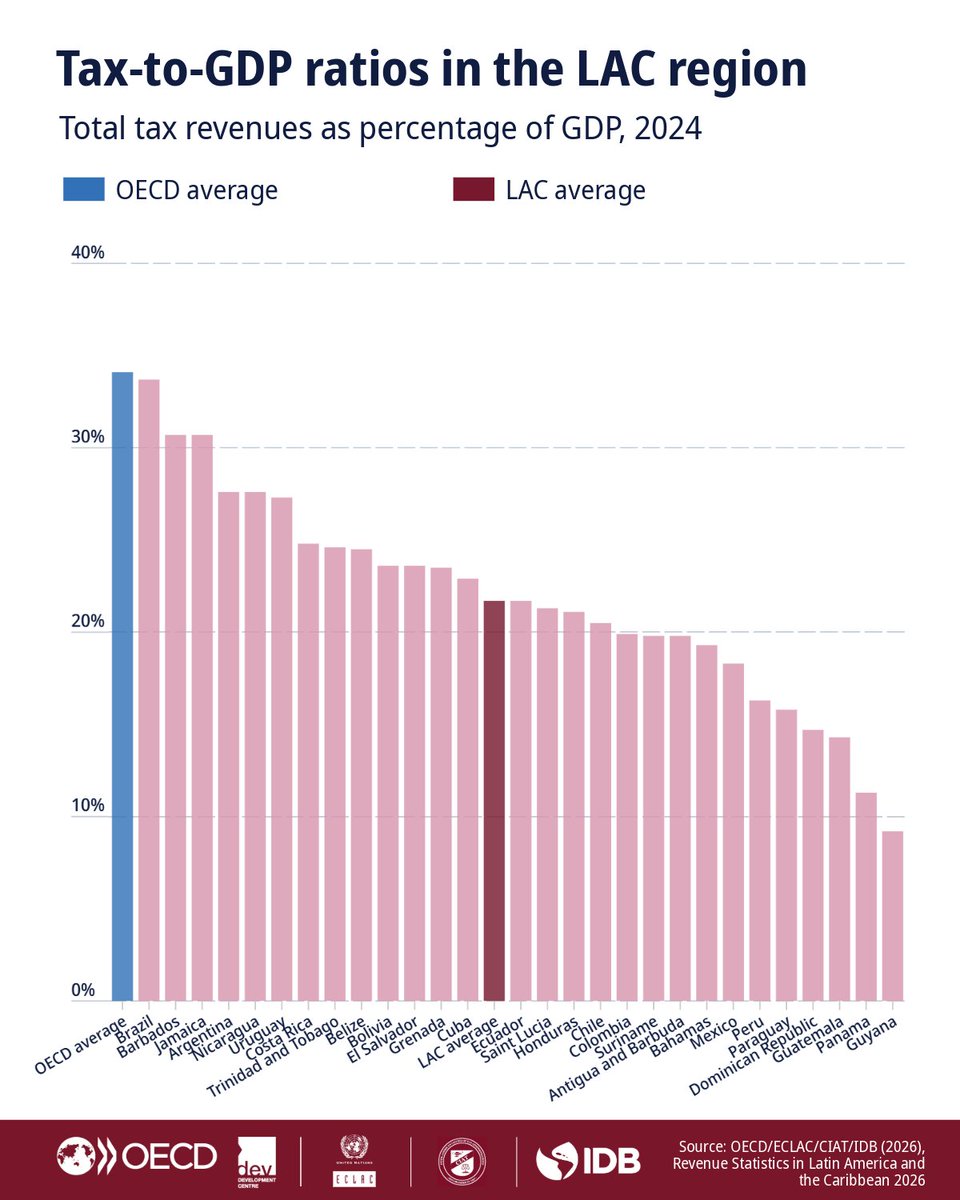
The average tax-to-GDP ratio in Latin America and the Caribbean (LAC) rose to 21.7% in 2024.
Across LAC countries, levels ranged from 9.2% in Guyana to 33.7% in Brazil.
Find out more in the latest #RevStatsLAC report: https://t.co/540z7u7ZOV
Girls born in the UK in 2024 can expect to live to age 90.2 years on average and boys to age 86.9 years based on projections of cohort life expectancy, which take into account assumed future improvements in mortality.
Read the full article ➡️ https://t.co/ZwPrYNQnJH
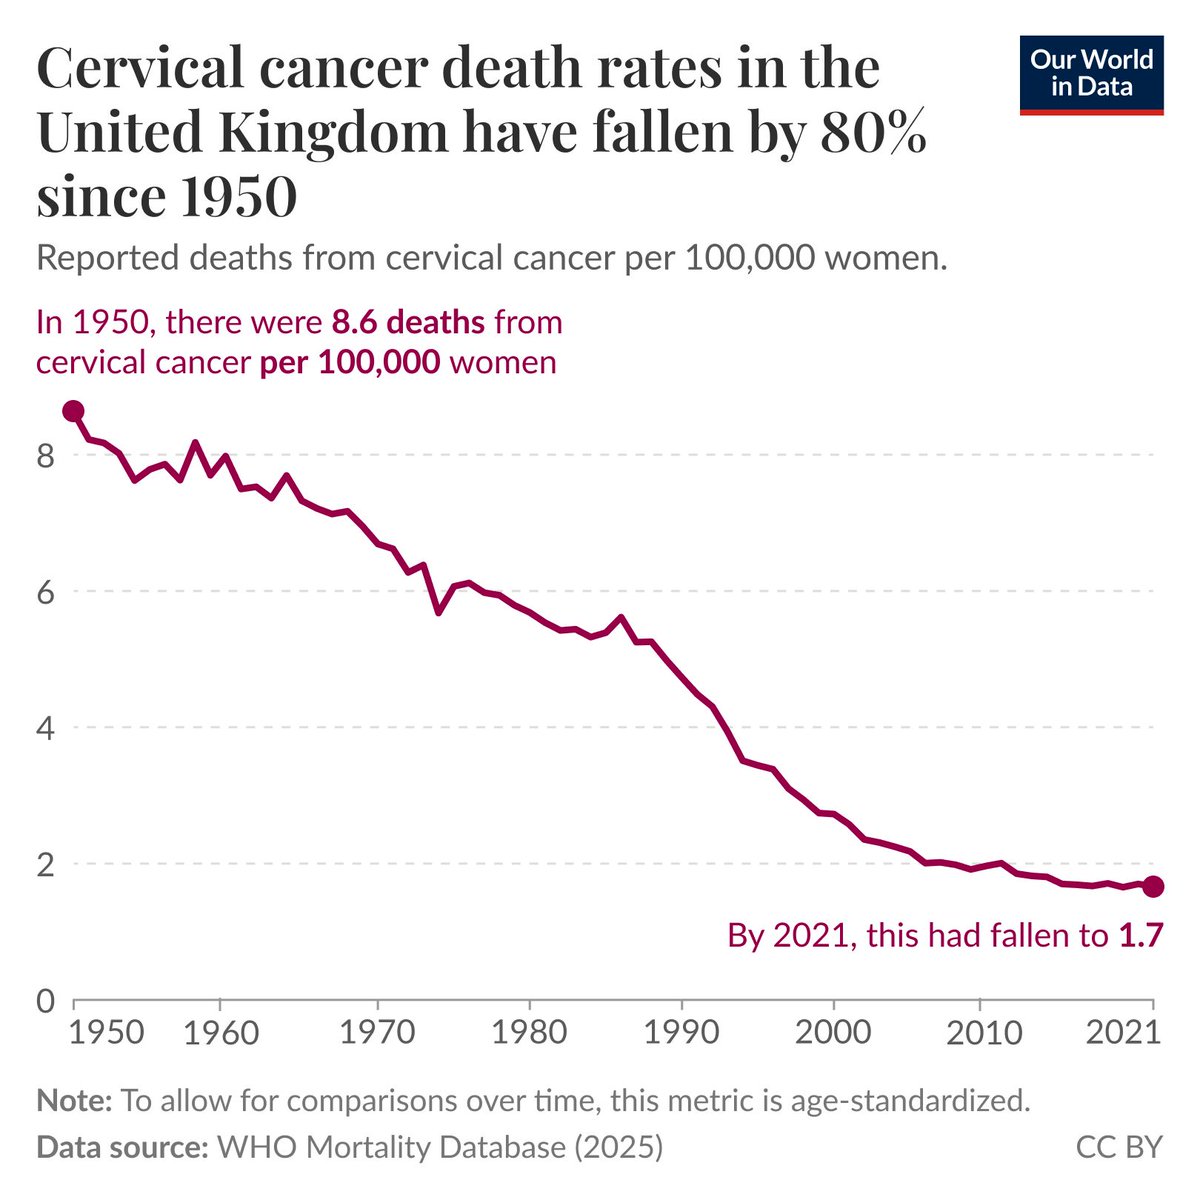
Death rates for cervical cancer in the United Kingdom have fallen by 80% since 1950—
Cervical cancer death rates among women in the United Kingdom have fallen by around 80% since 1950. You can see this reduction in the chart.
This progress happened for a couple of key reasons.
The first was the introduction of population-level screening programs in 1988. Across the UK, women are invited to get a regular smear test to detect precancerous changes or cervical cancer cases early, when treatment has much better odds of success.
Another, and more recent innovation, which could put the UK on the path to eradicating cervical cancer completely, is the rollout of the human papillomavirus (HPV) vaccine. This protects someone from the HPV infection, which can later develop into cervical cancer.
In schools across the country, girls in their early teens are offered the HPV vaccine, effectively offering them long-lasting protection. I was one of the first cohorts of girls in the UK to receive this, and it’s something I’m incredibly grateful for.
The UK is not alone in its progress: a number of countries have managed to reduce cervical cancer death rates in recent decades.
(This Data Insight was written by @_HannahRitchie.)
📊 How much do governments spend, and what do they spend it on?
In the chart, we see total government spending broken down by purpose, such as health, education, and defense, relative to the size of the economy (as measured by GDP). This is shown for a selection of OECD countries.
How much governments spend varies quite a lot across OECD countries: in France it’s 57% of GDP, while in Chile it’s less than half that (28%).
Keep in mind that these are relative shares, not absolute amounts. GDP itself varies considerably across countries, so the same percentage can represent very different sums depending on the size of a country’s economy.
For some categories, such as social protection — which includes things like pensions, unemployment benefits, disability support, and other benefits — the difference across countries is relatively large. For example, it’s 26% in Finland compared to 7.9% in the US.
In other categories, such as public services — which include things like paying interest on government debt, the running of core government functions, and foreign aid — the share is more similar across countries.
This data comes from the OECD’s Government at a Glance dataset, which covers 47 countries. Our colleague @parriagadap recently updated our charts with the latest release.
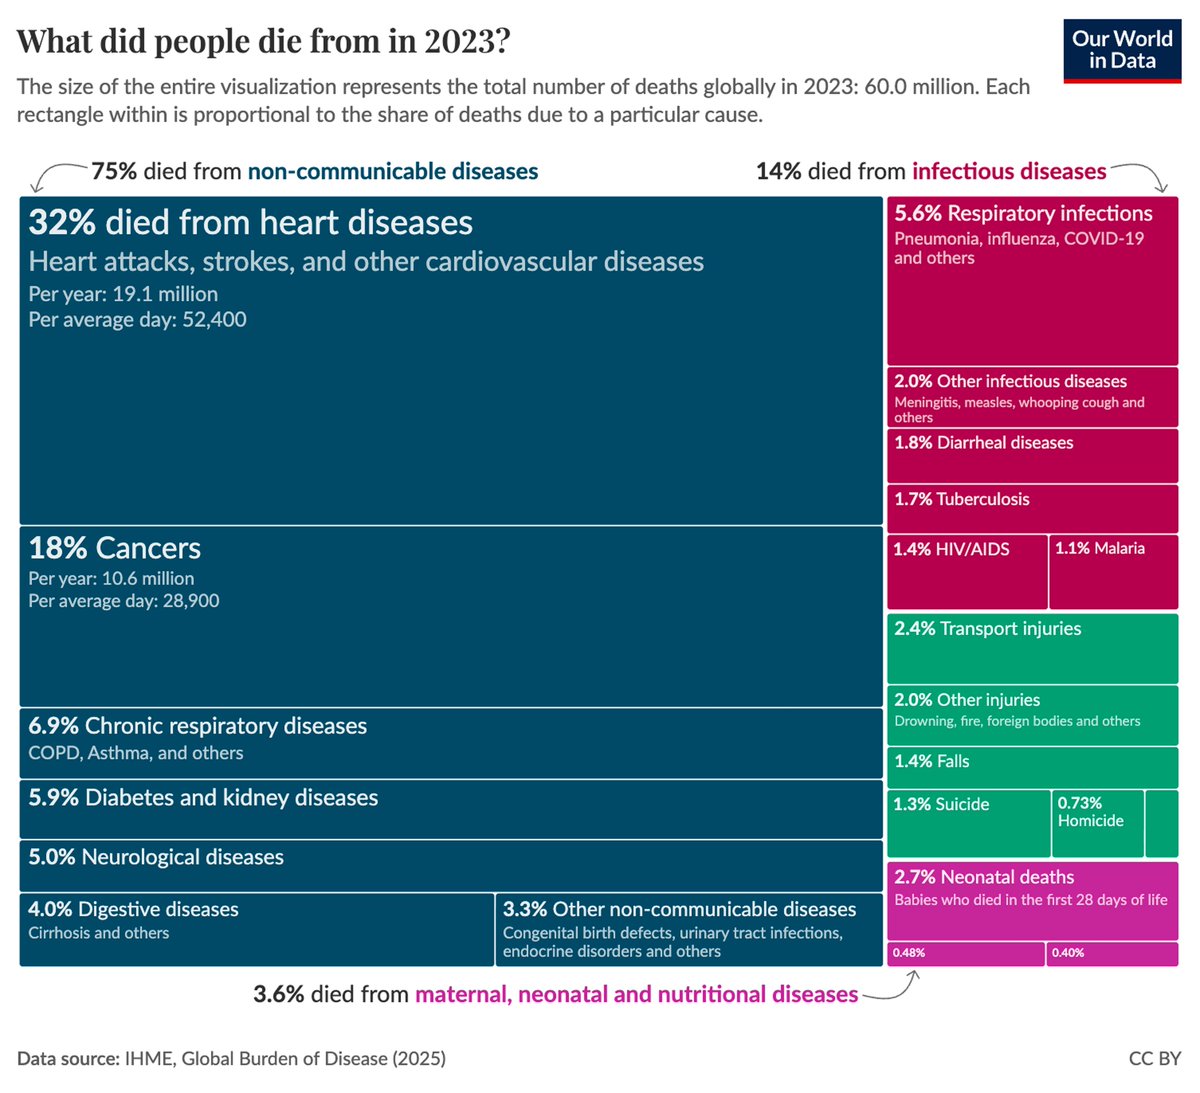
On any average day, 165,000 people die globally. That’s 60 million a year.
What do they die from?
🔧📊 Our colleagues Sophia Mersmann and Fiona Spooner built a new interactive tool that lets you answer this question, with data for every country.
Globally, 75% of deaths are from non-communicable diseases (NCDs). Heart disease alone is one in three.
Budget transparency is key to sound health budgets. Why are budgets for 26/27 for Free State, Limpopo, North West and NC not yet available on their websites? Five provincial revenue and expenditure estimates or EPREs are up and available for Ec, GT, KZN, Lim and WC provinces.
#SAHealth || Geographic and socio-economic differences in coverage and expenditure show that income and location are closely associated with health service access and spending patterns.
Read more here: https://t.co/kiEjIG62wN
#StatsSA#KnowYourStatsZA#GovZAUpdates
#SAHealth || Young adults aged 20–24 have the lowest levels of medical aid coverage across all age groups.
Read more here: https://t.co/kiEjIG62wN
#StatsSA#KnowYourStatsZA#GovZAUpdates
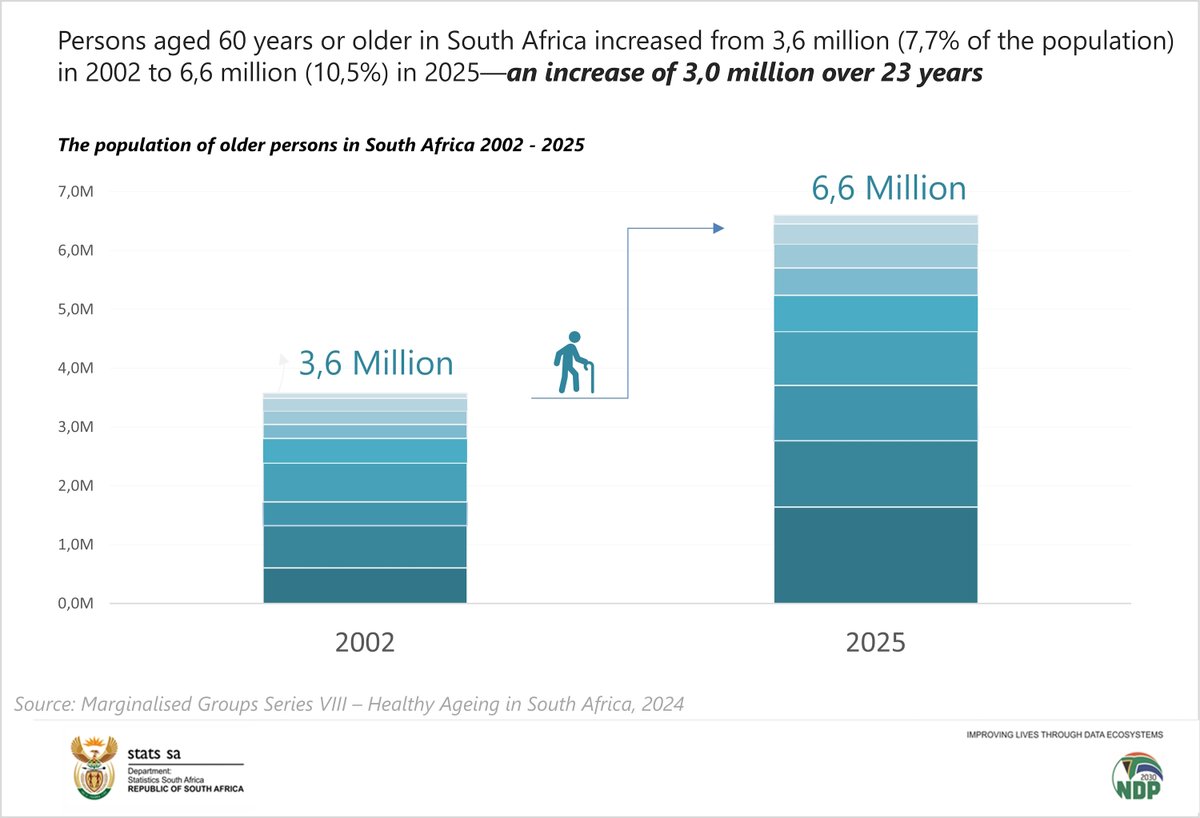
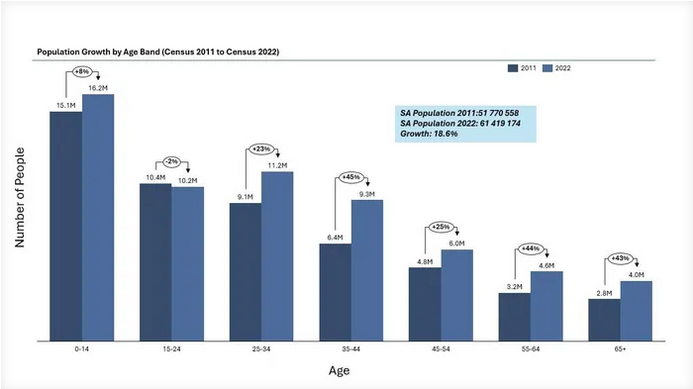
The number of persons aged 60 years or older in South Africa increased from 3,6 million in 2002 to 6,6 million (10,5%) in 2025; an increase of 3,0 million over 23 years.
Read more here: https://t.co/fYNJcwQWcl
#StatsSA#KnowYourStatsZA#GovZAUpdates
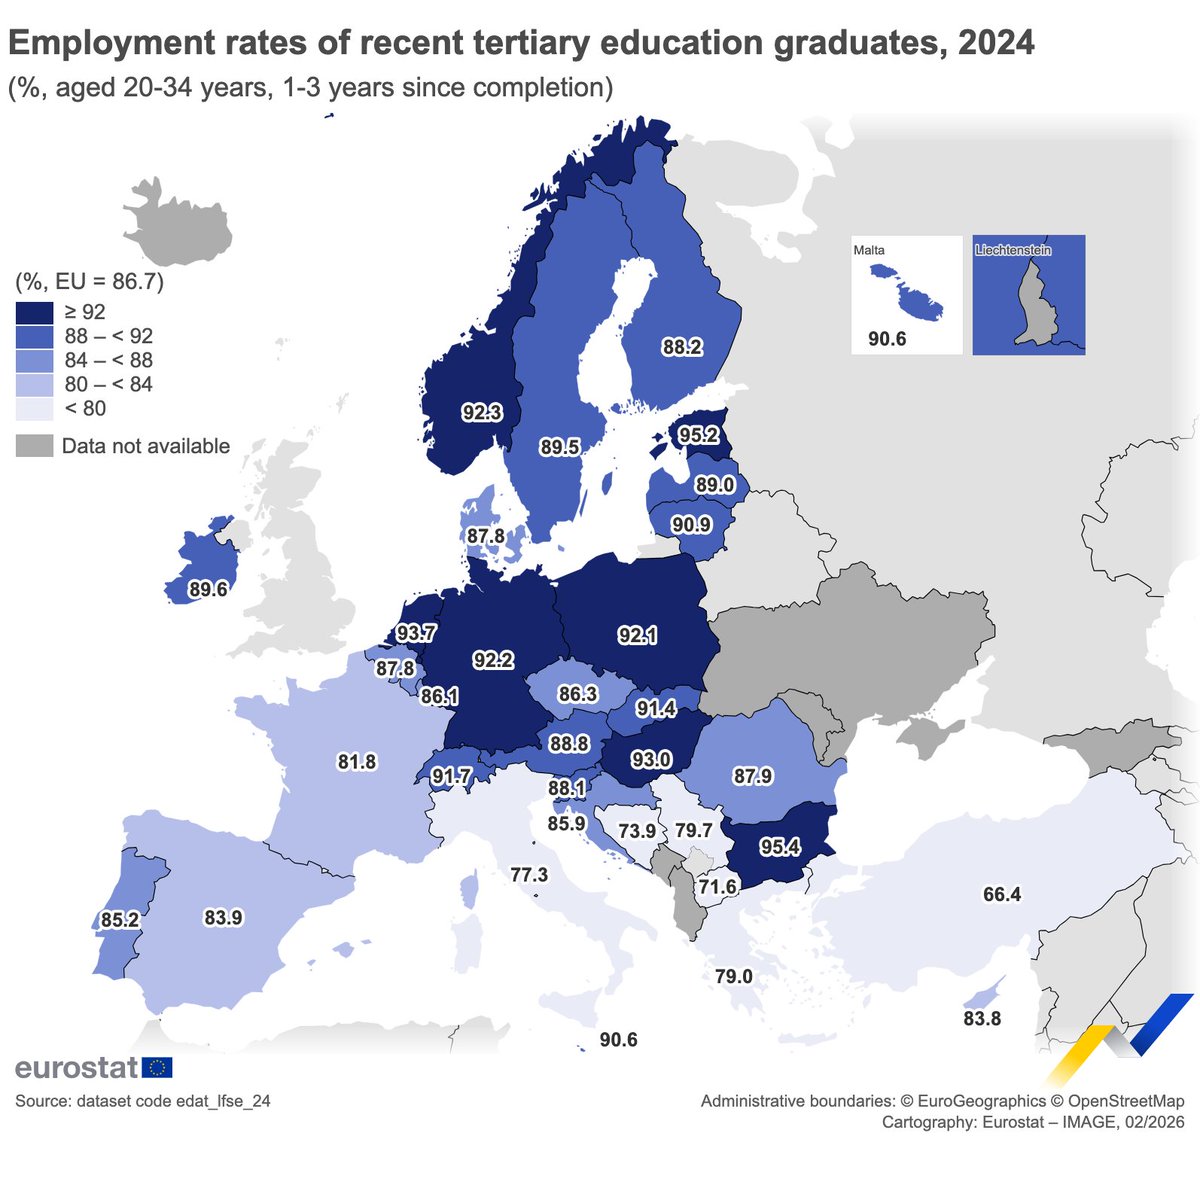
In 2024 the average employment rate for recent graduates aged 20-34, with tertiary educational attainment, in the EU was 86.7%. 🎓📚
Highest shares in:
🇧🇬Bulgaria (95.4%)
🇪🇪Estonia (95.2%)
Lowest in:
🇮🇹Italy (77.3%)
🇬🇷Greece (79.0%)
Learn more👉https://t.co/6mBojshCyq
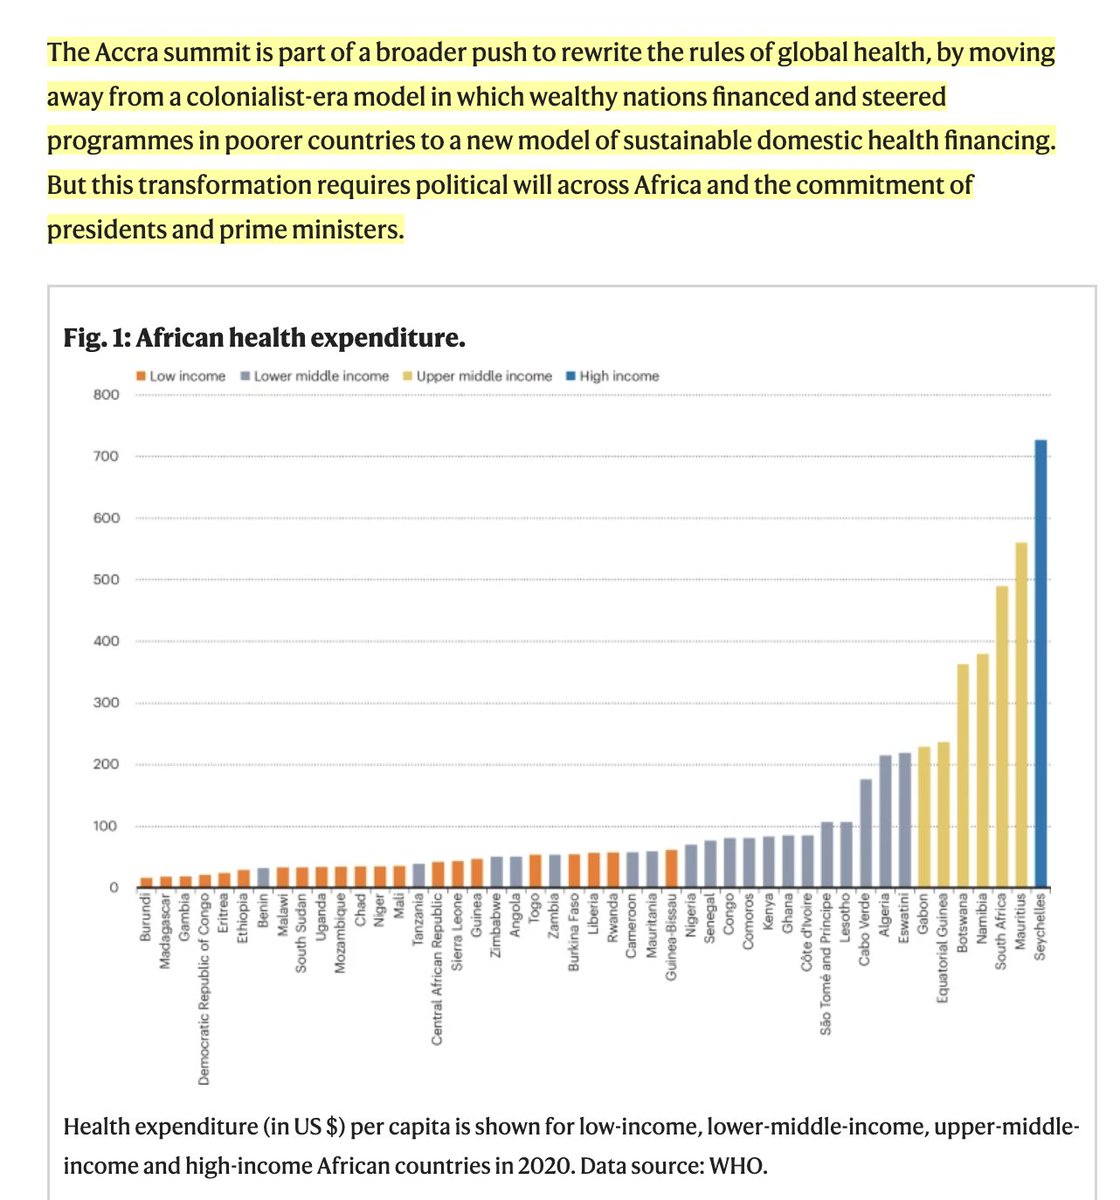
"...we suggest 10 ways the ministry of finance, as the custodian of a country’s public financial management system, can collaborate with the ministry of health to improve the quality of health spending..." https://t.co/aHqxeXJRXZ
Floating market "place"in Vietnam. "I'll be back in half hour, just go and buy some coffee." Do you think this will work?
Nature is so amazing, we must not destroy it.
#mbdtravel#travelinspiration#nature#ClimateCrisis
Fertility rates in Indian states according to the Sample Registration System in 2023. That year, the TFR was 1.91. In Southern India, fertility levels are already as low as in Europe while densely populated Uttar Pradesh and Bihar are still well above replacement level.
The final Budget Review & Outlook Paper 2025 is out, we saw the draft on Sep 20th (see quoted tweet).
Key highlights:
· Total 2026/27 expenditure is projected at Kes 4,649.8 billion (22.2% of GDP). So it's a 9.69% increase in the size of the budget vs 2025/26
· Total 2026/27 revenue including AIA is projected at Kes 3,583.4 billion (17.1% of GDP). So it's a 7.9% increase in projected revenue vs 2025/26
· 2026/27 Ordinary revenue is projected at Kes 2,998.3 billion (14.3% of GDP)
· The 2026/27 fiscal deficit is set at Kes 1,017.6 billion (4.9% of GDP). So it's a 10.23% increase in the size of the deficit vs 2025/26
· The deficit will be financed by external financing of Kes 241.8 billion & a domestic financing of Kes 775.8 billion. So GOK is looking to increase its domestic borrowing, vs 2025/26, by a tidy 22.07%
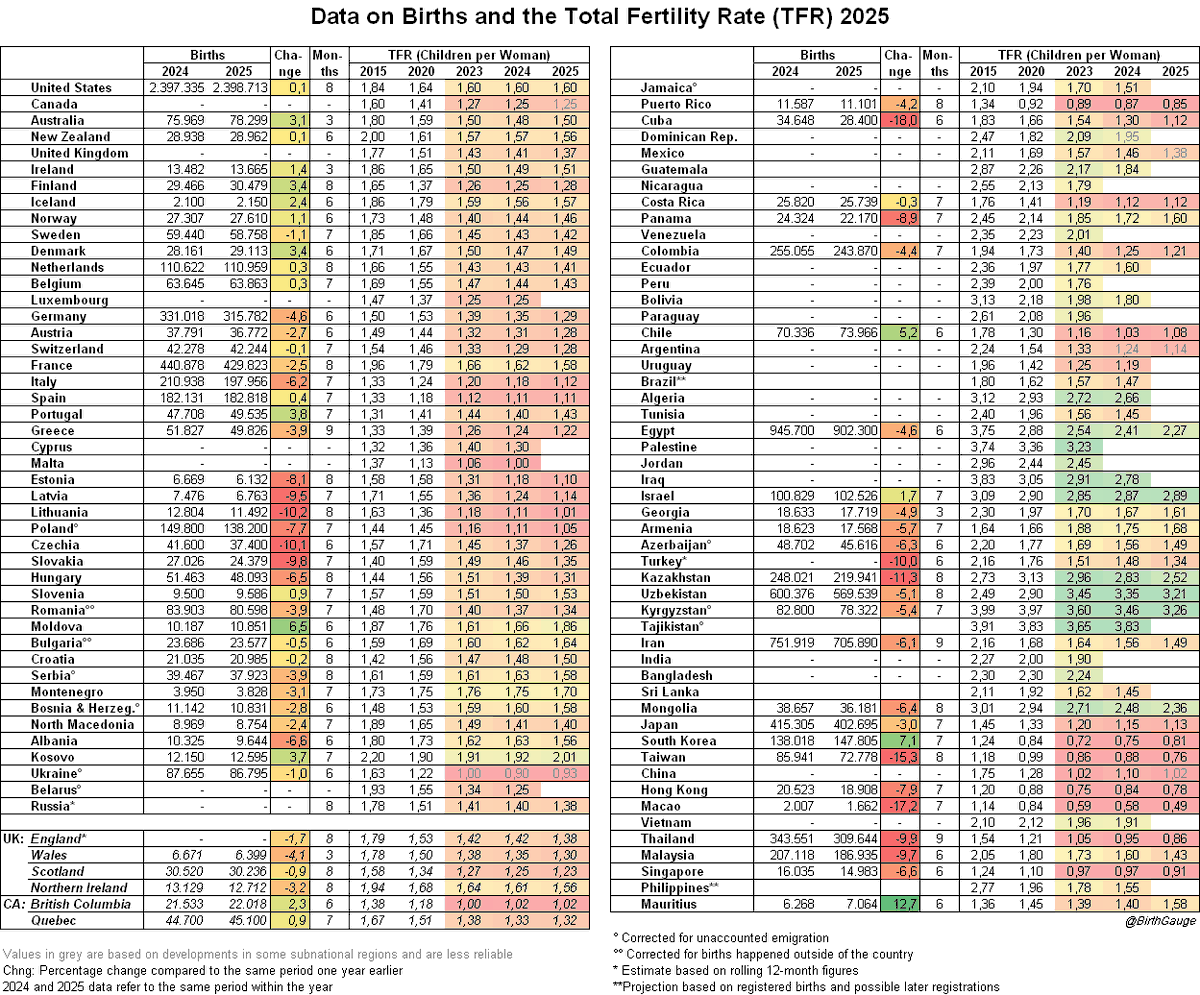
The newest fertility table has been released by @birthgauge, with much better birth data than the UN provides.
The steepest declines in 2025 are in Asia, Latin America and Eastern Europe. East Asia is converging on S. Korean levels, with ultra-dense urban housing taking a toll.