Quite possibly the best podcast I’ve ever heard on portfolio optimization and optimal asset allocation. Required listening for any serious investor or allocator. Well done @TopTradersLive. https://t.co/9jvORPUSON
Working paper on cross-asset HMMs for market regime detection. Clever bit: adding HY credit spreads pushed COVID-crash lead time from 23 to 141 days — credit markets front-run equities when institutions de-risk.
Methodology is rigorous (BIC selection, walk-forward OOS). What I'd push back on: the 141-day figure is n=1, and the 2022 rate shock gave only ~2 days notice. Walk-forward Sharpe barely beats buy-and-hold (0.881 vs 0.859).
The real benefit is drawdown protection (-17% vs -34%) at the cost of ~400 bps CAGR.
Still worth reading.
https://t.co/CSq2jGlmY0
More data is not always better, at least according to a new SSRN paper by Barrera & Alcantara-Lopez. Two things stood out to me:
1) More data isn't always better; The authors found that 1-2 year lookback windows for beta estimation had better explanatory power than longer windows. Older data adds noise from regimes that no longer apply.
2) Most don't need six-figure software to do institutional-quality risk analysis. Their 2-factor model built with yahoo finance data captured most of the explanatory power of commercial products (like Barra).
https://t.co/lutQNy6ypY
Interesting paper on AAM — basically says: stop forecasting returns, just avoid risk when it shows up.
It works. Left tail is almost eliminated.
But so is a lot of the right tail. Returns are pretty muted.
As constructed, not super practical. But add position caps, maybe some leverage, smooth the inputs… and it starts to look like a really solid overlay.
https://t.co/QnEO6tJ6UX
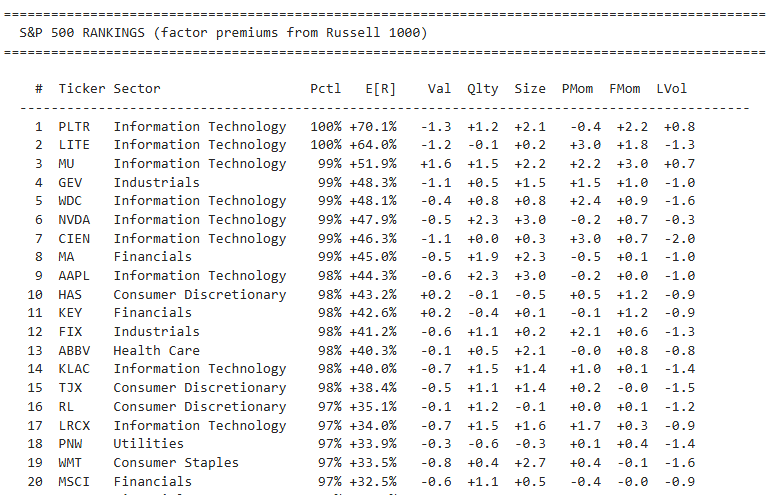
S&P 500 Quant Rank top 20 listed below. Ranked on 19 factors across 6 core themes (Value, Quality, Size, Price Momentum, Fundamental Momentum, Low Vol). Each stock's percentile rank on every factor is averaged into one score; lower = better. Not a recommendation, just where the model sits.