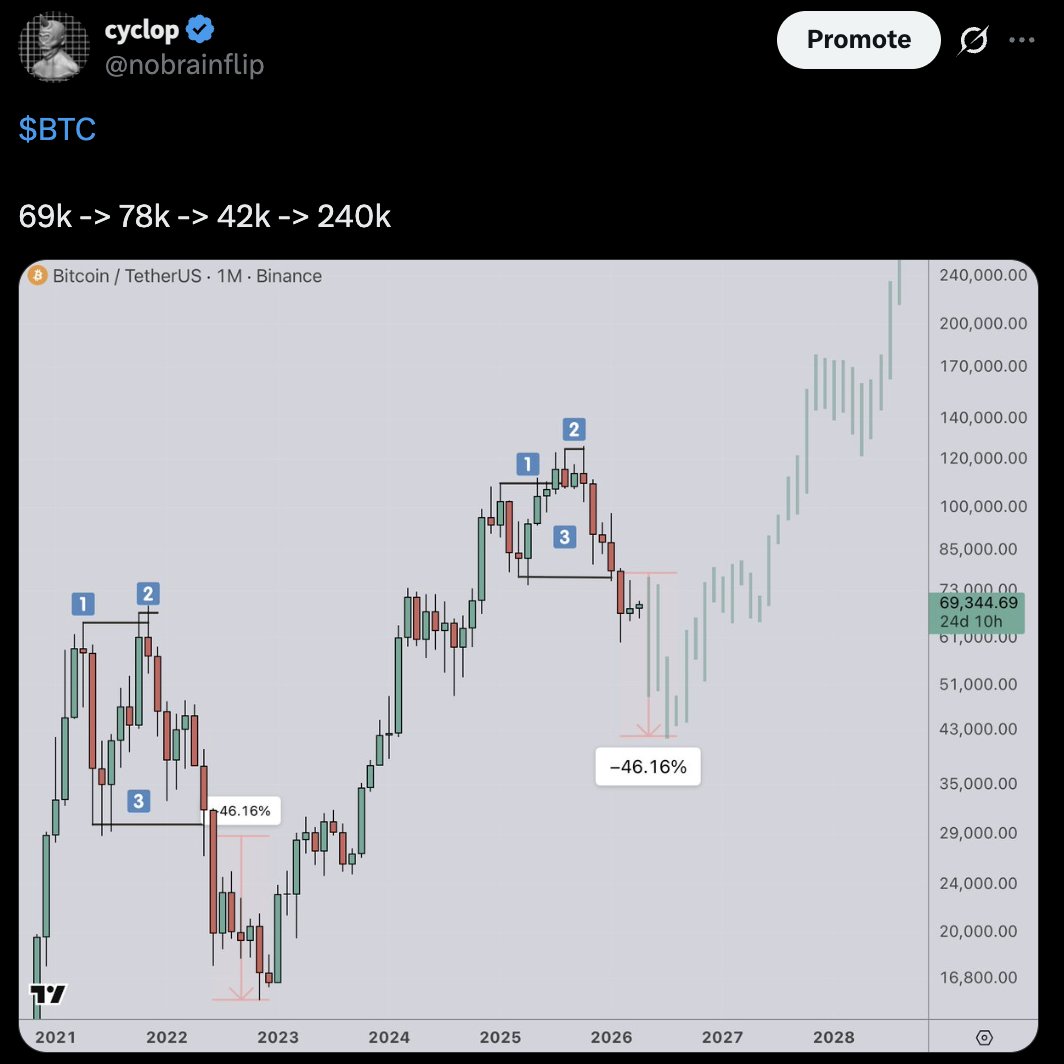
The Fed is now nearly 90% likely to raise rates next week and history says Bitcoin will dump after that.
The probability of a rate hike has jumped from 58.4% to 86.4% in only seven days, so I checked what Bitcoin did after every US interest rate hike since 2015.
The most interesting part is that Bitcoin rarely collapsed when the decision was announced. It often remained stable or even rallied, making the hike appear harmless.
Bitcoin closed green on 11 of the 20 decision days. But one month later, 10 of those 11 green candles had completely failed and Bitcoin was trading lower.
Across all 20 hikes, Bitcoin was lower after 30 days on 17 occasions. It traded below its decision day price during the next month after 19 of them, with a median decline of 9.3%.
From approximately $78K, the same decline would take Bitcoin close to $70,700.
The previous two times the Fed began a tightening cycle were even worse.
After the first hike in December 2015, Bitcoin lost 19.0% within 30 days. After the first hike in March 2022, it initially held up before trading 46.3% lower within 90 days.
This time, the market is not pricing only one hike. Futures currently assign a 72.6% probability that interest rates will be in December at least 50 basis points higher than where they are today.
Bitcoin may remain stable when the decision is announced. It may even pump. But eventually we will be seeing a sharp decline in the next 30 days.
🚨 THE NEXT 10 DAYS COULD BE ABSOLUTE CHAOS FOR THE MARKETS.
Five major events are coming back to back, and each one has the potential to move the markets.
September 10: PPI
The first major inflation test as it measures price changes from the producer side, so another hot reading will signal inflationary pressure.
That could immediately push the Fed to be more hawkish.
September 11: CPI
This is the big one, as the CPI will show whether consumer inflation is cooling or heating up again.
July CPI was 3.4%, so a hot print will almost confirm the Fed rate hike.
September 15: CLARITY ACT VOTING
This could be one of the most important days for crypto this year, as the Senate will hold a procedural vote on advancing the CLARITY Act.
September 16: FED RATE DECISION
This is where things could get wild.
The Fed will decide its next move on interest rates after seeing both PPI and CPI.
The decision, Warsh's press conference, and the Fed's new economic projections will pave the way for how markets will move next.
September 18: BANK OF JAPAN RATE DECISION
The BOJ interest rate decision will happen on September 18.
If BOJ turns more hawkish, USD/JPY could crash and cause turmoil in the markets.
PPI → CPI → CLARITY → FED → BOJ.
Five major catalysts in just 10 days, and this will cause a volatility explosion.
The 10-year Treasury yield is perhaps the most important financial benchmark in the global fiat system, as it drives valuations and market trends worldwide. It is widely—and erroneously—regarded as the risk-free rate of return.
The 10-year Treasury yield can be thought of as a key barometer of the US dollar-based fiat system—a critical measure akin to its beating heart.
Bond yields move inversely to bond prices. When bond prices fall, bond yields rise.
A rising 10-year Treasury yield signals trouble for the US dollar because it means investors are selling Treasuries, which pushes up the US government’s borrowing costs. That is why the 10-year Treasury yield is a major pain point for the US government.
The 10-year Treasury yield was 3.97% when the war started. Now it is around 4.60%, an increase of roughly 63 basis points.
I expect the 10-year Treasury yield to keep climbing over the coming weeks and months—until it forces the Fed’s hand. At that point, the intervention will be sold as “stability,” but the mechanism will be familiar: suppress yields by debasing the currency.
At today’s debt levels, every 1 basis point increase in the government’s average borrowing cost adds roughly $3.9 billion in annual interest expense. So a 63 bps rise is not trivial—it translates to nearly $250 billion in additional yearly interest costs, materially widening a 2025 budget deficit that was already around $1.8 trillion.
Higher yields mean the US government must pay tens or even hundreds of billions more in interest on its debt. At the same time, the global economy faces even greater added costs because Treasury rates serve as the benchmark for borrowing worldwide.
That is not an insignificant move. However, given all the headwinds I have discussed, I suspect the 10-year Treasury yield is headed much higher because investors will demand higher yields to compensate for rising inflation. Further, if Hormuz remains closed, drastically higher oil prices are all but certain. Higher energy prices mean higher prices across the economy and higher official inflation rates, which means investors will demand still higher yields to compensate.
The problem is that interest on the federal debt is already over $1.2 trillion and is now the second-largest item in the budget. The US government cannot afford yields going much higher because the interest expense would push it toward bankruptcy.
I am not sure how—or even if—the US government can manage this situation. Something has to give, and we will not have to wait long to find out what.
The Iran war may prove to be more than another foreign policy disaster. It could be the trigger that exposes the fragility of the entire dollar-based financial system.
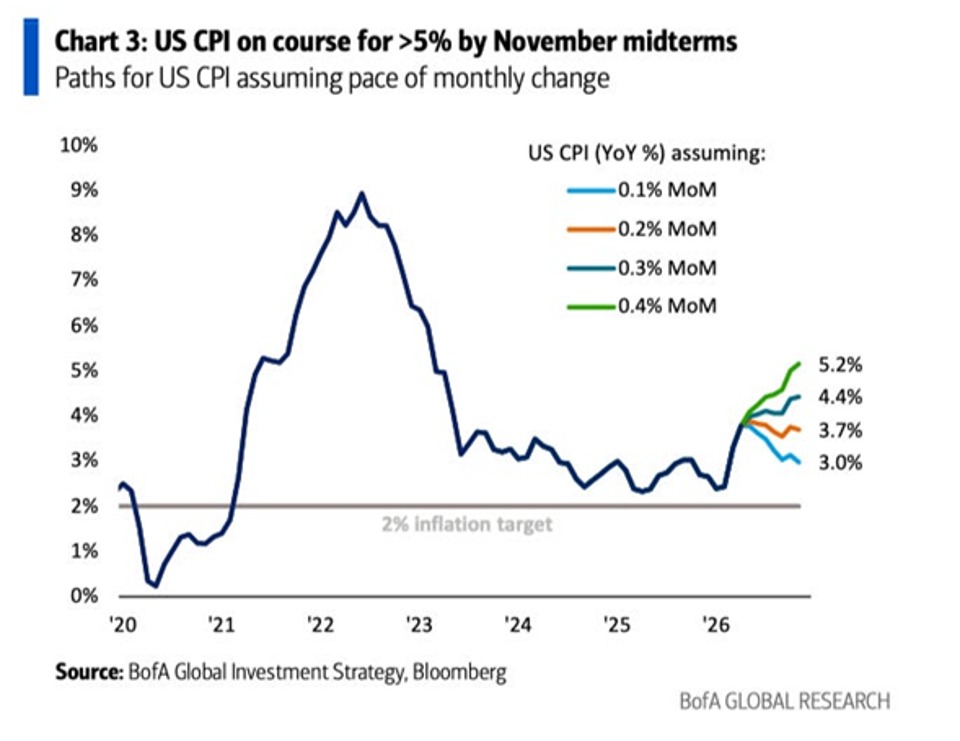
BREAKING: US CPI inflation is on track to exceed +5.0% as early as this year.
Over the last 6 months, CPI inflation has averaged +0.4% on a MoM basis, with March and April readings as high as +0.9% and +0.6%, respectively.
If this trend continues, this puts YoY inflation on pace to surge to +5.2% by the November midterms.
That would be the highest level since February 2023 and more than double the February 2026 print.
Even if monthly inflation prints ease to +0.3%, the YoY inflation rate would still rise to +4.4%, the highest since April 2023.
Inflation is back in full swing.
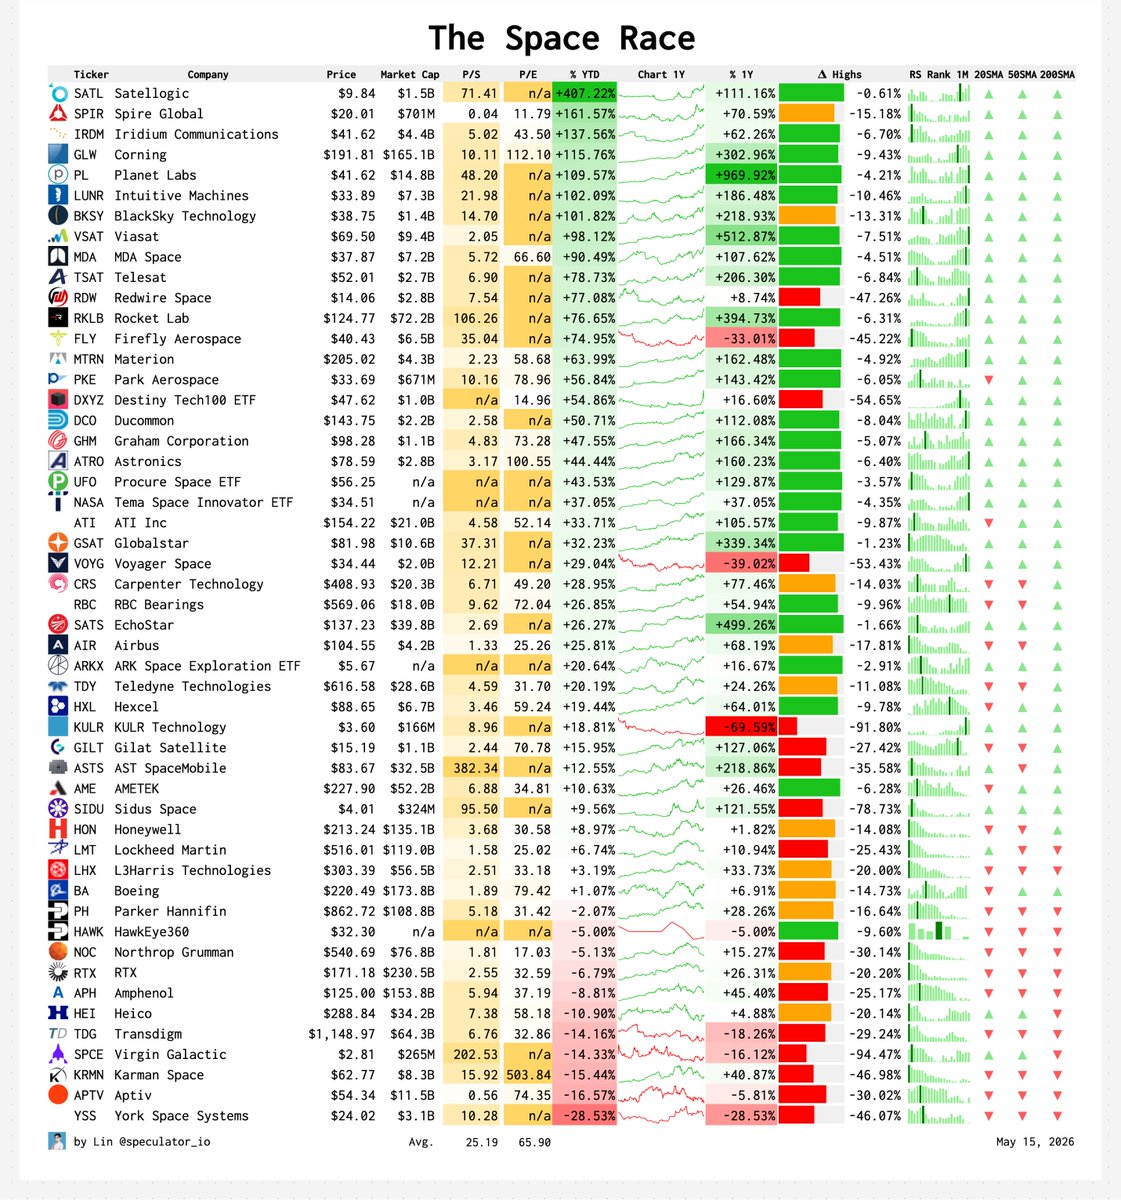
SpaceX $SPCX is planning to go public on June 12.
It's the biggest IPO in history and will instantly reprice the entire space sector.
These are the key space sectors to watch:
Launch Service Providers
$RKLB Rocket Lab
$FLY Firefly Aerospace
Space Imaging
$PL Planet Labs
$SATL Satellogic
$GSAT Globalstar
$BKSY BlackSky Technology
$SPIR Spire Global
$HAWK HawkEye 360
Satellite Communications
$ASTS AST SpaceMobile
$GSAT Globalstar
$SIDU Sidus Space
$SATS EchoStar
$IRDM Iridium Communications
$ETL Eutelsat
$TSAT Telesat
$GILT Gilat Satellite Networks
$VSAT Viasat
Space Infrastructure
$RDW Redwire Space
$LUNR Intuitive Machines
$MDA MDA Space
$VOYG Voyager Space
$YSS York Space Systems
Speciality Materials
$CRS Carpenter Technology
$MTRN Materion
$HXL Hexcel
$ATI ATI
$GLW Corning
$PKE Park Aerospace
Aerospace & Defense
$RTX RTX Corporation
$LMT Lockheed Martin
$KTOS Kratos Defense & Security
$VOYG Voyager Space
$LHX L3Harris Technologies
$NOC Northrop Grumman
$BA Boeing
$AIR Airbus
$HO Thales
Space Components
$TDY Teledyne Technologies
$APH Amphenol
$KRMN Karman Space
$RBC RBC Bearings
$PH Parker Hannifin
$AME AMETEK
$VELO Velo3D
$GHM Graham
$HEI Heico
$DCO Ducommun
$ATRO Astronics
Before you make your first million from trading, you will hit rock bottom.
It’s part of the process.
The same happened to me in 2020, just before I made it.
Keep going.
You can’t spell million without a couple L’s.
Why the Stock Market Is Going to Crash:
Part 1: What the 1973 Oil Crisis Teaches Us:
The Big Sunday Report: Back in 1973, about 5–7% of the world's oil demand was cut off for roughly 5 months, and the consequences led to the worst crash in history since the Great Depression! Today, around 20% of the WORLD'S OIL DEMAND has been affected for 2 months, and there's no end in sight. This means the situation today is even worse than it was during the 1973 oil crisis, and yet most don't understand the pattern! This brings me to the question of how the $SPX (SP500) behaved then, and we need to compare it with now. In 1973, the #SPX crashed 20% as in October 1973 the Oil Embargo was announced. During that time, the S&P 500 was 7% away from its ATH, recovering from an earlier 17% correction, and the market was in strong euphoria believing in the next rally. Investors thought the worst was over, and out of the sudden the embargo hit the market and we saw a sharp drop of 20% that followed in October 1973. The same we saw in March 2026, the Strait of Hormuz was closed and the S&P 500 reacted with a 10% downside move. This is what I call the first shockwave, but what if I tell you that the real, and much worse downside move happened after the announcement of the end of the oil embargo was made ?
The oil embargo officially ended on March 17, 1974. This is when the real crash began, and the S&P 500 crashed 40% within the next 6 months! This was the worst crash since the Great Depression, and only 2008 was worse. The crash didn't happen during the embargo. It happened after the embargo was lifted, when everyone assumed things were going back to normal. The damage to the economy, the inflation, the higher input costs, the broken consumer, had already been done, and the market understood the damage and we see it today as well, as the parallel today is direct. The S&P 500 is making new highs while an oil supply shock is unfolding. Investors are doing exactly what they did in 1973: assuming the issue will resolve and pricing in a soft landing. But once the economic damage becomes visible in earnings and consumer spending, the same delayed reaction is likely to play out, and this is exactly what was addressed by Jerome Powell in the most recent FOMC meeting! Inflation is rising again, the FED can't ease anymore!
Part 2: The Private Credit and Banking Risk:
There's a type of investment fund called a private credit fund. These funds lend money to large companies, working a lot like hedge funds. The problem is that they borrow huge amounts of money themselves to make bigger loans and bigger profits. This is called leverage, and it's a double edged sword. When things go well, profits are programmed, but when things go badly, losses are programmed too.
The situation right now is alarming. Investors are pulling their money out at a record pace, with over $7 billion withdrawn from major private credit funds in late 2025. BlackRock has even blocked some investors from withdrawing money. Loan defaults are at record highs as well, with 5.8% of private credit loans in default as of January 2026, the highest level ever recorded! About 40% of the companies that borrowed from these funds are now burning more cash than they earn, and the stock market is starting to notice, with shares of big private equity and credit firms falling sharply. If these funds collapse, banks go down with them, because banks lent them much of the money in the first place. So what happens if banks fail? Since the 2010 Dodd-Frank Act in the U.S. and the 2014 EU bank rescue rules, governments are no longer supposed to bail out failing banks with taxpayer money. Instead, they use something called a bail-in. They take money from depositors and bondholders and turn it into bank shares. The result is that bank stocks crash and ordinary people lose part of their savings. This is why physical gold and silver are the only real safe haven. I consider owning them a MUST.
The Main Warning Signs
The first and most important is oil. In 1973, oil first moved up, and the stock market crash came after the Arab nations reopened oil supply. The damage was already done. What we're seeing now in the S&P 500 looks like the final push higher before the expected crash. History is repeating itself. The second is the yield curve inversion. This happens when short-term interest rates rise above long-term rates, which is a clear warning sign. It has come before every U.S. recession in the past 50+ years, usually 12 to 24 months in advance. Back in 2025, I wrote a full report pointing to June 2026 as the likely crash zone, and the report was written in September 2025 and can be found here: https://t.co/zmp7L8Yi8c
The third is insider selling at record speed. Company executives and big shareholders have been dumping their own stock at a pace never seen before, especially since August–September 2025. When insiders are selling this aggressively, it tells you everything you need to know and thats something I observe since many months!
The fourth is extreme risk appetite, and right now it's at its highest point since 2021. In simple words, risk appetite means how much investors are willing to bet on risky things like stocks instead of keeping their money safe. Right now, investors are throwing money into risky assets like never before. According to EPFR fund flow data, risky assets have seen record net inflows exceeding safe assets by 220bn over the last 4 weeks, the strongest since the 2021 meme-stock peak. To put it simply, people are pouring much more money into stocks than into safe places, and the gap is the biggest we've seen in years. This also aligns with updates to S&P Global's Investment Manager Index risk appetite gauge and Goldman's proprietary RAI, both hitting multi-year highs. This is the same type of euphoria we saw right before the 2021 top, and history shows that when everyone is greedy and chasing the market at the same time, the top is usually very close and this is the moment when risk appetite is this extreme, it's a clear warning sign, and trust me, you dont want to be among the losers who bought the top!
The 1929 Parallel: Why You Need to Study the Great Depression
Study the Great Depression of 1929, and I can't repeat it often enough. Study it, you need to study 1929! You will notice many similarities. The people who owned physical gold and silver back then were the big winners. Land was sold for even one penny because there was no liquidity at all. Farmers had tons of wheat but there was no one able to buy it. The US President Herbert Hoover famously said right before the great depression, "Prosperity is just around the corner," talking about the stock market and its bullish movements and claiming that nothing could stop the upside move. Everyone in the US was invested in stocks back then, the same as today, as record amounts of retail investors are sitting on stocks currently, the highest amount of retails ever recorded. Now, a hundred years later, we have another president talking about the stock market like no one else. Trump is talking about being tired of winning, or calling it the best economy ever based on the stock market, and ignoring the real economy that is suffering and has no liquidity to breathe currently. I see tons of similarities, and I am scared to even speak it out, but my biggest concern is a repeat of the Great Depression. I am not a doomsday caller, but I am here to remind you that physical gold and silver are more important than ever, no matter what the price says.
My Trade and My Targets
Let me be clear about where I stand. I am not just talking, I am positioned. I have shorted the S&P 500 at 6400, 6700, 6900, and 7100, and my final order remains open in the 7400 region if the market gives us that opportunity. In my view, we are deep inside top territory, and I am placing my shorts right here, right now, for every single reason laid out above. The signs are everywhere. Spotting the top is not the hard part, anyone paying attention can see it. The hard part is pinpointing the exact target on the way down, because that depends entirely on one thing: will the FED print again? And the answer that history teached us is simple. The FED only starts to print once a crisis hits, and now lets ask the same for 2008, where the FED wasnt able to print more money, and the Lehman crisis and the 2008 crash started and how likely is it in the current time ?
In 2008, the FED did not intervene to save Lehman Brothers. Everyone expected a rescue, everyone assumed the FED would step in like it did with Bear Stearns just months earlier. But the FED let Lehman fail, the bank went bankrupt, and the entire financial system nearly collapsed with it. That single decision changed everything. It triggered the worst financial crisis since the Great Depression, and it is the exact reason the bail-in laws I mentioned earlier even exist today. Dodd Frank in the US and the EU bank rescue rules were both born directly out of the chaos of 2008, designed so that taxpayers would never again foot the bill. Next time, depositors and bondholders pay, and this is where the real risk hits the ordinary person. In simple words, if your bank fails, the government will not save it with taxpayer money like in 2008. Instead, the bank takes a part of your savings, anything sitting in your account, and converts it into worthless bank shares of the failing bank. Your money is gone, replaced by stock in a bank that just collapsed. In the EU, deposits up to €100,000 are technically protected by deposit insurance, and in the U.S. up to $250,000 by the FDIC, but anything above that is fair game, and history has already shown us this is not theory. It happened in Cyprus in 2013, where depositors lost a huge chunk of their savings overnight, and this will let the fire of the crash expand.
So for my targets, I see three realistic scenarios, and they all depend on the FED:
Scenario 1: The FED panics and prints again. If inflation cools enough to give them room, they flood the system with liquidity, and the crash is contained to a sharp but limited drop. This is the most "comfortable" outcome for the market.
Scenario 2: The FED is trapped by inflation and cannot print. With inflation rising again, as Powell himself just confirmed, the FED may have its hands tied. No money printing, no rescue, and the market bleeds out for months. This is the painful, drawn-out scenario.
Scenario 3: A full 2008-style collapse. The FED lets something break, just like they let Lehman break, and the entire system cracks open. Bail-ins get activated, banks fall, savings get wiped, and the SP 500 sees a crash on the scale of 2008 or worse. This is a very real option, and I refuse to take it off the table.
I am positioned for all three, and depends on the targets the probability that we are at top area is extreme high. The only question left is how deep the FED is willing to let this fall, and based on inflation, based on Powell's own words, and based on the political climate, I believe the risk of scenario 2 or 3 is far higher than the market is currently pricing in. The top is in, or it is extremely close. I am short, and I am staying short with an invalidation once the FED starts printing once again!
The next weeks will be very important and many will miss out on real time updates and thats where premium is worth everything. It costs $59 / month and thats less than some of the trading fees you are paying! I cant repeat it more often but premium offers insights you are getting no-where else. Join here: https://t.co/kcREa27FtQ
🇺🇸 POWELL IS LEAVING
The new Fed Chair will be Kevin Warsh.
Historically, when a new Fed Chair is selected, Bitcoin crashes HARD.
2014:
Janet Yellen becomes Fed Chair
$BTC drops -82%
2018:
Powell becomes Fed Chair
Bitcoin drops -73%
2022:
Powell begins his 2nd term
Bitcoin drops -61%
History could repeat here…
🚨 US CANNABIS — DOJ HAS MOVED
Acting AG Todd Blanche.
Justice Department official release just crossed.
The structure is a two-track hybrid — and the detail matters:
TRACK 1 — IMMEDIATE Schedule III, narrow scope:
→ FDA-approved marijuana products (Epidiolex & future approvals)
→ State-licensed MEDICAL marijuana programs ONLY
→ Per AP: “cannabis products that aren’t distributed through state medical marijuana programs will continue to fall under Schedule I”
→ Registration pathway for state medical operators to register with DEA
TRACK 2 — Fresh hearing for the broader reschedule:
→ DEA withdraws prior notice of hearing; terminates the stalled Mulrooney proceedings
→ New expedited administrative hearing begins June 29, 2026
→ Firm deadlines, accelerated process
→ Covers adult-use cannabis rescheduling
This is not a clean Scenario B. It’s a surgical carve-out + a procedural reset.
Who wins immediately (280E relief on medical revenue only):
• $TCNNF — highest medical exposure (FL-heavy)
• $CURLF — strong medical sleeves (FL, PA, NY medical)
• $GTBIF — meaningful medical portions across footprint
• $CRLBF, $VREOF — medical sleeve benefit
Who waits until after the June 29 hearing for full relief:
• All adult-use revenue across the MSO complex — the majority of most operators’ P&L
The legal architecture is brilliant:
DOJ narrowly scoped the immediate action to categories with strongest federal deference footing — FDA approval + state medical regulation.
SAM Action / Barr APA challenge now targets a structure specifically engineered to survive. Immediate injunction unlikely.
Revised price framework:
• Initial tape: $MSOS rips toward $6.00-6.50 on headline
• Institutional reprice as medical-vs-adult-use revenue split gets modeled
• $7.25 (52-wk high) is the ceiling absent favorable June 29 hearing outcome
• Full upside requires Track 2 completion
Three catalysts now on the calendar:
1.Federal Register entry confirming Track 1 effective date
2.June 29 hearing commencement — Track 2 start
3.Hearing conclusion / final rule for adult-use rescheduling
What’s still NOT in the announcement:
• Up-listing pathway to NYSE/Nasdaq
• Interstate commerce
• Banking / FinCEN reform
• Adult-use immediate relief
The bottom line:
DOJ delivered a partial win — faster than the market modeled, narrower than the tape priced. Medical-heavy operators are the cleanest trade. Adult-use exposure now becomes a June 29 hearing bet. $CURLF debt wall math transforms for the medical sleeve; adult-use refinancing still depends on Track 2 execution.
Rescheduling moved from “when, not if” to “partially now, rest by hearing.”
The market priced a binary. DOJ delivered a bifurcation.
$MSOS $CURLF $GTBIF $TCNNF $CRLBF $VREOF
#USCannabis #Rescheduling #280E #MSOGang #CannabisInvesting
🚨 US CANNABIS — The DOJ Order, Decoded
I’ve read all 33 pages of the final order signed by Acting AG Todd Blanche.
Effective April 22, 2026.
This is not what the market has priced.
Three provisions nobody’s talking about. Full breakdown ↓
$MSOS $CURLF $GTBIF $TCNNF $CRLBF $VREOF
@MDoofis @DAGToddBlanche @POTUS Hearing starts June 29th: My best guess is hearing process is done and final rule to reschedule all marijuana issued before end of year, likely in Q3. Seems fast to me!
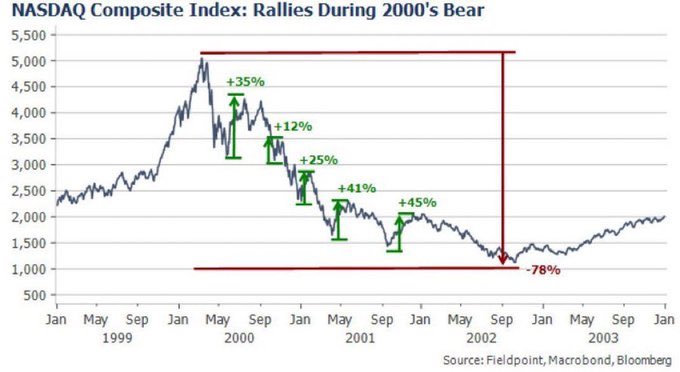
The Nasdaq during the Dotcom crash. 2000 to 2002.
Total decline: −78%.
Along the way:
+35% rally
+12% rally
+25% rally
+41% rally
+45% rally
Every single one felt like the bottom.
Every single one was a trap.
The +45% rally was the cruelest.
It came right before the final collapse.
This is the anatomy of a bear market.
Violent rallies that shake out the shorts.
Convince the bulls to re-enter.
Then resume the decline.
The market tells you the entire day's direction before 9:30 AM even opens
Not with indicators. Not with news. Not with "gut feeling"
With a single candle that printed 3 hours before you woke up
95% of retail traders show up at 9:30 blind. The 5% who check this one thing already know which way the market is going before the opening bell rings
Here's what nobody teaches you:
Every trading day has a script. And the script gets written between 2:00-6:00 AM while you're sleeping
It works like this:
The market moves in sessions. Asia. London. New York. Each session has a job. And if you understand the job of each session, you already know what the next one is going to do before it opens
The sequence:
If the previous session REVERSED - the next session CONTINUES
If Asia reversed? London continues. If London reversed? New York continues. If no session reversed? New York is the reversal
That's it. That's the entire daily script. The market rotates between reversal and continuation across sessions. It has done this every single day for decades
Here's how the script actually plays out:
SCENARIO 1: London reversal -> New York continuation
London opens at 2:00 AM. It pushes price into a key level - previous day's high or low, a fair value gap, a relevant swing. It sweeps the liquidity. It reverses. By 6:00 AM, London has already decided the direction
The 6:00 AM candle confirms it. If it swept a high and closed back below it - bearish day. If it swept a low and closed back above it — bullish day
Now New York opens at 9:30. The direction is already decided. NY's job is not to figure out where the market is going. NY's job is to CONTINUE what London started
This is why the 9:30-11:00 window is so powerful. You're not guessing. You're continuing a move that's already confirmed
Price opens. It pulls back into a fair value gap that London's expansion created. That gap is your entry. Stop behind the gap. Target the next liquidity pool. Done by 10:30
SCENARIO 2: No previous session reversed → New York reversal
Asia consolidated. London consolidated. No session made a move. No expansion. No gaps. No direction
This means New York has to do it. 9:30 is the reversal session
This is where the volume comes in. 8:30 news or 9:30 open - institutions use this to push price into a key level, grab liquidity, and reverse
You wait for the sweep. You wait for the displacement. You wait for the V-shape signature - aggressive move in, aggressive move out, gap forms. That's your reversal confirmation
SCENARIO 3: Asia reversal → London and New York continue
This is the highest probability day. Asia already put in the low or high of the day. Every session after just expands in the same direction
When Asia is the low of day, the 4-hour candles that form after will be expansion candles. Those expansion candles create gaps. Those gaps are your entries for London and New York continuation
You mark the gap within the previous 4-hour candle's range. You wait for price to pull back into it. You enter. Same direction all day. Multiple opportunities. Same setup repeating
The model behind all of this:
Price only does two things. It moves from internal liquidity to external liquidity. Then back. Forever
Internal = fair value gaps. Where orders didn't fill. Where price returns
External = swing highs and lows. Where stops sit. Where price sweeps
Price sweeps external -> fills internal -> targets opposite external
Every session. Every day. Every asset. Every time frame
The session just tells you WHEN the next leg of that cycle starts
How I use this every morning:
6:00 AM - Check the 4-hour chart. Did the previous session reverse or just consolidate? If London reversed, I'm trading New York continuation. If nobody reversed, I'm trading New York reversal
6:05 AM - Mark the 6 AM candle. Did it sweep a key level and close back inside the range? Reversal day. Did it expand through? Continuation day
9:15 AM - Mark the gap from London's expansion. That's my entry zone. Mark the next external liquidity. That's my target
9:30 AM - Watch for price to pull back into the gap. If I'm trading continuation, I want a shallow retracement. If I'm trading reversal, I want the V-shape
9:45 AM - Entry confirmed. Stop behind the gap. Target the next draw on liquidity
10:30 AM - Either in profit or stopped out. Done
11:00 AM - Laptop closed. Day is over
A trader I work with used to show up at 9:30 and "react to price action" for 6 hours. 43% win rate. Breaking even after fees
I told him one thing: check what the previous session did before you sit down
He started profiling sessions. London reversed? He only looked for continuation. Nobody reversed? He waited for the 9:30 sweep and reversal setup. No setup in the first 90 minutes? He closed the laptop
Same strategy. Same setups. Same risk. Added one filter
Win rate went from 43% to 64%. First funded account within 60 days. Now he's done trading by 10:30 every morning
He didn't learn a new strategy. He learned to read the script that the market writes every morning before he wakes up
The sessions tell you the direction. This model tells you the entry. The gap tells you where. The sweep tells you when
Most traders spend 6 hours searching for setups that the market already showed them at 6 AM
The script is free. It prints every single morning. You just have to learn to read it
Or keep showing up at 9:30 blind and wondering why you're not profitable
Your choice
(I teach session profiling and the model i use inside my free Discord. Live every morning before the open. Link in bio. DM me "SYSTEM" for 1-on-1 coaching)
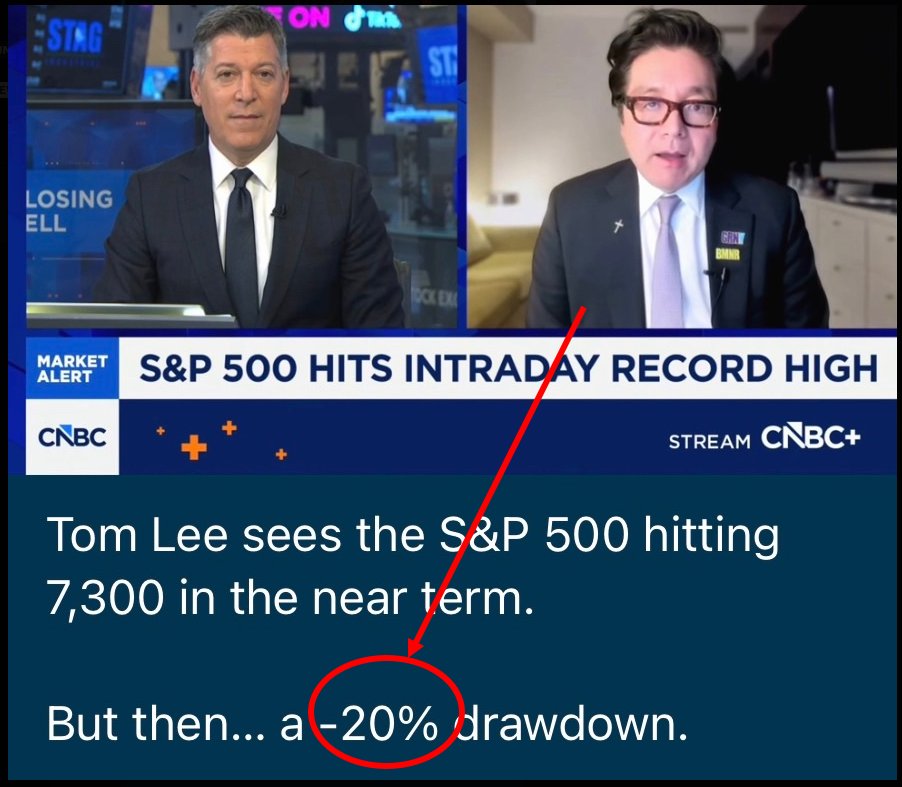
$730 is SPY target right now, but after it will crash 20% says Tom Lee to $580.
When ON SALE, I'd add these 20 stocks:
1. $IONQ – Quantum computing leader with massive asymmetric upside
Buy zone: $20–25 = early-stage value accumulation
2. $IREN – Cheap energy + AI compute = powerful margin expansion
Buy zone: $25–30 = strong support + cost advantage
3. $ASTS – Space-based telecom disruptor with global scalability potential
Buy zone: $65–70 = high conviction accumulation
4. $CRWV – AI data center REIT riding infrastructure demand wave
Buy zone: $70–75 = early positioning before scale
5. $GOOG (Alphabet Inc.) – AI + search dominance with strong cash flow engine
Buy zone: $150–170 = major institutional demand zone
6. $BE (Bloom Energy) – Data center power demand drives long-term growth story
Buy zone: $120–130 = prior base + demand zone
7. $COIN (Coinbase) – Crypto infrastructure with leverage to bull cycles
Buy zone: $130–140 = strong cyclical support
8. $AAPL (Apple Inc.) – Ecosystem moat + AI integration tailwinds building
Buy zone: $220–230 = long-term value zone
9. $TSLA (Tesla) – AI + autonomy optionality with massive upside
Buy zone: $280–300 = strong psychological support
10. $LITE (Lumentum Holdings) – AI data flow bottleneck driving explosive growth
Buy zone: $500–550 = momentum continuation base
11. $NVDA (NVIDIA) – AI leader with unmatched demand and pricing power
Buy zone: $150–160 = institutional accumulation
12. $AMD (Advanced Micro Devices) – Competing in AI chips with strong upside leverage
Buy zone: $180–190 = breakout retest zone
13. $HOOD (Robinhood Markets) – Retail trading growth + monetization expansion
Buy zone: $60–65 = demand + growth inflection
14. $SOFI (SoFi Technologies) – Fintech scaling with improving profitability trends
Buy zone: $13–15 = early-stage base
15. $QS (QuantumScape) – Solid-state battery breakthrough potential long-term
Buy zone: $5–7 = speculative accumulation
16. $MU (Micron Technology) – Memory cycle + AI demand driving pricing power
Buy zone: $310–320 = cycle bottom support
17. $SNDK (Sandisk) – Storage demand surge from AI + data growth
Buy zone: $550–600 = structural demand zone
18. $ONDS (Ondas Holdings) – Private wireless + drone tech early growth phase
Buy zone: $5–6 = high risk accumulation
19. $NKE (Nike) – Global brand reset with margin recovery potential
Buy zone: $35–40 = long-term support
20. $COHR (Coherent Corp.) – Optical infrastructure play on AI data explosion
Buy zone: $220–230 = direct LITE sympathy play
♻️RESHARE this post & write 1 comment for my list of SMALL CAPS under $20.
#Bitcoin – What’s Next?
The Big Sunday Report: All We Need to Know
🚩 TA / LCA / Psychological Breakdown: A few days ago, I gave a long at the 71k region and mentioned targets of the 79–84k region, and I am now changing something in the plan! I previously said that between 79–84k I would take profit of the long and ADD more SHORTS, this strategy has now changed and is very important to understand!
My long from the 71k region remains open, but my take profit has changed. Instead of taking profits between 79–84k, I will take HALF OF THE POSITION SIZE as profit at the 76,200 region, and this is also very important to understand! I am NOT adding short orders at 76,200, but still between 79–84k in case the market allows a move there. The other half of the long will also be closed between 79–84k if the market reaches that region. Once 76,200 is hit, I will take profit on half of the position size of the long and move the stop loss to entry to avoid any loss and secure 50% of the profit. I hope this makes sense now. You might wonder where this shift comes from, and I need to admit a small mistake in my calculation: the probability of hitting 76k is very high, but the probability of reaching 79–84k is currently medium. Because of this, I am adjusting my take profit areas. Overall, the short from 115–125k remains open, and additional short orders are placed between 79–84k in case the market reaches that zone, I am not interested to add short orders at 76k region, just if we move higher and we see higher FOMO, I would be interested to add between 79-84k, not earlier.
I am expecting a large downside move in the coming weeks, it should not take much longer, as the move is very close. I am expecting the S&P 500 to crash within the next two months, with a downside move of more than 35%. In comparison, the S&P 500 dropped 34% during the COVID black swan event. I am expecting a much larger downside move this time, with a heavy domino effect.
I am expecting a large trap for bulls as well, something market makers will use to send us lower into the 50s area and even further afterward. We have not bottomed out. The only question now is: how high will we rise before continuing downward? Will it be 76k before rejection, or will we reach the 79–84k region first? This question needs more time to be answered with clarity. While I see the probability of 76k as extremely high, I currently see 79–84k as medium probability, and therefore I am adjusting my trade accordingly. Profit is the only option and I am using every move to make a profit, no matter what my bias are!
As always, I am very transparent with you regarding my trades and decisions, and I want to personally thank you all for the support you are giving. Congratulations to everyone who took the short with me at the exact top, I will keep it open and realize it at much lower levels than where we are now.
Join DrProfit Premium now: https://t.co/Ice9n2uknI
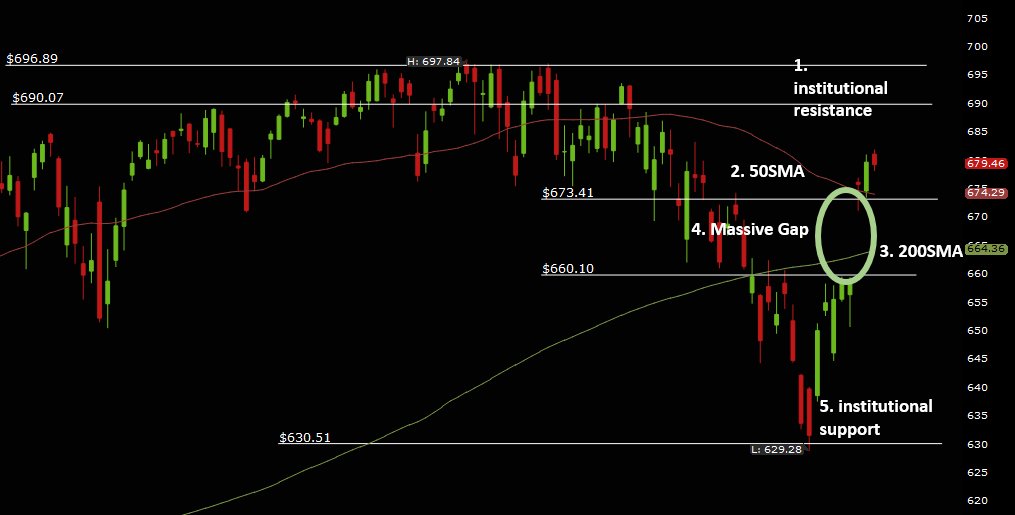
SPY: 5 critical levels that decide EVERYTHING this week.
Here’s what matters:
1. $690–697 (Institutional Resistance)
If we get escalation (military response / Hormuz stays closed), this level likely rejects hard.
Only a de-escalation headline gets us acceptance above → squeeze to new highs.
2. $675 (50SMA)
This is the battleground.
War uncertainty = chop below.
Diplomacy signals = reclaim → bulls regain control.
3. $665 (200SMA)
Last line for trend structure.
If war escalates + oil spikes → lose this = trend flips bearish fast.
Hold this = market still pricing this as temporary.
4. $660 Gap (Exhaustion vs Breakaway)
This gap tells the truth:
• Escalation → gap becomes breakaway down (continuation lower)
• Peace → gap becomes exhaustion → reversal fuel higher
5. $630 (Institutional Support)
This is where BIG money defends.
Only reached if worst-case: prolonged war + 4%+ inflation fears.
Lose this... and we’re repricing the entire macro regime.
♻️ REPOST and share 1 comment if you're interested in knowing what my SPY targets are for this week!
CPI drops at 8:30 AM tomorrow. More than half of FinTwit is positioned right now.
We studied 266 CPI releases over 22 years. Here's what the data actually says: CPI day is statistically indistinguishable from any other day.
Return difference vs non-CPI days: +0.03% (p = 0.65). Volatility difference: none (p = 0.79). All that positioning is for a day that is no different from a random Tuesday.
But here's what does matter.
The direction at the open predicts the close 72% of the time (p = 0.0007). By 10:30 AM, it's 80%. By 2:30 PM, 97%. The market prices CPI in the first hour. Everything after that is noise.
Don't fade the 8:30 reaction. If it gaps down, it closes down. If it gaps up, it closes up. The data is clear.
We also split 61 CPI days into hot prints (market sells off) and cool prints (market rallies). The paths diverge at the open and never converge. Hot CPI days drift lower all day, closing at -0.96%. Cool CPI days drift higher, closing at +0.92%. There is no intraday reversal.
The one edge that exists: after a hot CPI, 20-day forward returns are +0.88% with a 66% win rate (p = 0.034). In high-vol regimes like right now (VIX at 25.8), it's +2.00% with 69% win rate.
If the print is hot tomorrow and the market sells off the data says buy it for a 20-day hold.
Three rules for tomorrow:
Before 9:30 — wait for the print
9:30 to 10:00 — direction is set
After 10:30 — nothing happens
$SPX $SPY $QQQ #CPI #Inflation
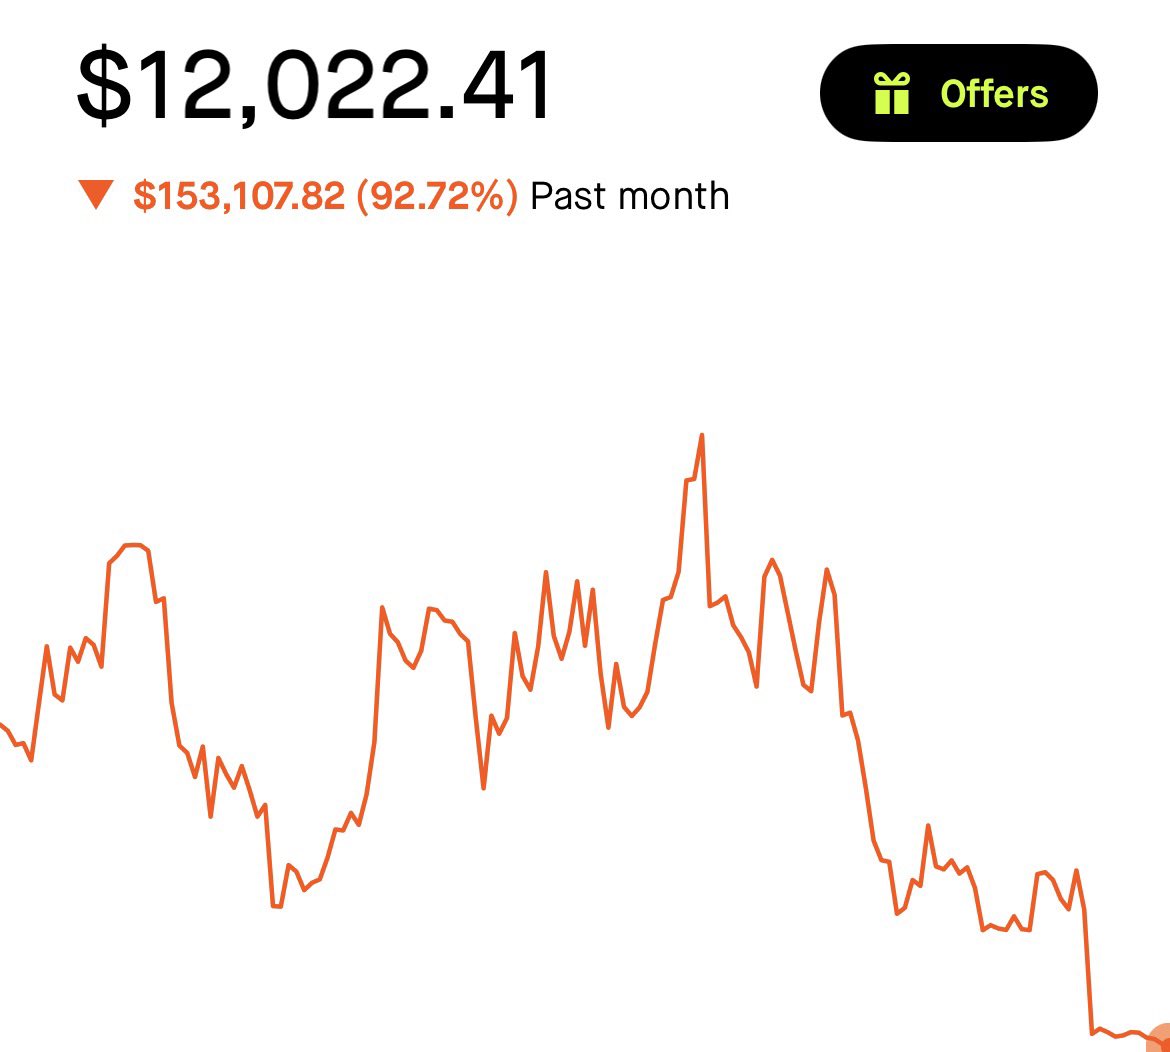
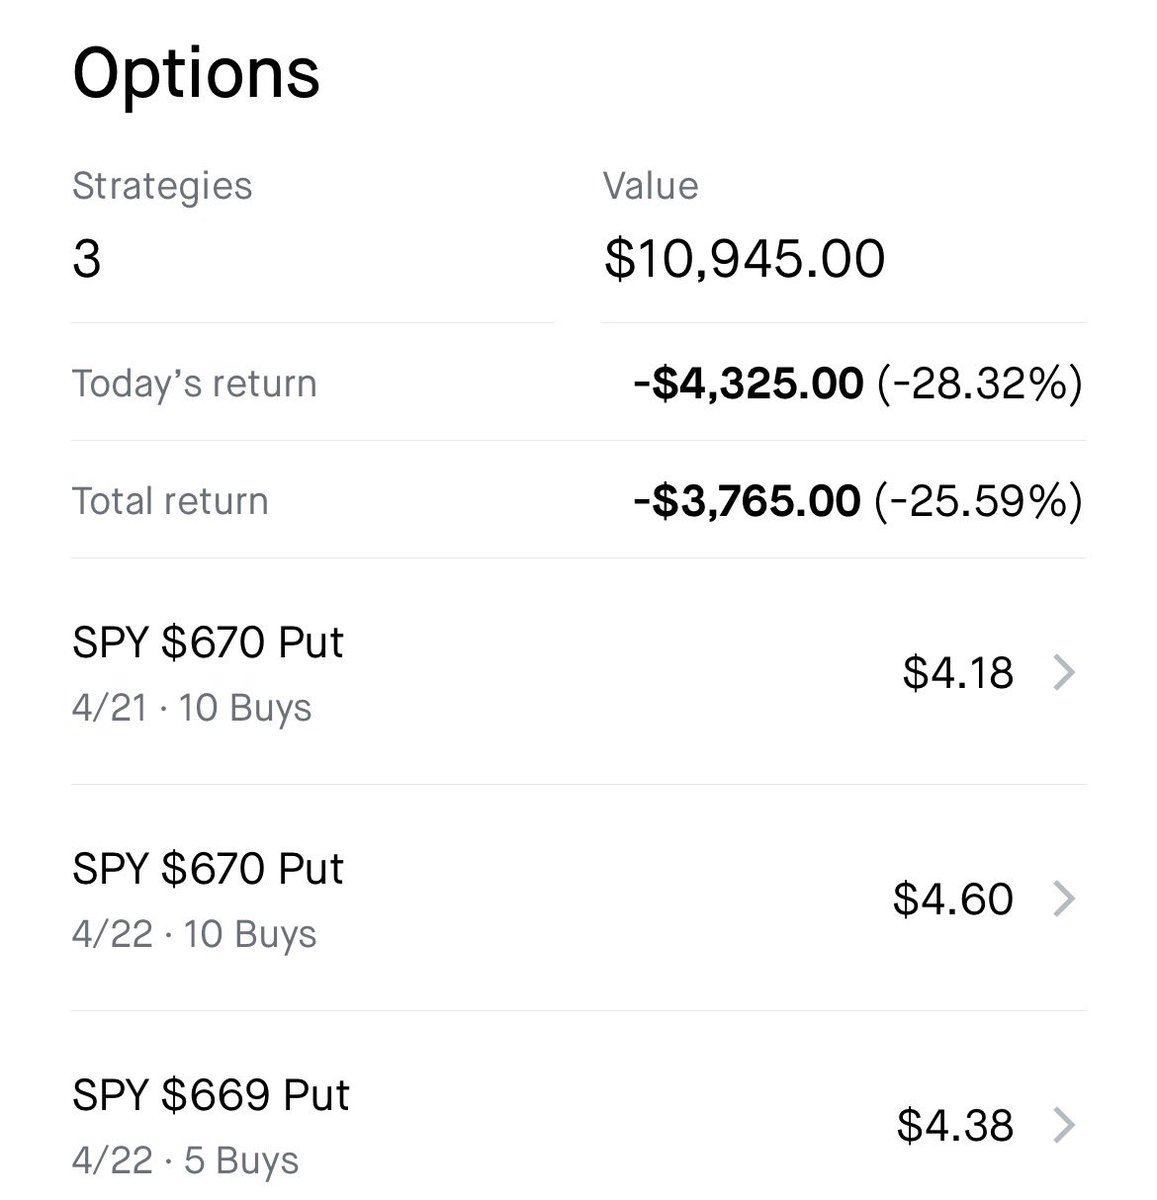
Hey everyone, I have been in mental breakdown past two days and finally to calm myself down. I never cried too hard in my life.
Many of you knew me as the guy who turned $300 into $200,000–$300,000 in just a few months trading $SPY.
Lately there’s been a lot of positive and negative noise around me, but today hit the hardest. My biggest mistake was pure ignorance and sizing way too big despite solid advice from experienced traders here. I ignored it at times, and today I paid the full price for it.
To be honest, I’m left with $10,000. It’s only April, with 8 months left in 2026. I’m determined to build it back up.
This lesson will stay with me forever. To all the traders out there: please use my story as a warning. Don’t be like me, control your emotions and your size.
And I will continue to post about $SPY and others, I deeply appreciate every single one of you on here.🙇♂️