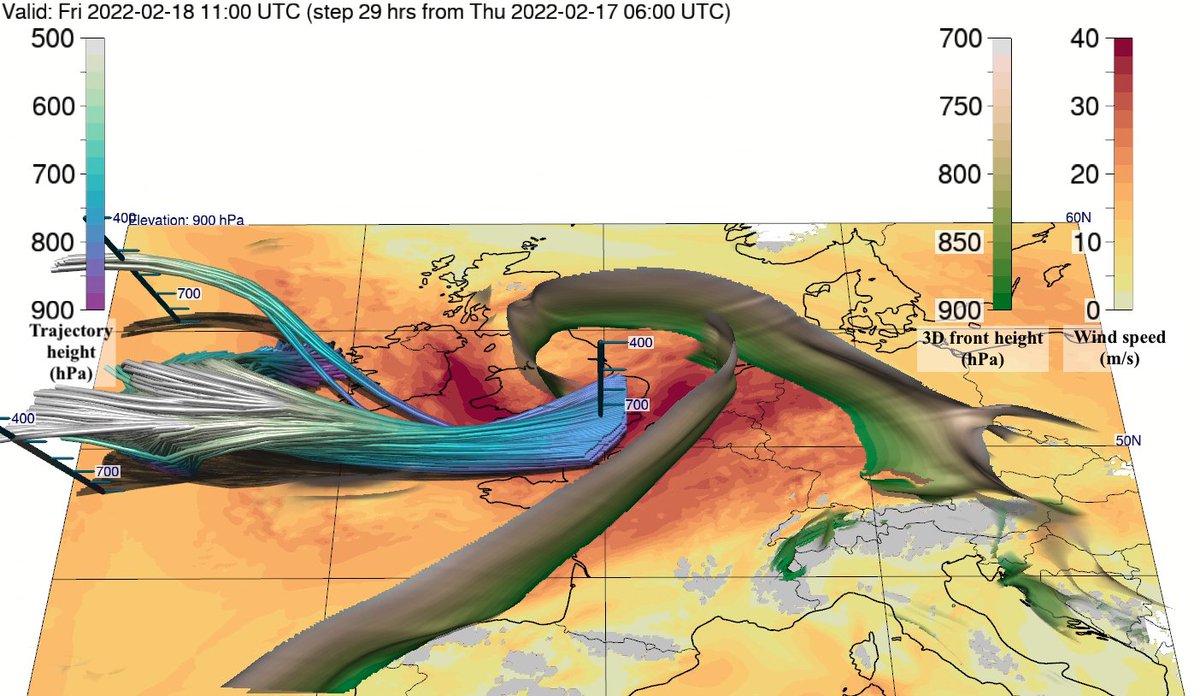
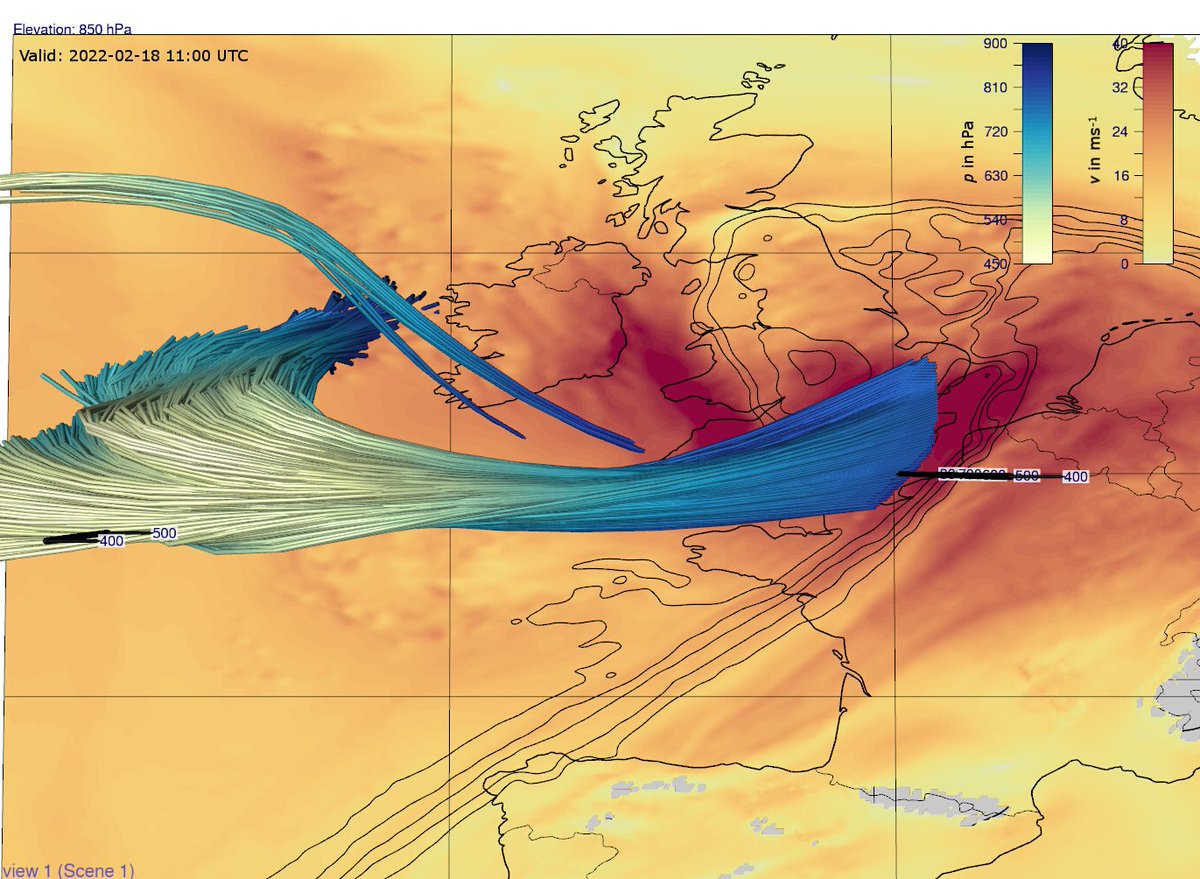
ICON simulations show plenty trajectories descending to the boundary layer for several hours confirming a #stingjet during #StormEunice/#Zeynep. Here is an example for 11 UTC using @Met_3D. However, if and where it reached the surface isn’t certain.
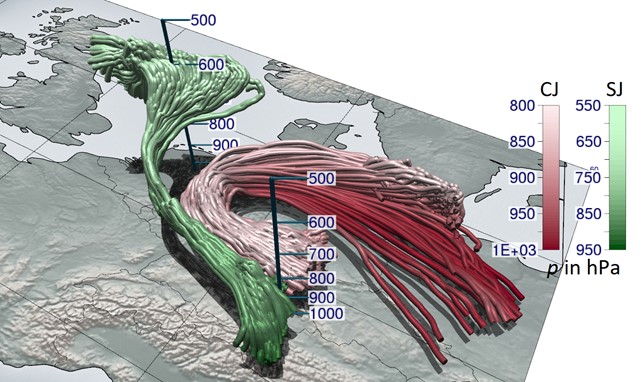
I submitted my first paper with colleagues from @WavesToWeather & @Met_3D a few weeks ago in @EGU_GMD! Interested in learning upsides of a 3D perspective in the world of PV? It is in public discussion right now: https://t.co/vTEPkcu4E7
Example of flow visualization: a @Met_3D animation illustrating atmospheric transport of rust pathogens is shown in a presentation within this @metoffice#COP26SciencePavilion session from 06 Nov 2021 (at 59:09 min): https://t.co/zxLqwCgNsk
This @esa news article provides more information about the @DLR_en#JATAC AVATART @esa_aeolus validation campaign, during which @Met_3D was used (see bottom of article): https://t.co/RfM84lANSS
We will showcase tools developed in @WavesToWeather at a hands-on workshop on 4 September 2022 (on Sunday before the Annual Meeting of @EuropeanMetSoc).
#DataAssimilation#ProbabilisticForecasts@Met_3D and more!
Stay tuned for updates: https://t.co/OA7lWHyTok
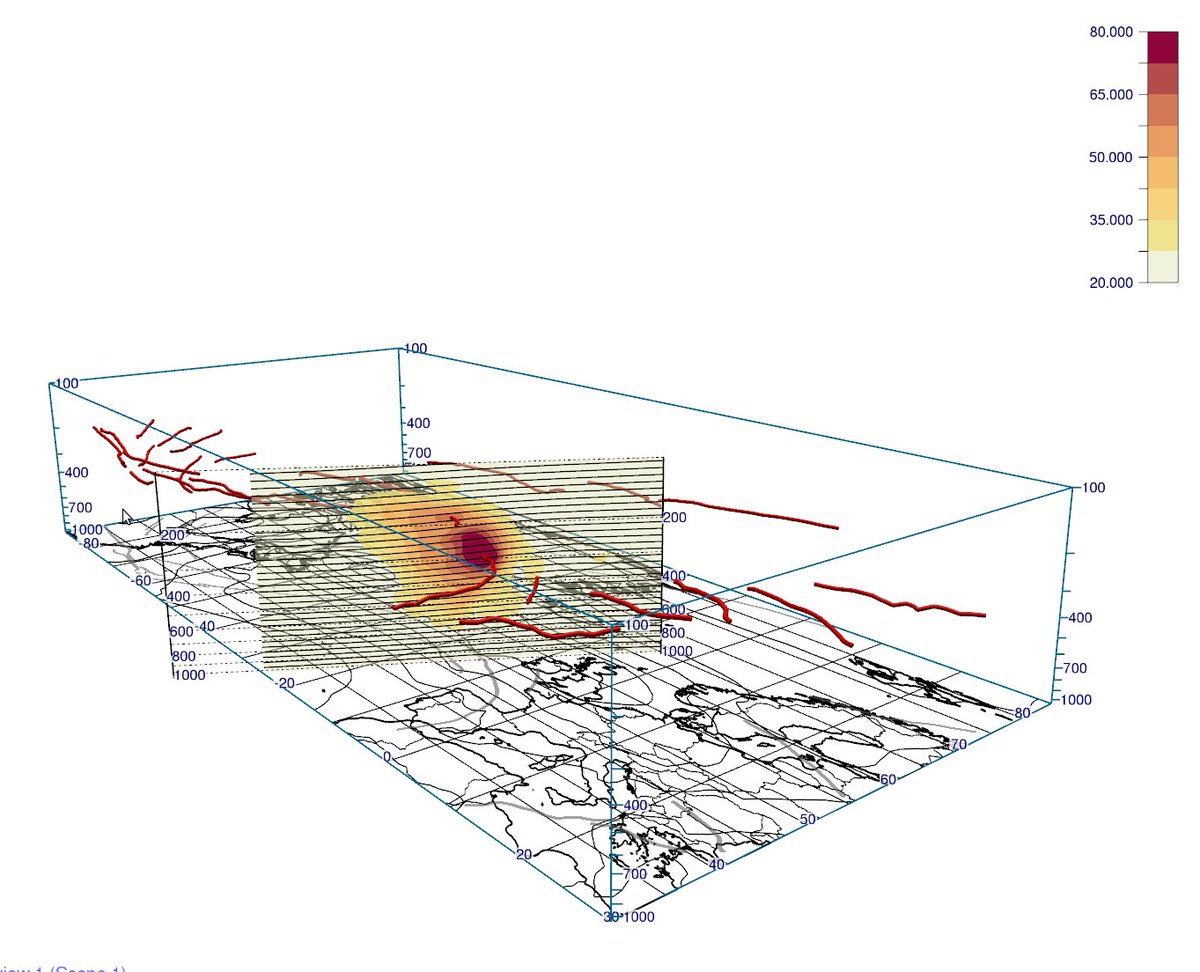
When and where will a polar low occur? A new method for interactive 3-D visual data analysis reveals insights that improve distinguishing the times and locations of polar lows. See new #CLICCS paper by Marcel Meyer et al. https://t.co/qOhmY9e23O
Vorhergesagte Windgeschwindigkeit am 17.09.21 um 20 MESZ über den Kapverdischen Inseln: Die DLR Falcon fliegt unter der #Satellitenspur von #Aeolus und misst einen Teilabschnitt. Sie überfliegt dabei die Bodenstation in #Mindelo (markiert durch die dunkelblaue vertikale Linie)...
Marc Rautenhaus @unihh shows how really cool visualisations of @ECMWF ensemble forecasts with Met3D were used for flight planning in #NAWDEX@DLR_en. Especially liked this brilliant spaghetti plot (good example of #sciart@ArnalLouise ?) #ObsCampaignWS
New research article: Interactive 3-D visual analysis of ERA5 data: improving diagnostic indices for marine cold air outbreaks and polar lows https://t.co/PS6wWbqzis
Met.3D is an open-source research #visualization framework targeted at interactive, three-dimensional visualization of gridded #atmospheric datasets and visualization research. More information is available at https://t.co/3gUNcPhu7v