webr (r-wasm) is so powerful!
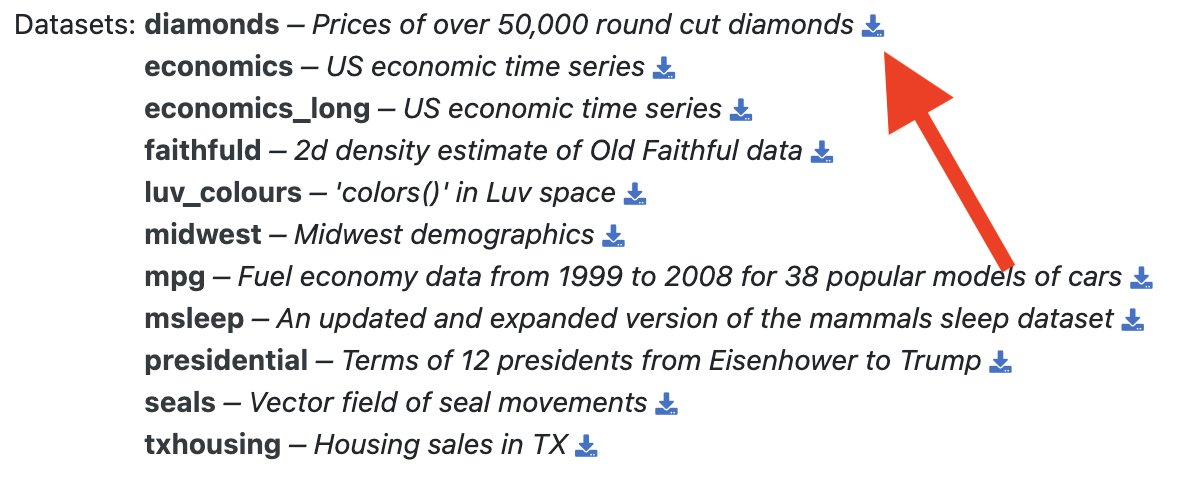
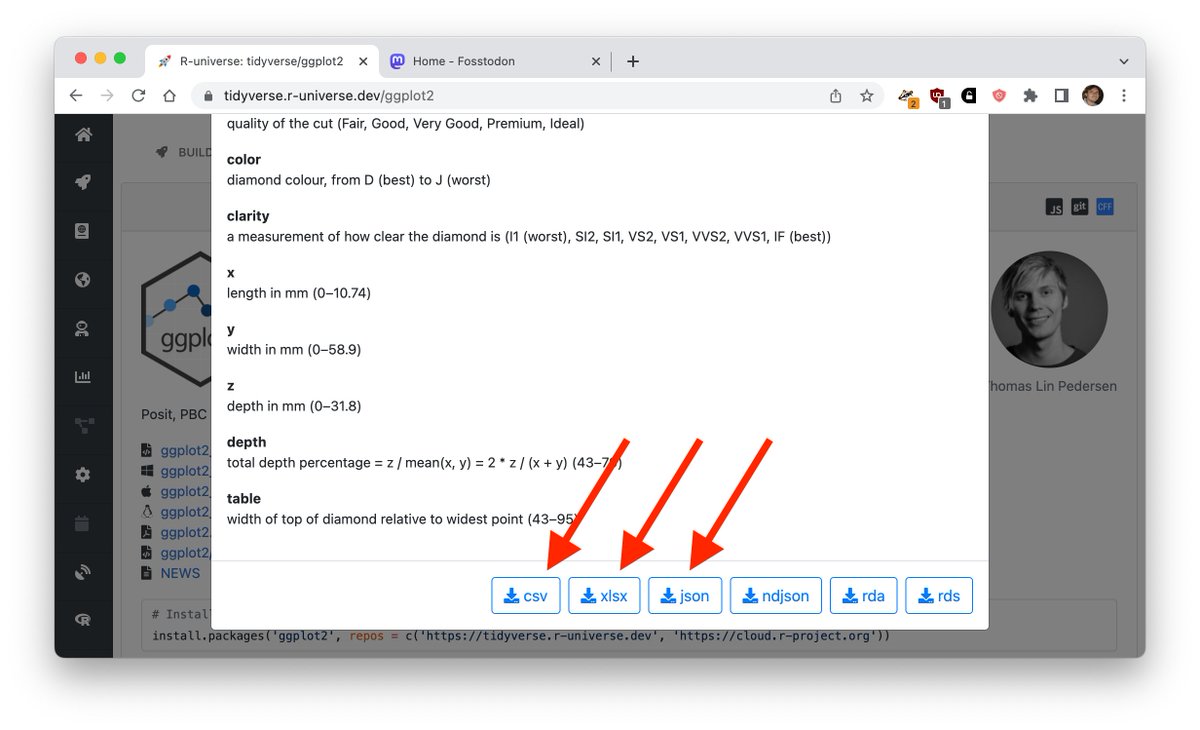
The r-universe node stack now provides data export links, which use webr to convert pkg datasets on-the-fly to json (via jsonlite) xlsx (via writexl), csv (via data.table), etc. Try it yourself eg: https://t.co/7evUkZN35e
#rstats
Quick tip: How to create a boxplot that has the same border colour as the fill colour, only darker.
Get the cheat sheet for free here: https://t.co/v5kxDWIRN8
#rstats#tidyverse
Breaking a talk into episodes is not only great for the audience, but it can also make talk prep feel less overwhelming. You can work on different episodes, depending on which type of mental energy you are able to summon that day.
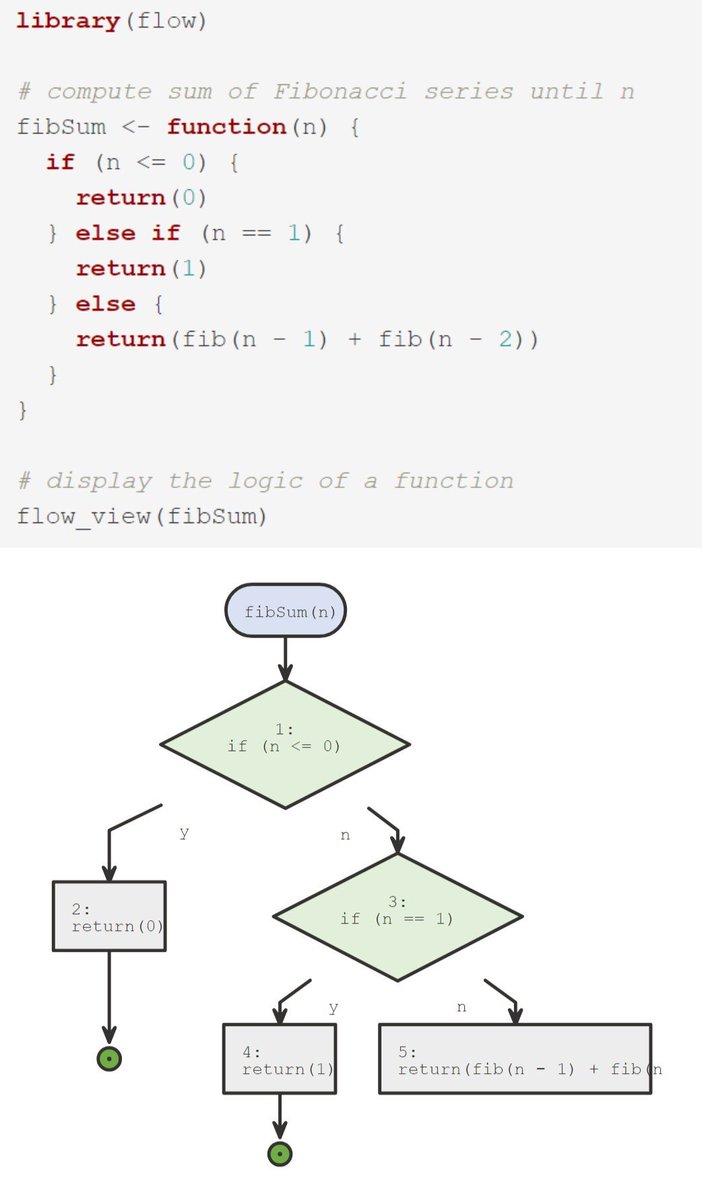
Either while debugging or learning a new function, you may wish to understand its implementation logic.
The {flow_view} function from {flow} 📦 helps visualizes this logic via a flow diagram! 🔷🔶
https://t.co/f5ubm3fq7T
#rstats#DataScience
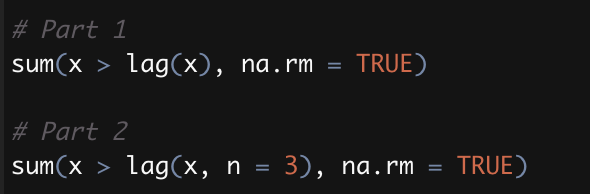
My #rstats solutions to Day 1 of #AdventOfCode
* lag() and lead() from dplyr are so useful!
* Part 2 uses a handy trick: sliding windows of length 3 will have the middle values in common, so you can just compare the values that enter/exit the window
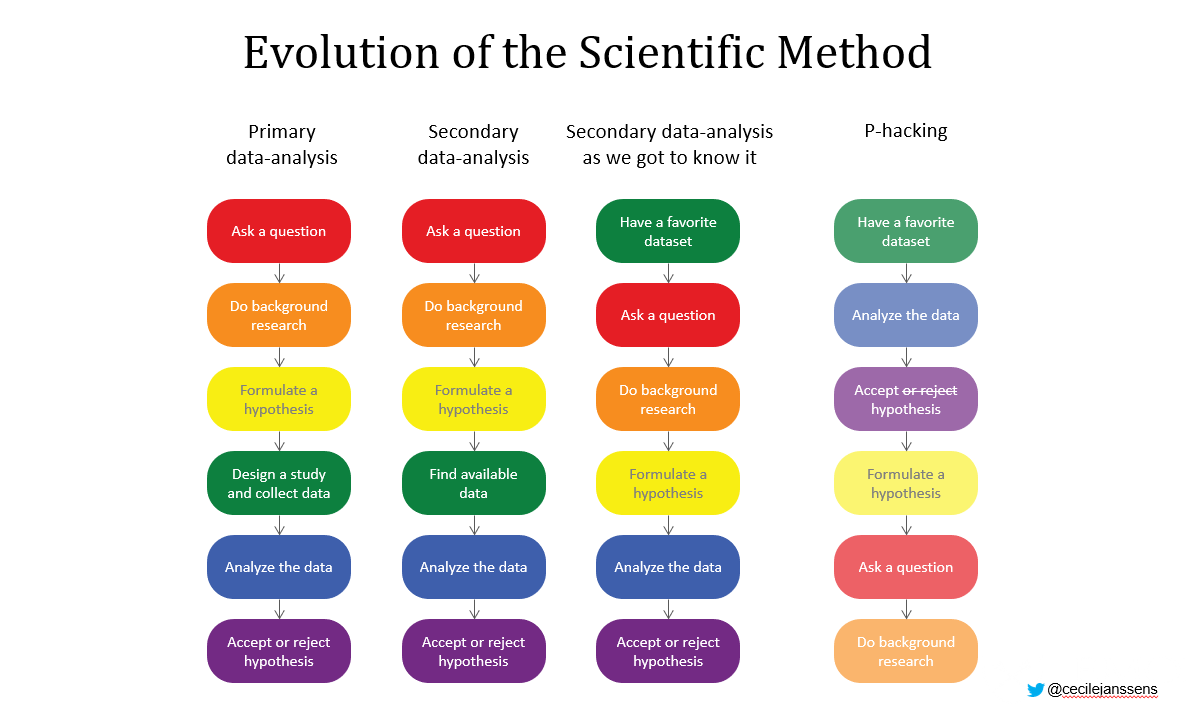
I'm writing a book about the science behind the news. It's about how scientists do science, and how their studies aren't always what you think they are. How, often in good faith, scientists take shortcuts that invalidate their findings, and how you too can spot these.
#Statistics thought of the day: Witnessing the continued hype of #AI by academic medicine and industry makes me think that we should spend more time on #RHI (Real Human Intelligence). @vandy_biostat @VUDataScience#StatThink@MaartenvSmeden