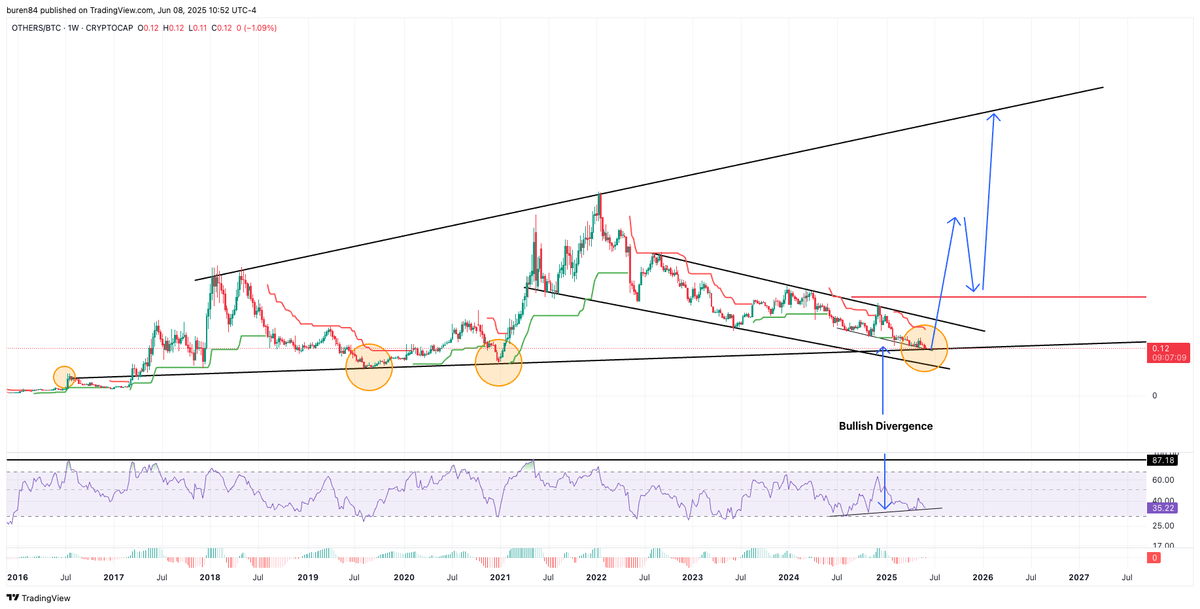
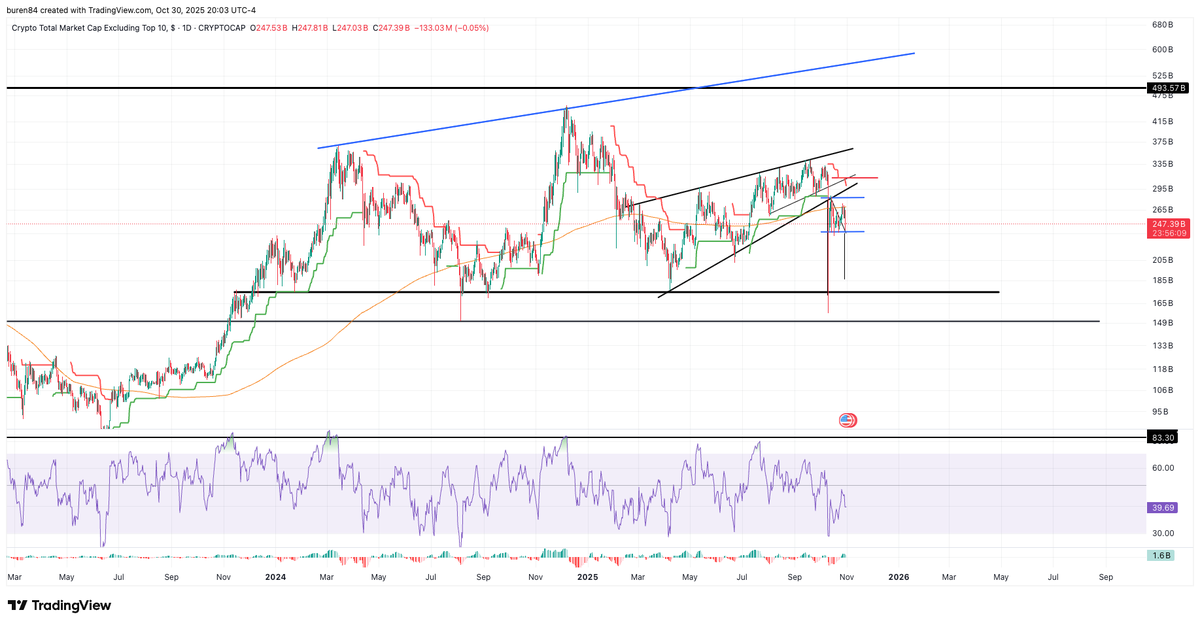
The one TA chart I have not seen yet on X so Im going to post mine in advance just to claim bragging rights. The bottom trend line dating back to 2016 has reacted positively with price EVERY TIME, kicking off Alt seasons. Given the Bullish Diverg on the weekly Id say its time🚀
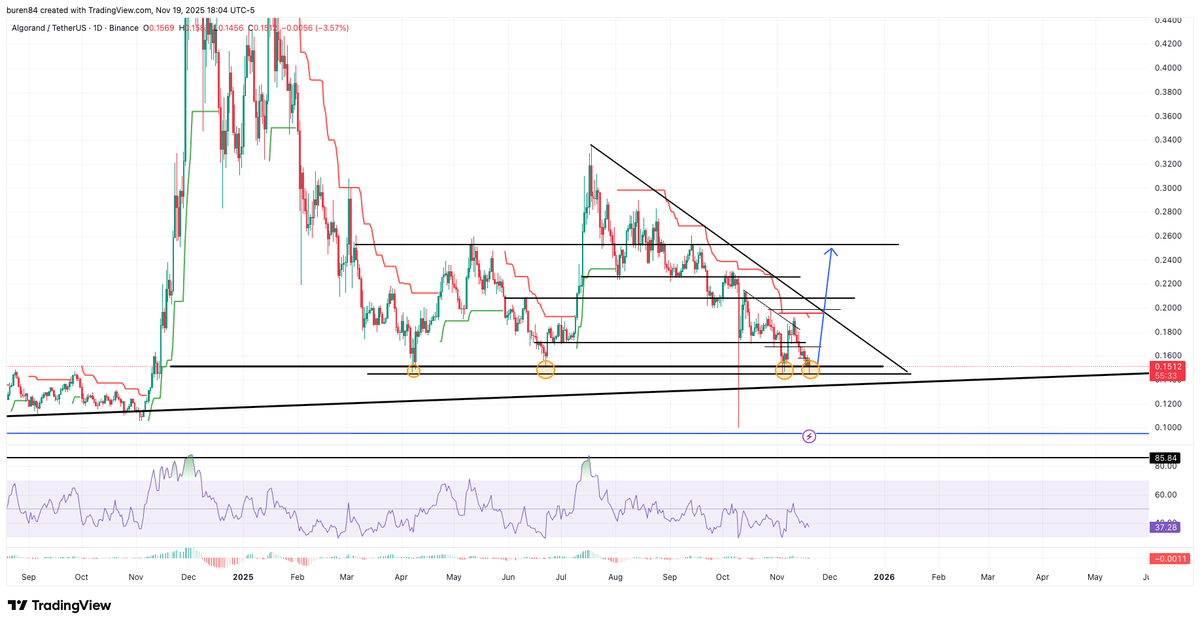
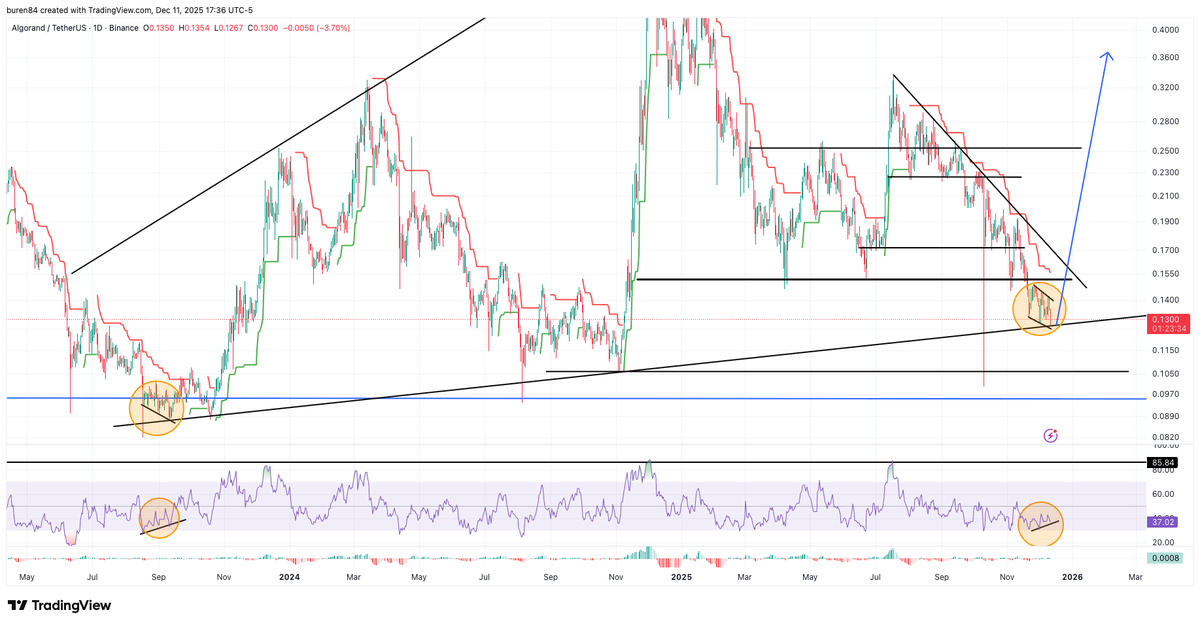
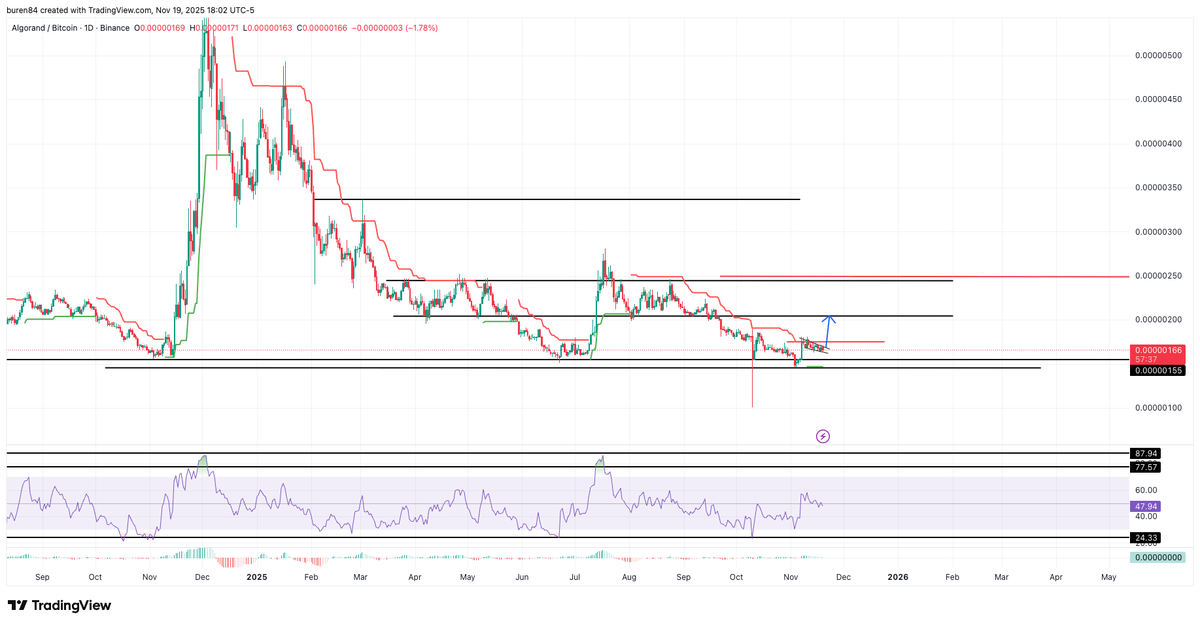
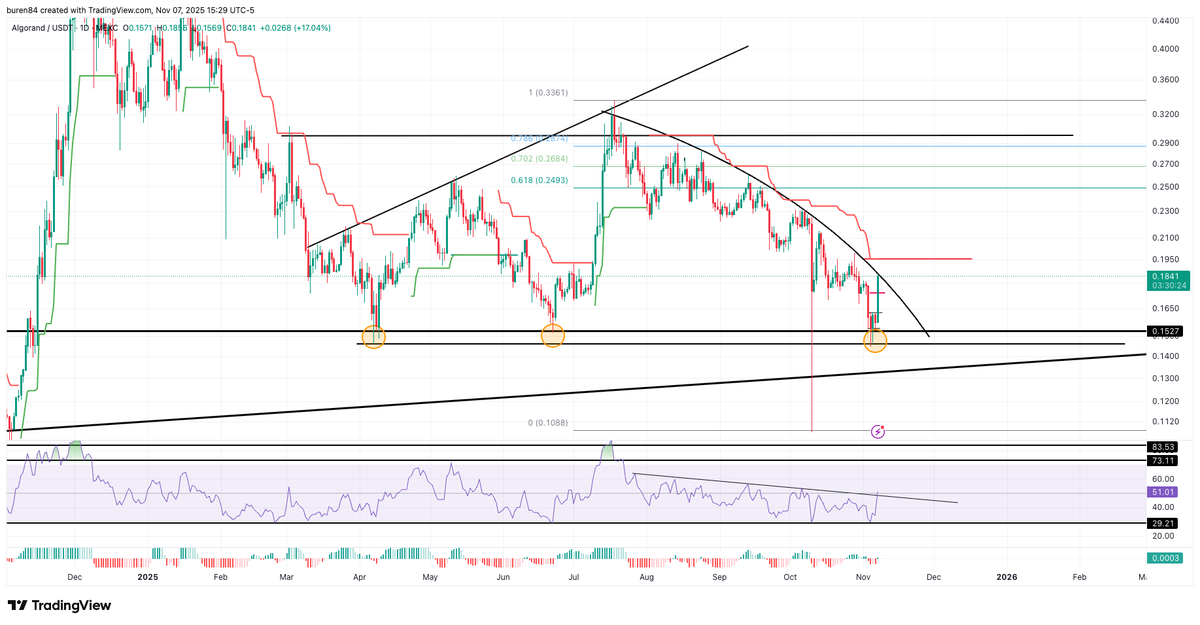
Algo went a little bit lower to the major support which is great for a 5 point touch pattern. After the 5th touch comes the quickest price movement (as shown in my BTC top megaphone post).
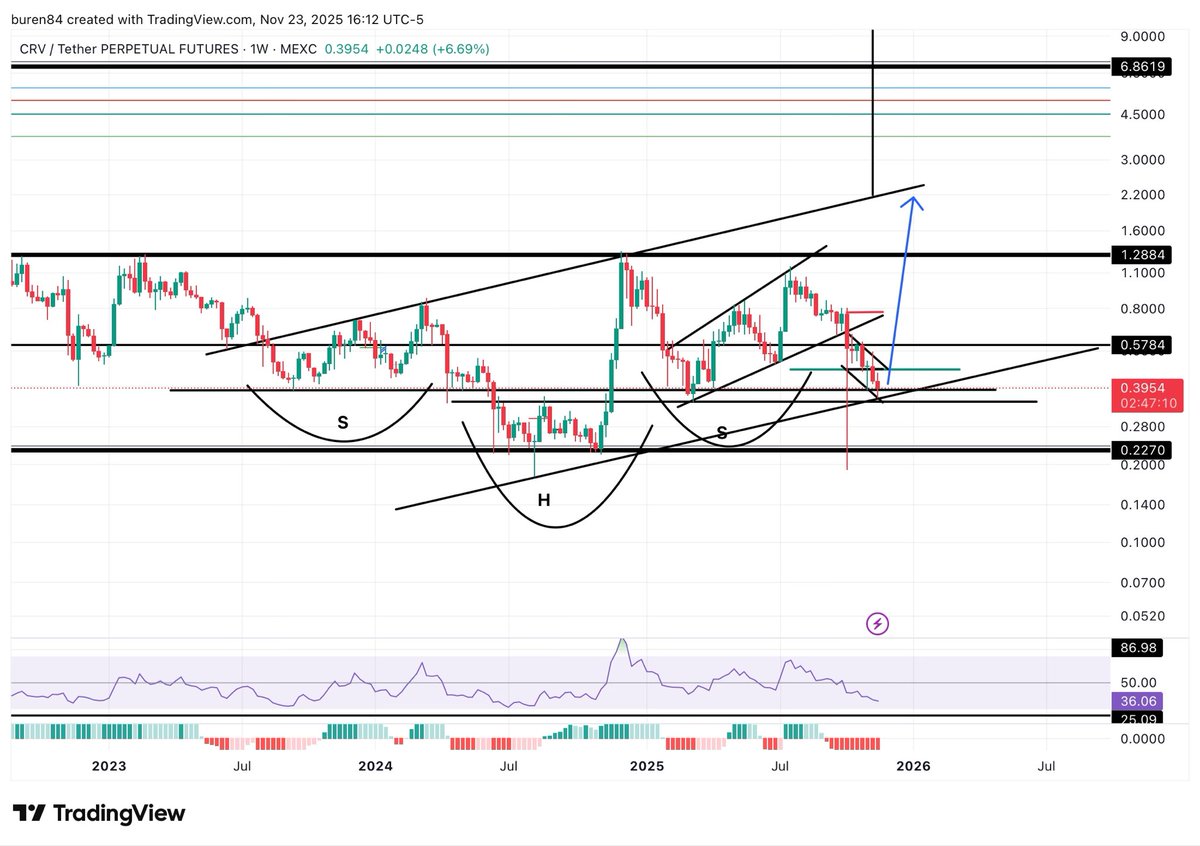
CRV head and shoulders still intact as long as price doesn’t close below the right shoulder. Price is also finding major support as a parallel channel.
Algo went a little bit lower to the major support which is great for a 5 point touch pattern. After the 5th touch comes the quickest price movement (as shown in my BTC top megaphone post).
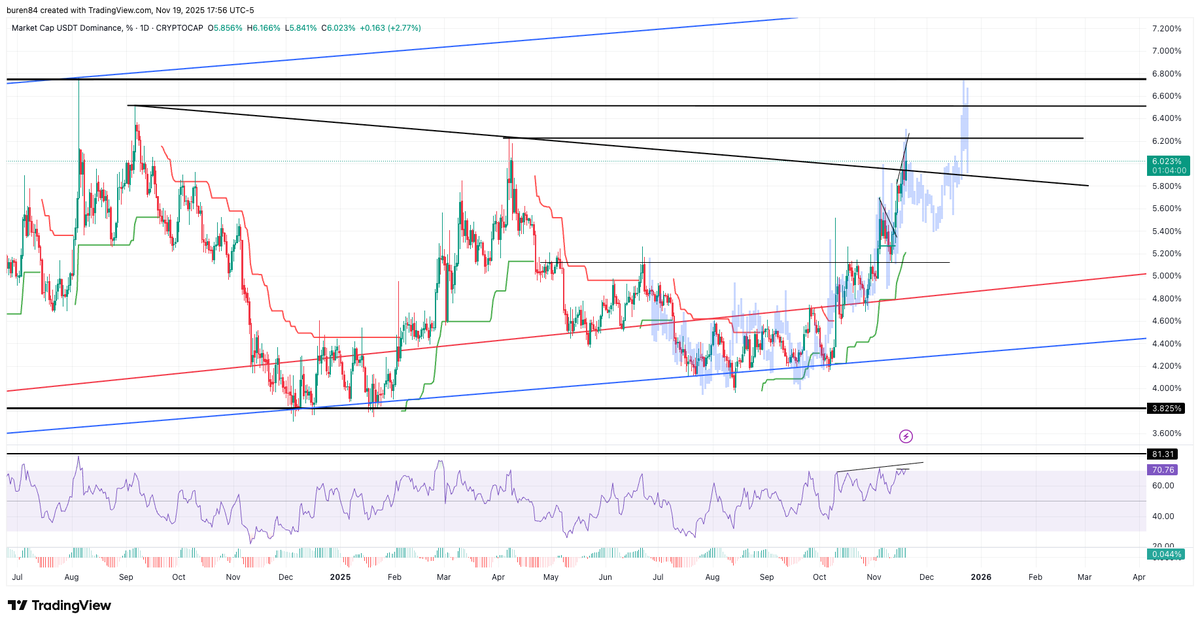
I am watching the USDT Dominance. You can see here it has been in a bottom forming distribution as it has before and has broken out, which means USDT would typically continue to break out as crypto would fall making the case for the BTC megaphone pattern to continue down as said
I didn’t buy ETH on the breakout because of the limited upside gains vs other alts but I did notice it and watch it happen. I find it interesting that a downward parabolic trend is just as accurate as any other trend line. Note the break out as well as the breakout of the RSI.
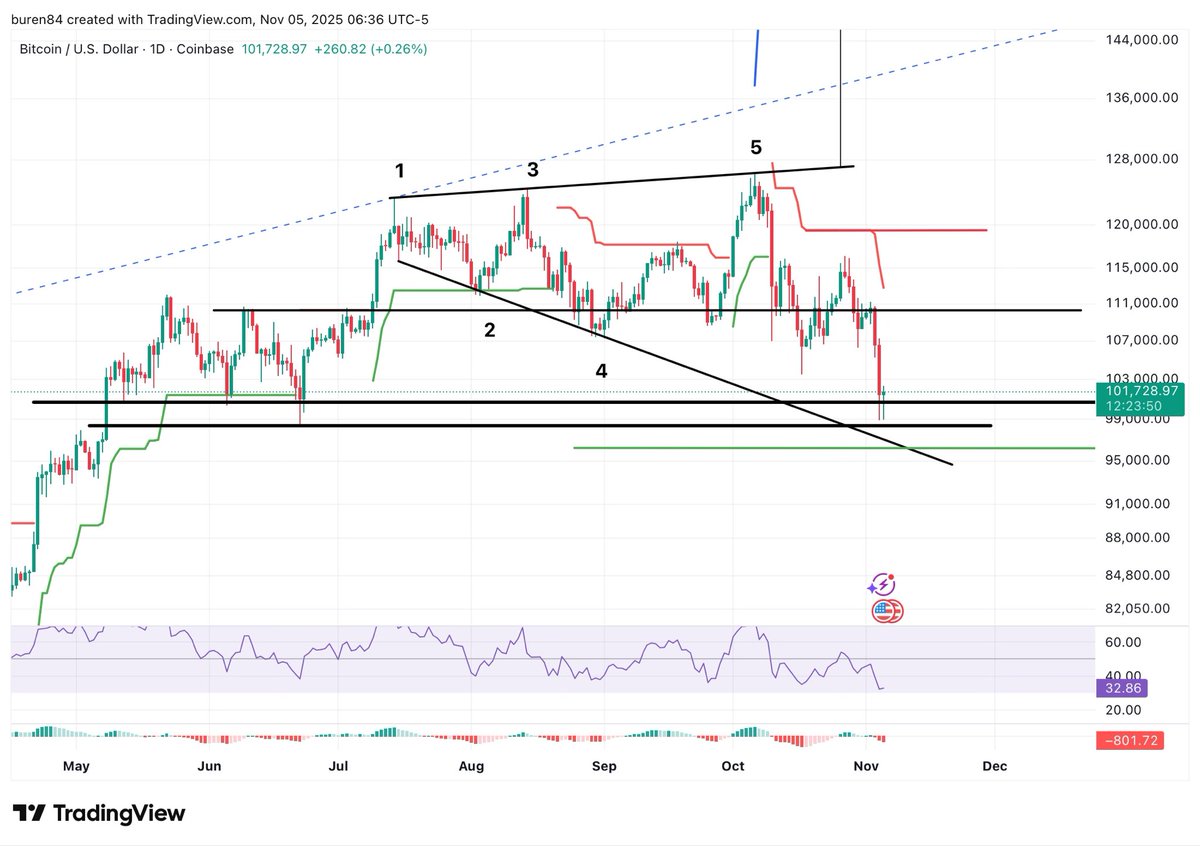
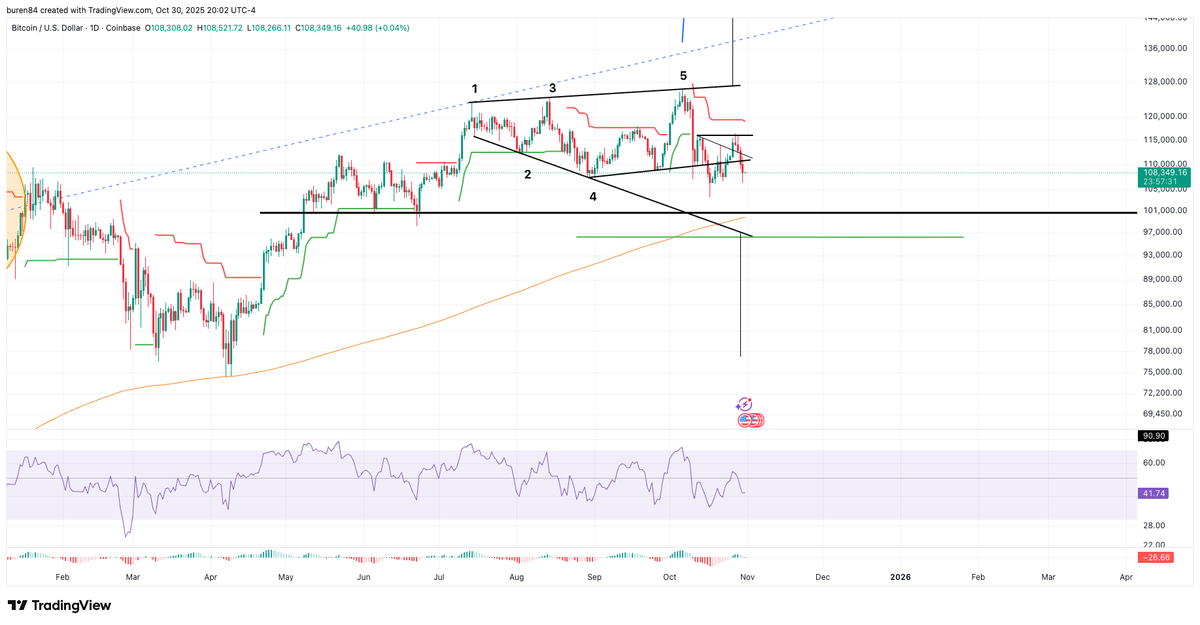
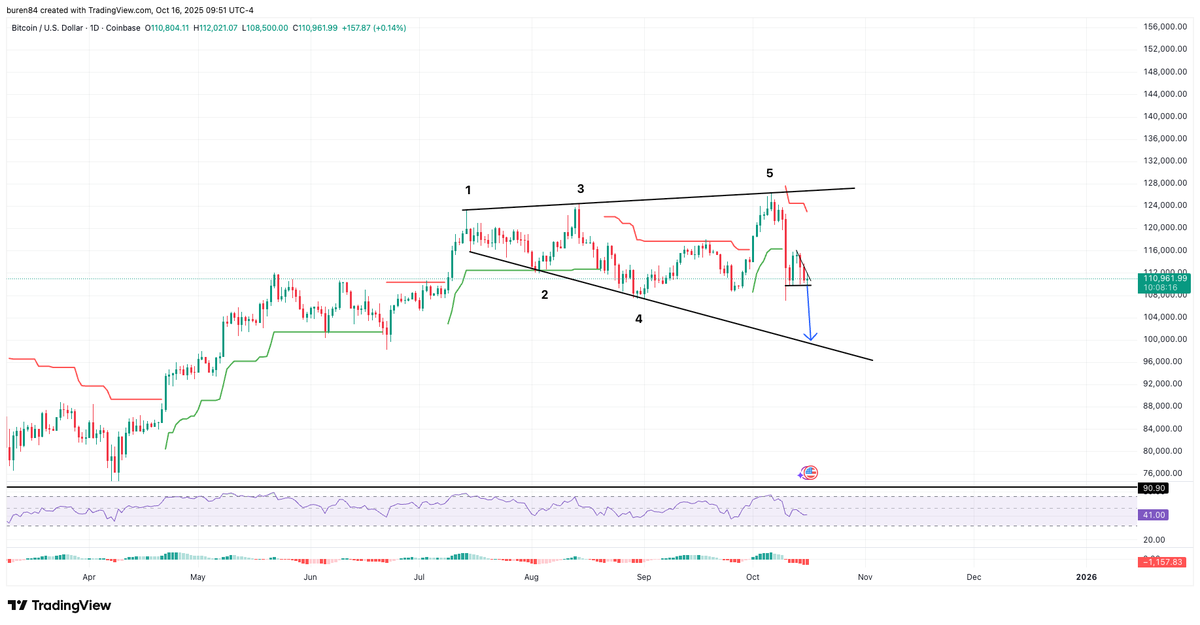
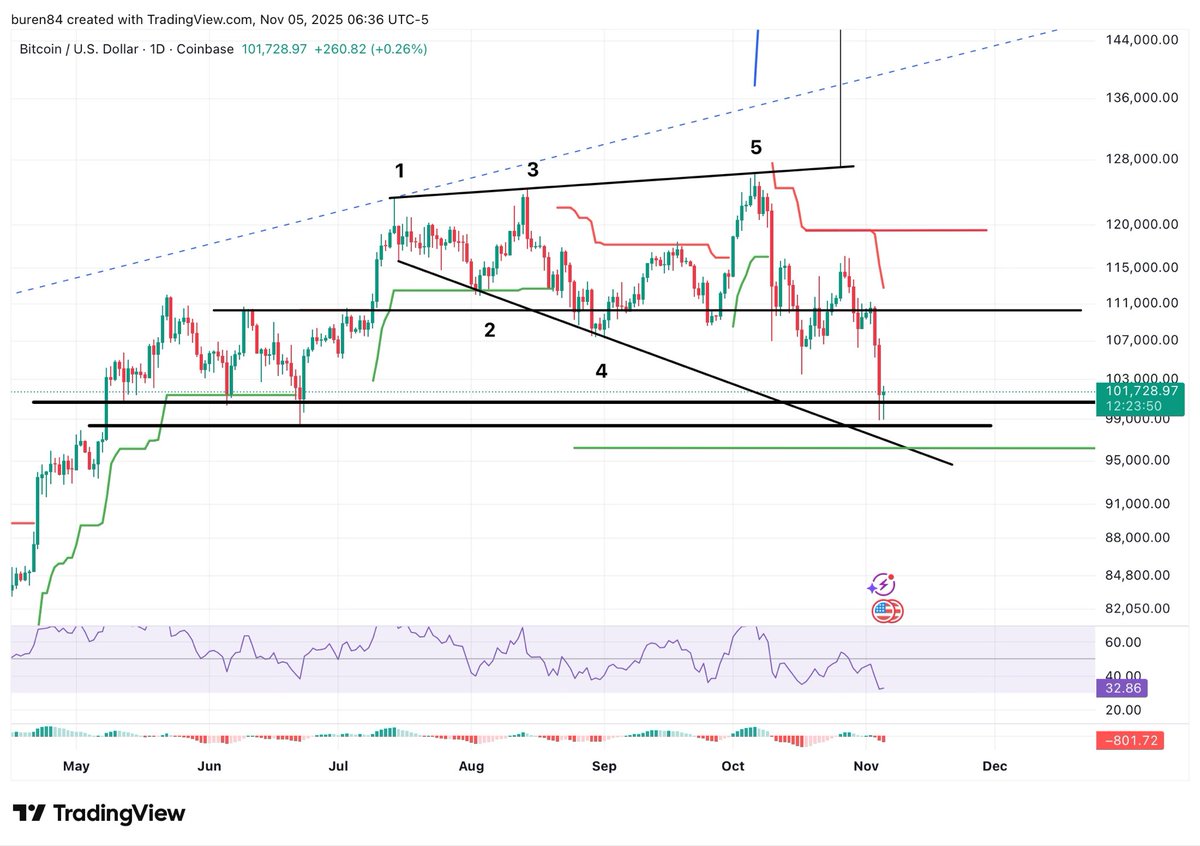
5 point megaphone update on BTC, currently heading for its 5th touch as predicted, which in this kind of pattern is the final touch and then price rolls over, but that’s TBD.
With the RSI daily breaking out of a down trend, MACD flipping green and the price continuing to press higher, this week could give us a nice long overdue little breakout on Alts.