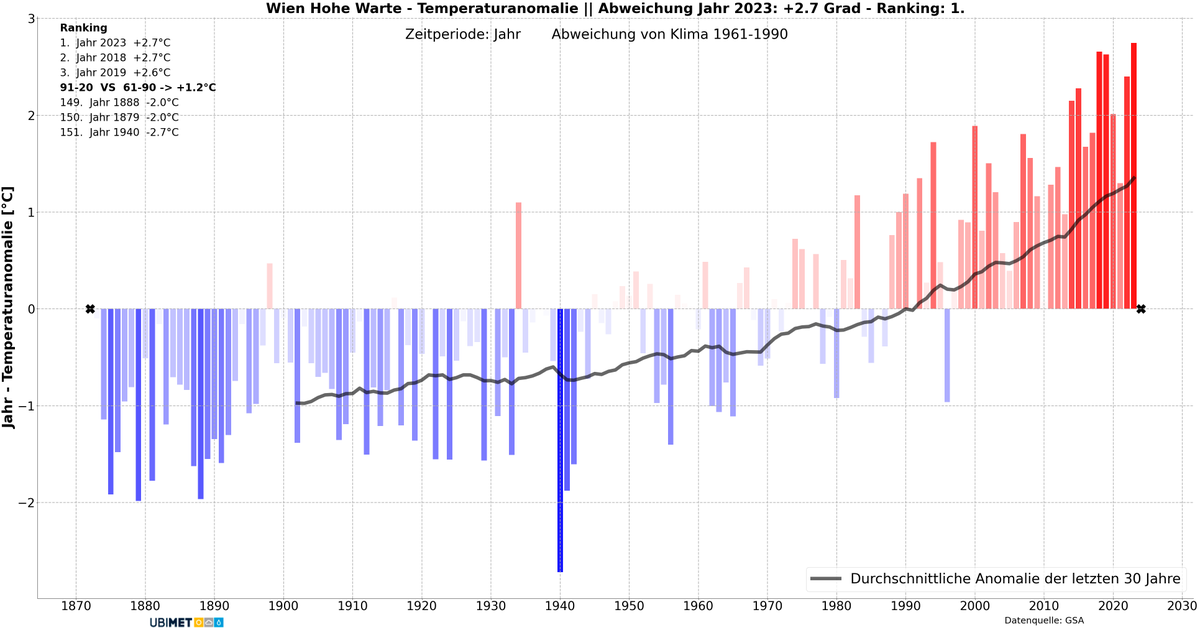
@half_tree@WxNB_@GeoSphere_AT Again: it was a completely different location. And you can't tell "it was hot" from those data (did you take the absolute yearly maximum now? this makes even less sense). Take only the final location from 1872 and a (much) better climate parameter (like daily avg temp) and...
@half_tree@WxNB_@GeoSphere_AT You don't use one day for climate trends. Plus: station has been moved on the opposite site of the city in May 1872. Previous data are from a (back then) developing industrial neighborhood in the lowlands which is the opposite of the current position (hilly, residential, green)
The problem is what is coming next. Models agree on 50-100 mm during the next 24h in the #Imola region, but with peaks > 100 mm in the Apennines, where the Santerno river comes from. A flood exceeding level 3 is in sight, with lower areas of the @autodromoimola at risk as well.
The Santerno river runs next to the Pit Lane of the @autodromoimola and @ArpaER has a sensor right at the entrance of the Autodromo. The river has already reached the 2nd alert level (orange, max. is 3) and this flood already looks much worse compared to the one from 2 weeks ago.
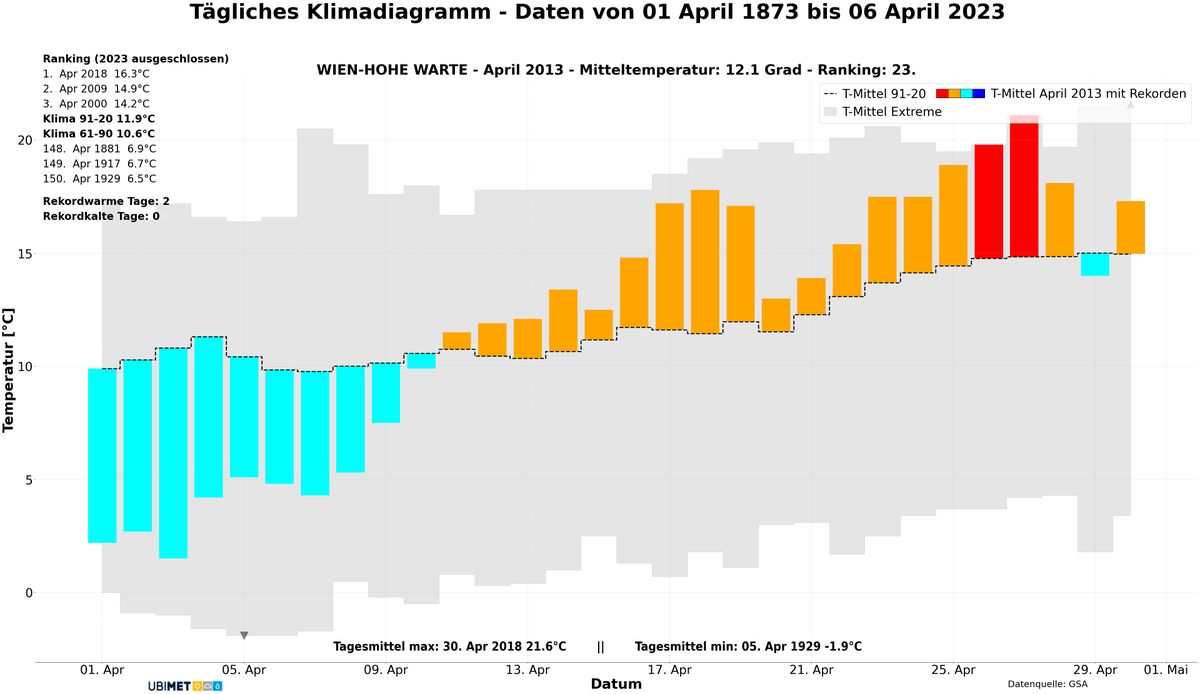
Spannende Auswertung des geschätzten Kollegen @michele_salmi. Ab sofort werden wir hier öfters Klimadiagramme für div. Stationen posten. Ein Beispiel von 2022 für die Schmittenhöhe bei Zell am See. Bis dato mit einer Mitteltemperatur von +5,4 Grad Platz 2 aller Jahre. 🧵 1/n
More than 400 mm in less than 12 hours have been recorded in the town of Cantiano in the central Apennines (almost half of the yearly precipitation average for the region), with rivers downstream causing severe floodings. A max rain rate of 39 mm in 15 min has also been observed.
Severe, V-shaped backbuilding #thunderstorm with cloud tops reaching -70°C caused a major #flashflood event, several victims and damages in central #Italy (#Marche) on September 15th || Satellite data from Eumetsat
@wienerlinien Aso, ist es nicht offensichtlich? 😅 Soll das Portal einfach so aussehen, wie auf einem Testbed eines Software Entwicklers? Mein persönliches Problem: Die Seite ist leider unbenutzbar, ich kann momentan die Jahreskarte auf dem Shop nicht verlängern.🙂
@MarcelHerber2@nikzimmer87 Nein, alle die Jahren in der Grafik werden nur mit sechs Monaten behandelt ;) und anscheinend ist die Temperaturanomalie tatsächlich die 2m Temp für Landesinneren, ohne Mittelmeer! Impressive!
Das Wetter präsentiert sich frühsommerlich, selbst die 30 Grad-Marke ist in Reichweite. Doch wann werden die ersten 🔥Hitzetage🔥 im Schnitt erreicht? Ist das im Mai schon üblich? ⬇️
https://t.co/dK7JcJN4eU
@bergbua@manu_bx@UBIMET Ich muss sagen ich war selbst überrascht, aber es gibt mehrere Stationen, die eine Differenz von mehr als 20 Tagen aufweisen. Die Änderung ist rasant schnell, vor allem in den breiteren inneralpinen Tälern! Bei den ersten 25er ist die Tendenz nicht so auffällig.
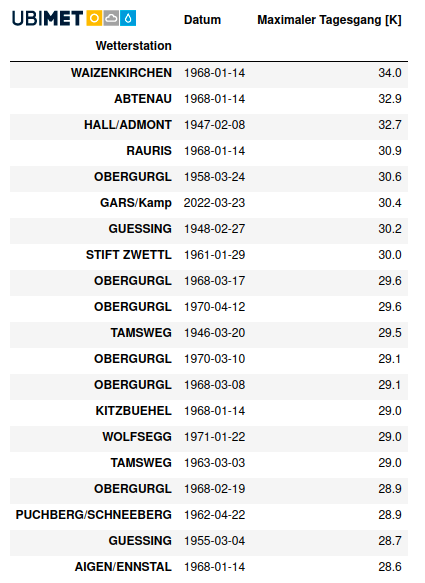
@wetterblogAT@nikzimmer87 @yousitonmyspot Der 13.03.68 riecht tatsächlich nach Fehler, aber dann tauchen viele andere März-Tage mit großem Tagesgang in Obergurgl.. der 24.03.58 sieht plausibel aus von der Synoptik her (Südföhn nach Kaltlufteinbruch). Übrigens: Ich hab nun die Hitliste unabhängig von der Station erstellt.