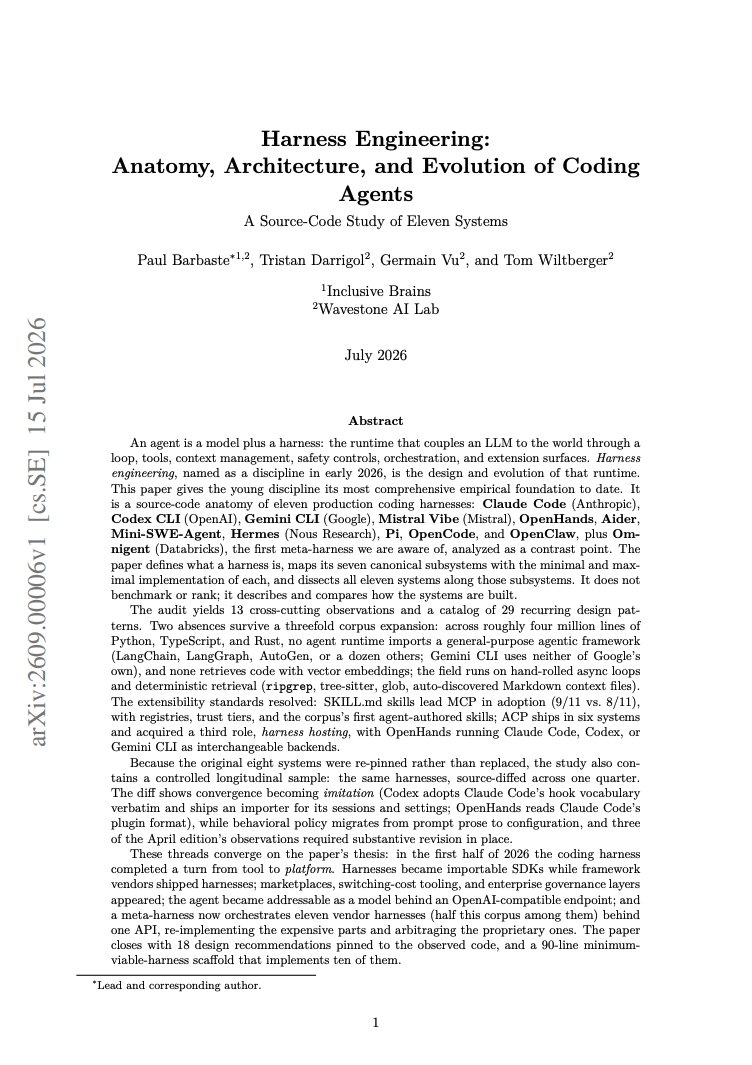
this might be the most useful AI agent paper of 2026, and it's certified f*cking gold
Wavestone AI Lab took apart Claude Code, Codex and 9 more agents
every good one runs on the same 7-part harness
agent = model + harness
all 11 use the same 7 parts. only the size changes
the 7 parts:
> loop - from a plain while loop to fully replayable runs
> LLM layer - one prompt template up to 29 provider profiles
> tools - bash only up to 43 typed tools on demand
> memory - full history up to notes kept across sessions
> safety - a step limit up to rules + reviewer model + sandbox
> orchestration - Aider skips sub-agents, others fork them
> extensions - SKILL.md in 9 of 11, MCP in 8
it ends with a 90-line harness covering all 7
the cleanest starting point for your own agent
the pages worth your time:
> p.4 - the 7-part map
> p.12 - 3 loop types, Claude Code and Codex as examples
> p.53 - why nobody uses frameworks or embeddings
> p.67 - 18 design rules
> p.71 - the 90-line harness to copy
les dejo uno de los mejores papers que leí sobre Harness Engineering.
explica muy bien:
1) qué es un harness
2) cómo están construidos los coding agents actuales
3) qué patrones se repiten entre Claude Code, Codex, Gemini CLI, etc.
4) hacia dónde está evolucionando la categoría
5) qué recomiendan si querés construir uno
todo parte de una definición simple:
Agent = Model + Harness
como complemento, también pueden leer el artículo que escribí sobre el tema.
paper:
https://t.co/xTvb7MvzQG
🔴Encontrar TRABAJO ahora es FACILISIMO
Más de 3.000.000 de puestos en un mapa.
Filtras por el cargo que quieras.
Sin registros ni nada.
Te dejo el enlace abajo 👇
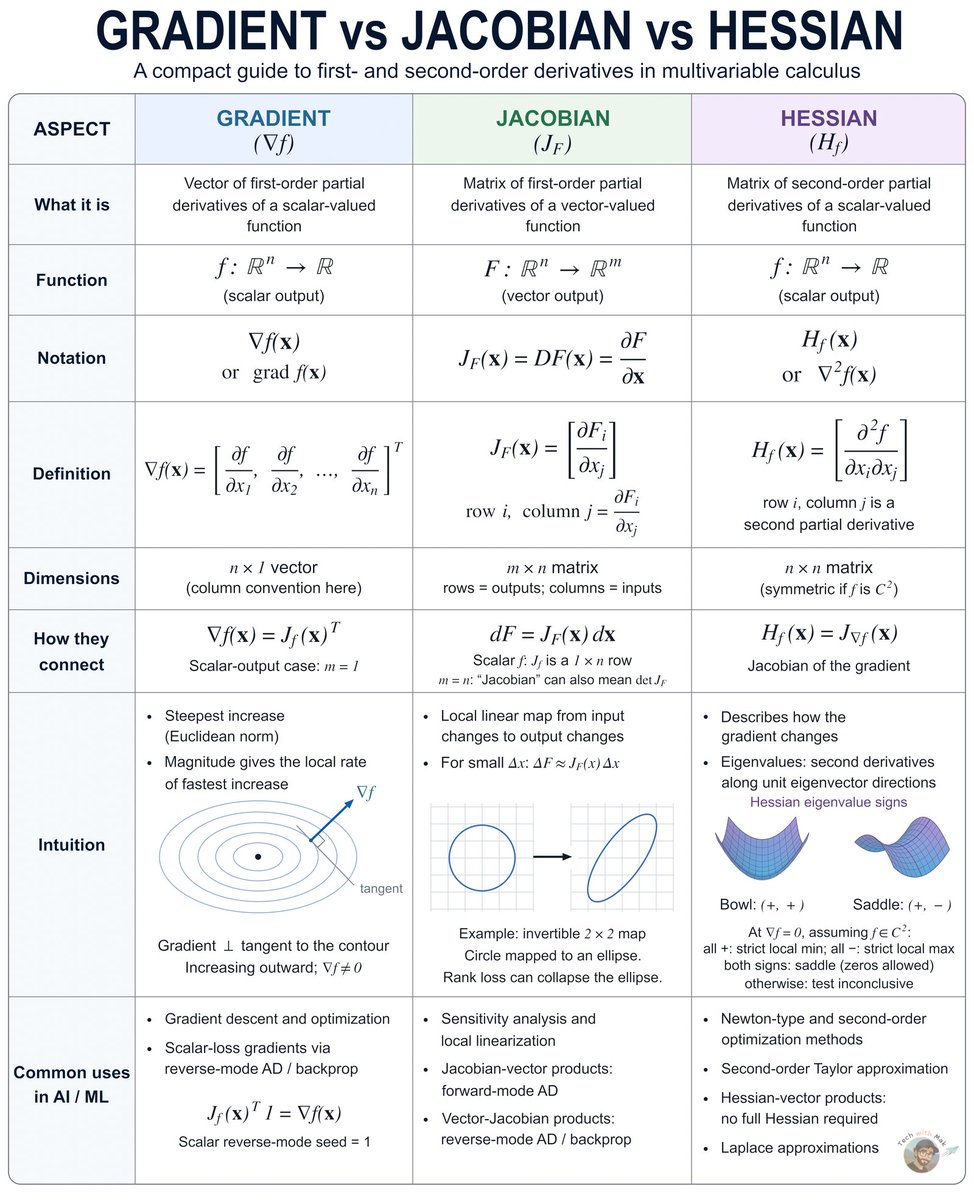
This math sits underneath nearly every AI model being trained right now.
Gradient. Jacobian. Hessian.
Three words that look intimidating at first. But they are really just three ways of measuring change.
(Throughout, assume the functions are smooth enough to differentiate.)
𝟭./ 𝗚𝗿𝗮𝗱𝗶𝗲𝗻𝘁 ∇f
Takes a scalar function:
f : ℝⁿ → ℝ
Returns a vector of n first-order partial derivatives (written as a column here).
It answers:
"Which direction makes f increase fastest?"
That is why gradients are central to optimization.
Gradient descent steps in the opposite direction, because the gradient points uphill.
Backpropagation is how we compute gradients efficiently during training.
𝟮./ 𝗝𝗮𝗰𝗼𝗯𝗶𝗮𝗻 J_F
Takes a vector-valued function:
F : ℝⁿ → ℝᵐ
Returns an m × n matrix of first-order partial derivatives.
It answers:
"How does each output change with each input?"
The Jacobian is the local linear map of F:
ΔF ≈ J_F(x) Δx for small Δx
It shows up in:
→ sensitivity analysis and local linearization
→ change of variables (through its determinant, when m = n)
→ automatic differentiation:
• forward-mode AD computes Jacobian-vector products
• reverse-mode AD (backprop) computes vector-Jacobian products
When m = 1, the Jacobian is just the gradient written as a row.
𝟯./ 𝗛𝗲𝘀𝘀𝗶𝗮𝗻 H_f
Takes a scalar function:
f : ℝⁿ → ℝ
Returns an n × n matrix of second-order partial derivatives.
It answers:
"How does the gradient itself change?"
That is why the Hessian captures the local curvature of f.
When the second partial derivatives are continuous, the Hessian is symmetric.
At a critical point (where ∇f = 0):
→ positive definite Hessian → strict local minimum
→ negative definite Hessian → strict local maximum
→ indefinite Hessian → saddle point
→ semidefinite Hessian → inconclusive
It powers Newton-type and other second-order optimization methods, and uncertainty approximations such as the Laplace approximation.
𝗧𝗵𝗲 𝗰𝗹𝗲𝗮𝗻 𝗺𝗲𝗻𝘁𝗮𝗹 𝗺𝗼𝗱𝗲𝗹
Gradient = first derivatives of one output
→ tells you direction
Jacobian = first derivatives of many outputs
→ tells you sensitivity
Hessian = second derivatives of one output
→ tells you curvature
And they connect:
∇f = (J_f)ᵀ for scalar f (row vs. column convention)
H_f = the Jacobian of ∇f
Same idea:
measure change.
Different object:
direction, sensitivity, curvature.
Once this clicks, optimization stops looking like a pile of formulas.
It starts looking like a map of the problem.
These are the best visual AI resources for learning Transformers, LLMs, embeddings, diffusion, inference and model internals ↓
1/ Transformer Explainer - Watch GPT process text through embeddings, attention, MLPs and next-token prediction.
https://t.co/vkyxOqDVll
2/ Brendan Bycroft’s LLM Visualization - Explore an LLM from architecture down to tensors and operations.
https://t.co/ZFGH0pRtP3
3/ 3Blue1Brown - Visual intuition for linear algebra, neural networks, backprop, attention and Transformers.
https://t.co/plaENBG6aQ
4/ The Illustrated Transformer - One of the clearest visual explanations of embeddings, Q/K/V and attention.
https://t.co/tYrJCm17L6
5/ TensorFlow Playground - Watch neural networks learn as you change layers, activations, features and learning rate.
https://t.co/vva9dm1Gnv
6/ Google PAIR AI Explorables - Interactive explainers on LLMs, generalization, interpretability and model behavior.
https://t.co/vva9dm1Gnv
7/ Distill - Exceptional visual essays on t-SNE, feature visualization, GNNs and interpretability.
https://t.co/FuqpUdDwZD
8/ Abhik Sarkar’s Transformer Visualizations - RoPE, KV cache, FlashAttention, MQA, GQA and more.
https://t.co/vva9dm1Gnv
9/ Visual Guide to Attention Variants - MHA, MQA, GQA and MLA visually compared.
https://t.co/nbpKMa0cpT
10/ Visual Guide to Mixture of Experts - Routing, experts, sparse activation and load balancing.
https://t.co/3gu7xq5e3i
11/ Modular LLM Inference Handbook - Prefill, decode, KV cache, batching, quantization and speculative decoding.
https://t.co/itMIfZnPP5
12/ Apple Embedding Atlas - Explore clusters, neighborhoods and outliers in large embedding spaces.
https://t.co/hxKdXSp5I2
13/ Diffusion Explainer - Follow Stable Diffusion step by step.
https://t.co/YVHEG1zslC
14/ Neuronpedia - Explore features, activations, SAE latents and attribution graphs inside real models.
https://t.co/F8P8eNDH3W
15/ Seeing Theory - Probability, Bayes, distributions, regression and inference made interactive.
https://t.co/KeEhGNSMIQ
16/ CNN Explainer - Visualize convolutions, feature maps, activations and pooling.
https://t.co/sCwv59d2S6
17/ GAN Lab - Train a GAN in your browser and watch its generated distribution evolve.
https://t.co/G94RDWMNak
Save this. There’s a serious AI curriculum hiding inside these links.
Layers of observability in AI systems, explained visually:
If an LLM app is serving real users, its input and output are not enough to debug it.
Consider a RAG pipeline where a query passes through embedding, retrieval, context assembly, and generation.
Every operation adds latency, may call a paid API, and can fail while still producing a valid-looking response.
Traces and spans provide visibility.
- A trace records the full path of one request. The Trace column runs from query to response.
- A span records one operation within that trace. The colored boxes are spans.
Each span captures:
> Query span
The input, timestamp, session identifier, and request metadata.
> Embedding span
The model, input size, latency, retries, and rate-limit errors.
> Retrieval span
The retrieved chunks, document IDs, relevance scores, filters, top-k value, and latency. Many RAG failures originate here. Without these fields, there is no evidence that retrieval selected the wrong documents.
> Context span
The context assembled from retrieved chunks, instructions, and conversation history. This catches truncated documents, duplicated chunks, missing citations, and prompts exceeding the token budget.
> Generation span
The model, token counts, time to first token, total latency, finish reason, retries, and estimated cost.
With these details, a bad response can now be traced to retrieval, context assembly, or generation.
To use this in practice, Opik already implements this observability infrastructure for LLM apps and is open source.
It captures traces and spans across LLM calls, retrieval steps, and tool executions, with latency, token usage, and cost attached to each operation.
GitHub repo: https://t.co/vahjkkfJCt
(don't forget to star it ⭐)
In Opik, every operation belonging to one request carries the same Trace ID. If the app processes 1,000 requests, it creates 1,000 traces, each containing its own spans.
This makes cost analysis more useful. Instead of aggregate spend, teams can identify the model calls, retries, or oversized prompts responsible.
Over time, changes in retrieval scores, embedding latency, or context size become visible before they turn into broader quality problems.
That said, observability is one of eight areas I would learn for building production LLM systems.
I covered all eight in the 2026 LLM Engineering Roadmap, with free and open-source resources for each one.
Read it below.
Si necesitas un diagrama de arquitectura y no te gusta lo que genera Mermaid o una imagen con IA, conoce Archify.
Es un skill para Agentes como Cursor, Claude o Codex: te genera un HTML interactivo con el tipo de diagrama que pidas.
Sirve para explicar un sistema, dejarlo en la documentación o exportarlo a PNG y otros formatos.
https://t.co/CRPZ5xKlqP
si usás agentes para programar, entender cómo funcionan por dentro te cambia la forma de trabajar con ellos.
en este artículo tenés lo que necesitás para empezar con Harness Engineering, explicado fácil y claro.
y si te quedás con ganas de más, te dejo un curso para seguir aprendiendo:
https://t.co/N2d30Trkce
𝗟𝗼𝗴𝘀 𝘃𝘀 𝗠𝗲𝘁𝗿𝗶𝗰𝘀 𝘃𝘀 𝗧𝗿𝗮𝗰𝗲𝘀.
Logs, metrics, and traces can all point to the same problem, but they show you that problem from completely different perspectives.
𝗟𝗼𝗴𝘀 = “𝗪𝗵𝗮𝘁 𝗵𝗮𝗽𝗽𝗲𝗻𝗲𝗱?”
When something happens inside an application, logs capture a timestamped record of the event, from errors and warnings to requests and state changes. That detailed context helps you understand exactly what happened at a particular point in time.
𝗠𝗲𝘁𝗿𝗶𝗰𝘀 = “𝗛𝗼𝘄 𝗶𝘀 𝘁𝗵𝗲 𝘀𝘆𝘀𝘁𝗲𝗺 𝗯𝗲𝗵𝗮𝘃𝗶𝗻𝗴?”
Rather than recording individual events, metrics turn system behavior into numerical measurements over time, such as request rate, error rate, latency, CPU usage, and memory consumption. This makes patterns, trends, and abnormal behavior much easier to spot.
𝗧𝗿𝗮𝗰𝗲𝘀 = “𝗪𝗵𝗮𝘁 𝗽𝗮𝘁𝗵 𝗱𝗶𝗱 𝘁𝗵𝗲 𝗿𝗲𝗾𝘂𝗲𝘀𝘁 𝘁𝗮𝗸𝗲?”
Across a distributed system, a single operation can pass through many services. Traces connect spans from each step into an end-to-end journey, showing where time was spent, which services were involved, and where errors or latency appeared.
But during an incident, seeing the signals is only part of the problem.
The hard part is connecting them with deploys, commits, dependencies, and past incidents 𝘁𝗼 𝗳𝗶𝗴𝘂𝗿𝗲 𝗼𝘂𝘁 𝘄𝗵𝗮𝘁 𝗮𝗰𝘁𝘂𝗮𝗹𝗹𝘆 𝗯𝗿𝗼𝗸𝗲 𝗮𝗻𝗱 𝘄𝗵𝘆.
That’s where agentic root cause analysis can help. Investigations by @incident_io starts working the moment an incident is declared, reasoning across that context to build a hypothesis backed by evidence and identify where to look next.
𝗜𝗻𝘀𝘁𝗲𝗮𝗱 𝗼𝗳 𝘀𝘁𝗮𝗿𝘁𝗶𝗻𝗴 𝗳𝗿𝗼𝗺 𝘀𝗰𝗿𝗮𝘁𝗰𝗵 and digging for answers, 𝘆𝗼𝘂 𝗮𝗿𝗿𝗶𝘃𝗲 𝘄𝗶𝘁𝗵 𝗮 𝘄𝗼𝗿𝗸𝗶𝗻𝗴 𝘁𝗵𝗲𝗼𝗿𝘆.
Check it out → https://t.co/45CkvWsPva
What else would you add?
——
♻️ Repost to help others learn and grow.
🙏 Thanks to incident .io for sponsoring this post.
➕ Follow me ( Nikki Siapno ) to improve at AI and system design.
🚨 Ahora puedes convertir cualquier libro en una skill de Claude.
Normalmente, utilizar un libro completo como contexto puede consumir cientos de miles de tokens antes de hacer una sola pregunta.
Alguien acaba de crear una herramienta open-source para solucionar este problema.
Se llama book-to-skill y transforma cualquier libro en una skill que Claude puede consultar capítulo por capítulo.
Esto es lo que genera:
→ Un archivo SKILL.md con los conceptos principales y el índice completo
→ Un archivo independiente por cada capítulo
→ Un glosario con los términos clave y sus referencias
→ Un documento con todas las técnicas, patrones y algoritmos del libro
→ Una guía rápida con reglas y tablas de decisión
Lo más interesante:
Los capítulos solo se cargan cuando realmente los necesitas.
Puedes instalar 20 libros y Claude únicamente consume tokens del capítulo que estás consultando en ese momento.
Un libro de 400 páginas puede requerir alrededor de 200.000 tokens si lo cargas completo.
Con este sistema, cada respuesta se basa directamente en el contenido del libro y reduces gran parte de las alucinaciones.
Es completamente gratuito y open-source.
Te dejo el repo en comentarios 👇
Kafka looks complicated until you understand the problem it solves.
Learn it in this order:
1. Fundamentals
→ Producers
→ Consumers
→ Topics
→ Partitions
2. Message Flow
→ Records
→ Offsets
→ Consumer Groups
→ Polling
3. Scaling
→ Partitioning
→ Parallelism
→ Replication
→ Rebalancing
4. Reliability
→ Acknowledgements
→ Replication Factor
→ Leader Election
→ Fault Tolerance
5. Delivery
→ At Most Once
→ At Least Once
→ Exactly Once
6. Architecture
→ Event Streaming
→ Event-Driven Systems
→ Log Compaction
→ Retention
7. Production
→ Monitoring
→ Lag
→ Backpressure
→ Failure Recovery
Don't learn Kafka because everyone uses Kafka.
Learn it when your problem actually needs an event streaming platform.
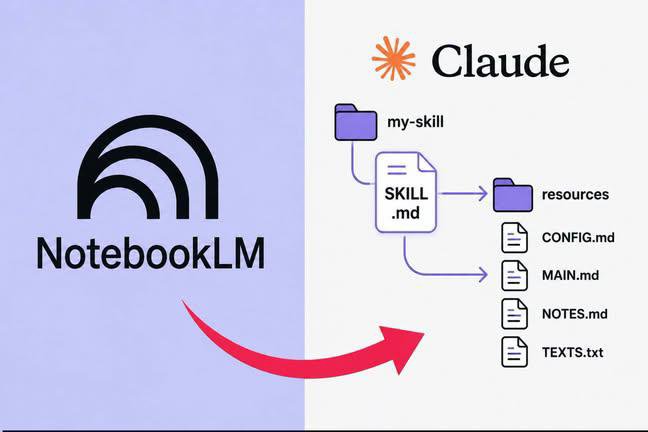
🚨LA GENTE ESTÁ USANDO NOTEBOOKLM PARA PRODUCIR MASIVAMENTE SKILLS ESPECIALIZADAS DE CLAUDE EN MINUTOS
En lugar de escribir los mismos prompts repetidamente, utilizan conocimientos recopilados para crear archivos reutilizables "SKILL▪︎md" que ayudan a Claude a ofrecer resultados consistentes para tareas específicas
Así es como funciona 👇👇


![KirkDBorne's tweet photo. Handbook on Understanding Harness Engineering for AI Agents [48-page PDF]: https://t.co/mHjkhT405C https://t.co/qhzHGxOmco](https://pbs.twimg.com/media/HTzg6RiXUAAOlDz.jpg)