Struggling to identify key levels and direction? Try our indicators out for one week for FREE!
Our automated bias trading system said short the pops all day long. Let data powered tools help you make informed trading decisions🧠
Intraday look at $SPY with our tools & morning game plan: 4 failed attempts to break above our line in the sand, Gorb MA & intraday resistance.
Lower indicator DNA showed weak call flow, then put flow took over with a purple flip at resistance—perfect short setup under lowest Darkpool to HTF support.
Making trading as simple as levels and color matching✅
✅We got our pullback to 592 exactly like we wanted
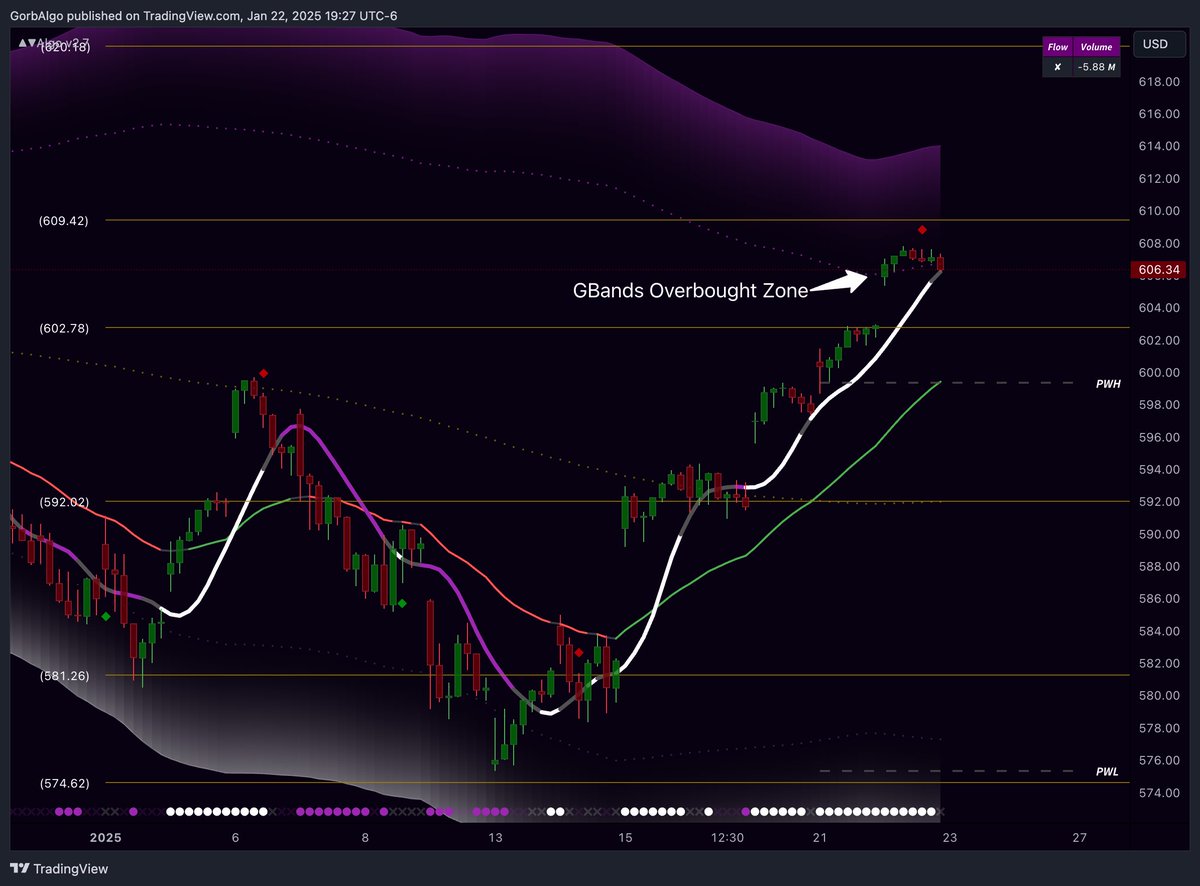
Our tools led the way giving us predetermined levels, combined with confluence of overbought GBands zone and the Put spike red diamond on $SPY.
Hope everyone enjoys the volatility this week brings💰
$QQQ $ES $SPX $NVDA
$SPY entered our GBands overbought zone we tweeted about as being our first resistance here over our 602.78 level.
There is also a red diamond indicating a spike in put flow. Be interesting to see our reaction here at this level, would love to see a pullback to that 592 area we hovered around a lot this month.
Seeing a lot of selling pressure in our tools on the top right for $SPY. Plus DNA at the bottom shows Call Flow has struggled to maintain above the threshold line.
Good confluences showcasing not to be long right now.