🇮🇳
#crudeoil#NIFTY
▶This tweets is only for #educational purposes.
▶Admin is not responsible for any P&L. Trade at you risk & consult your financial adviser
BIG NEWS 🚨 Rajasthan's Marble Traders halt imports from Turkey over support to Pakistan during Operation Sindoor.
They said "We are one of the biggest markets of Turkish marble and have decided to stop the trade with Turkey" 😳
"India imports about 14 to 16 lakh tons of marble from and 70 percent of this is from Turkey. HUGE loss for Turkey"- TRADERS 🔥
levels to watch in case of a decline
This strategy relies on identifying key support and resistance levels, and trading based on breakouts or bounces from these levels.
Key Levels
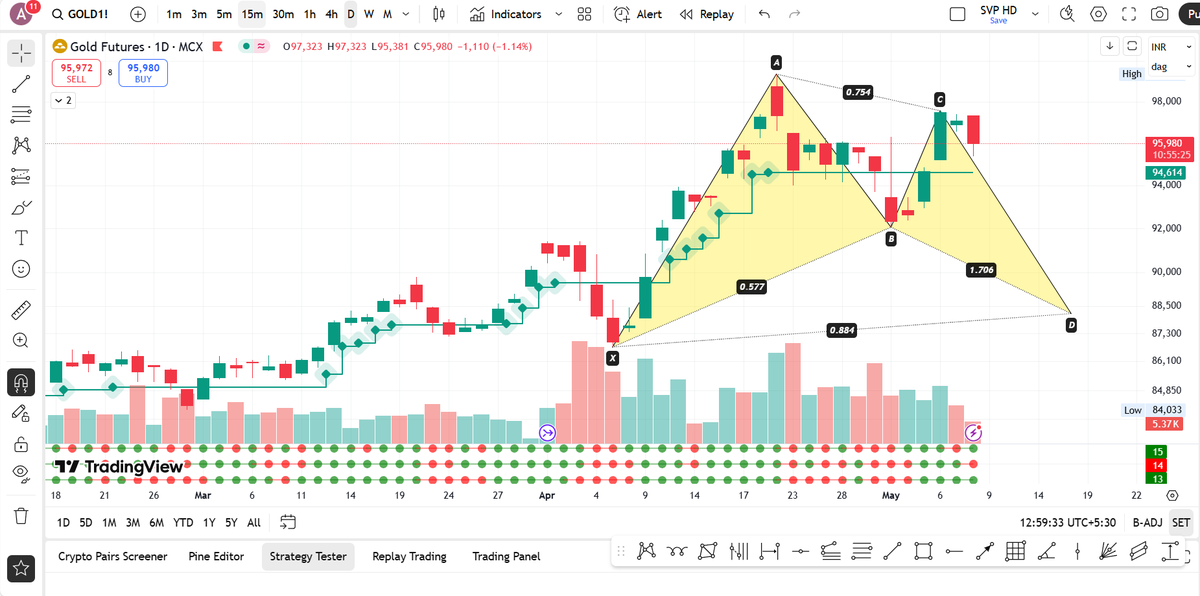
- Support: ₹88,000
- Resistance: ₹98,000
- Target: ₹85,000
This analysis is based on technical chart patterns and may be subject to change based on market dynamics.
Potential Targets
If the analysis holds, the final target for Gold could be ₹85,000.
Pattern Analysis
Based on pattern recognition, Gold appears to be forming a Butterfly pattern, which may influence its future price movement.
#gold view
Gold Market View
According to my chart analysis, Gold has declined to ₹88,000 from its current market price (CMP) of ₹96,000. A change in view is anticipated if Gold surpasses ₹98,000.
Investment Strategy
Based on my 18 years of experience, I advise caution when investing during this phase. Avoid going all-in with your full investment power, as the next correction could present excellent opportunities to accumulate quality stocks at lower prices.
1. Price correction: A decline in market value.
2. Time correction: A period of consolidation or sideways movement.
Current Market Scenario
We are currently experiencing a time correction, which can be challenging for market participants due to uncertainty and frustration.
Potential Market Movement
Historically, the market has bounced back strongly from lower levels, resulting in substantial gains. In the past, we've seen movements of over 2,400 points within a short span of 8 days.
Correction Types
There are two types of corrections:
#Nifty Market View
According to my analysis, Nifty is holding a strong support area around 24,220. A breach of this level could trigger a significant downside move. The market has been consolidating around this area, which is positive for long-term prospects.
Trading Strategy
Traders can monitor these levels closely and adjust their strategies accordingly, keeping an eye on the trigger level of 24,120 for Nifty.
Market Outlook
According to my analysis, the market is expected to correct further. Key levels to watch are:
Nifty
- Trigger Level: 24,120
- Potential Targets: 23,650, 23,056, and 22,760
BankNifty
- Potential Targets: 53,450, 52,680, and 51,890
Market Outlook
According to my analysis, the market is expected to correct further. Key levels to watch are:
Nifty
- Trigger Level: 24,120
- Potential Targets: 23,650, 23,056, and 22,760
BankNifty
- Potential Targets: 53,450, 52,680, and 51,890
Key Levels to Watch
- Resistance: 24,020 (50% Fibonacci retracement level) and 24,545 (61% Fibonacci level)
- Support: 23,565 and 23,480
Market Outlook
Nifty's movement around these key levels will determine its next direction.
Key Levels to Watch
- Resistance: 24,020 (50% Fibonacci retracement level) and 24,545 (61% Fibonacci level)
- Support: 23,565 and 23,480
Market Outlook
Nifty's movement around these key levels will determine its next direction.
Potential Trading Strategies
Buy: Consider buying Nifty if it consolidates above the support levels (23,565 and 23,480) with strong momentum indicators.
- Sell: Take a short position or book profits around the resistance levels (24,020 and 24,545) as selling pressure is expected
Nifty Technical Analysis Update
Based on our chart analysis, Nifty is expected to face resistance at 24,020 and 24,545, while finding support at 23,565 and 23,480. We anticipate Nifty to potentially hit 24,545 in the short term.