What started as a grassroots initiative by a WHO staff member has grown into a global movement for health.
Learn more about the #1Dollar1World campaign and get involved.
People have the power 👏
🔗 https://t.co/BPxRWQPCMv
🚀 Call For Presentations! 🚀
Share your GIS innovations and ArcGIS applications at the Esri UAE User Conference. Submit your abstract by November 15, 2024
🔗 Submit here: https://t.co/tmf2jGOigk
Don’t miss out on this chance to shine!
#EsriUAEUC#GIS#Esri#ArcGIS#EsriUser
Principal Component Analysis (PCA) is an essential technique for reducing the dimensionality of data sets while maintaining their key characteristics.
By transforming original variables into a new set of uncorrelated principal components, PCA captures the most significant variance in the data, making analysis and visualization simpler.
Implementing PCA in R is straightforward using the prcomp() function from the stats package. This function efficiently computes the principal components and summarizes their importance. For visual insights, the ggplot2 package can be used to plot the results.
Steps to Implement PCA in R:
1️⃣ Load Data: Import your data set with read.csv() or read.table().
2️⃣ Perform PCA: Use prcomp() to calculate the principal components.
3️⃣ Standardize Data: Enable standardization directly in prcomp() by setting scale. = TRUE.
4️⃣ Analyze Results: Review the variance captured by each component with summary() and visualize using ggplot2.
For a comprehensive, step-by-step guide to performing PCA in R, including practical examples, check out my tutorials created in collaboration with Paula Villasante Soriano & @Cansu_SG.
Article: https://t.co/PNkfQ0z5TZ
Video: https://t.co/TIoqCIrnqs
Furthermore, I have developed an extensive online course on PCA, covering both the theoretical concepts and practical application in R programming. For more information, visit this link: https://t.co/DUfoAHuxxD
#RStats #DataScientist #DataAnalytics #ggplot2 #Data #StatisticalAnalysis
📢 I am teaching an Introduction to GIS Programming course this semester! All course materials are freely available online. New video lectures will be uploaded twice a week. Check out the links below to learn #geospatial 🌍 data visualization and analysis using #opensource Python packages 📊
Website: https://t.co/2dK3d0n9Rz
GitHub: https://t.co/yBth77q1pC
YouTube playlist: https://t.co/9sbsl5SHNk
#geospatial #python #jupyter
Here is a step-by-step process to apply to this university in the USA with
✅No application fee
✅NO IELTS
✅No GRE
✅Funding available
✅Stem and Non-stem
Deadlines vary by program
https://t.co/4nt6BUHCnz
Everything you need to know about Digital Elevation Models (#DEM), Digital Surface Models (#DSM), and Digital Terrain Models (#DTM)
Nikita Marwaha Kraetzig
Mar 12, 2021
https://t.co/xTnEXbPnqe
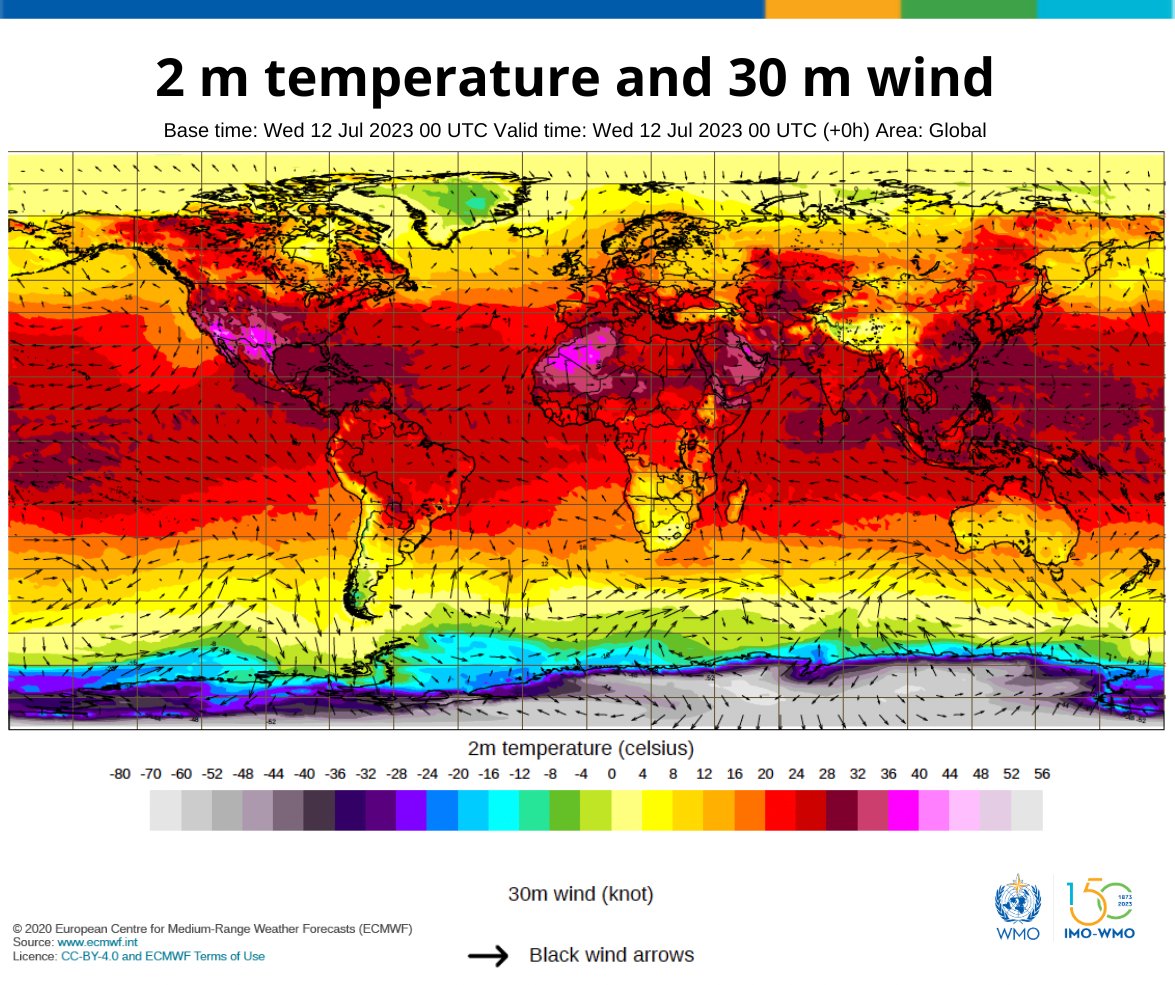
🔥 🥵 The heat continues. July started with the hottest week on record. Extreme heat in North Africa, the Middle East, the Mediterranean, large parts of Asia and the southern USA. 🌍🌎 🌏 #StateofClimate
🔗 https://t.co/NbYM6Nllii
The 7 hottest days on Earth in the last 100,000+ years all happened in the last week:
July 6 ~ 17.23°C / 63.01°F
July 7 ~ 17.20°C / 62.96°F
July 4 ~ 17.18°C / 62.93°F
July 5 ~ 17.18°C / 62.92°F
July 8 ~ 17.17°C / 62.90°F
July 10 ~ 17.12°C / 62.81°F
July 9 ~ 17.11°C / 62.79°F
How are we using water? 💧
We show eight water use categories across #CONUS, where western water is largely used for irrigation, and eastern water is primarily used for public supply & industry.
#Day8 | #30DayChartChallenge Humans 📅| #DataViz by Hayley Corson-Dosch #rstats
The journey started with no hope, but through perseverance and dedication, I have been able to sail through. I couldn't have done it without the support of my family, friends, and lecturers. I want to thank you everyone for making this achievement possible.
#graduation#ThankYou
The #DroughtinSomalia is a humanitarian catastrophe.
@UNCERF is one of the partners helping @unicefsomalia to rehabilitate boreholes in drought-affected areas of Puntland, which will support some 21,000 people.
#InvestInHumanity