Customer service goes beyond answering calls, it’s about understanding patterns and what drives customer satisfaction.
I built this interactive Call Center Dashboard using @msexcel to analyze 200K+ calls, track agent performance, and uncover why calls fail or get abandoned.
Hi #DataFam
I’m excited to share that my portfolio website is now live
I’m open to working with individuals and businesses looking to make smarter, data-driven decisions.
Link: https://t.co/fRHzGVFyOF
Available for:
• Data analysis projects
• Dashboard development
Week 3 of learning Python
We explored Python's lists, dictionaries, and sets by organizing supply chain data: building product-supplier dictionaries, filtering high-value orders, and counting unique suppliers 😊.
@TDataImmersed#thedataimmersed
This week I learned to build order approval logic, use for loops, evaluate supplier performance, load and analyze the supply chain dataset.
#TheDataImmersed
I began my Python learning journey with @TDataImmersed, and it's been interesting. Completed Week 2 project: created a Python program using if/else, loops, and functions to process order and supplier data, and loaded a supply chain dataset. Excited for deeper analysis!
Happy Two Years Anniversary to The Data Immersed (TDI)!!!
When I started learning Data Analytics, I told a friend I wanted to get an internship after just 3 months of learning and that I wanted to earn ₦100k or more.
His response was, “That’s not possible. You don’t have experience. And besides, companies that pay interns ₦100k+ are very few in Nigeria.”
My response was simple, “As long as those companies exist, I’ll get it.”
Long story short, I got an internship paying ₦100k.
It wasn’t just faith. It was hard work. I put in the work day and night.
Fast forward…
I created a community to help people who were once as lost as I was in the data space. And guess what? That community has grown into a Full Data company.
Today, with the help of people who have love for data, we don’t just train people, we help them grow.
Help them get data gigs. We consult for companies.
Collaborate with Companies and individuals. We host yearly summits that connect students and professionals across the tech space.
And today, we officially turn 2 years old!!!
Happy Two Years Anniversary to The Data Immersed (TDI)!!!!
Hi #datafam,
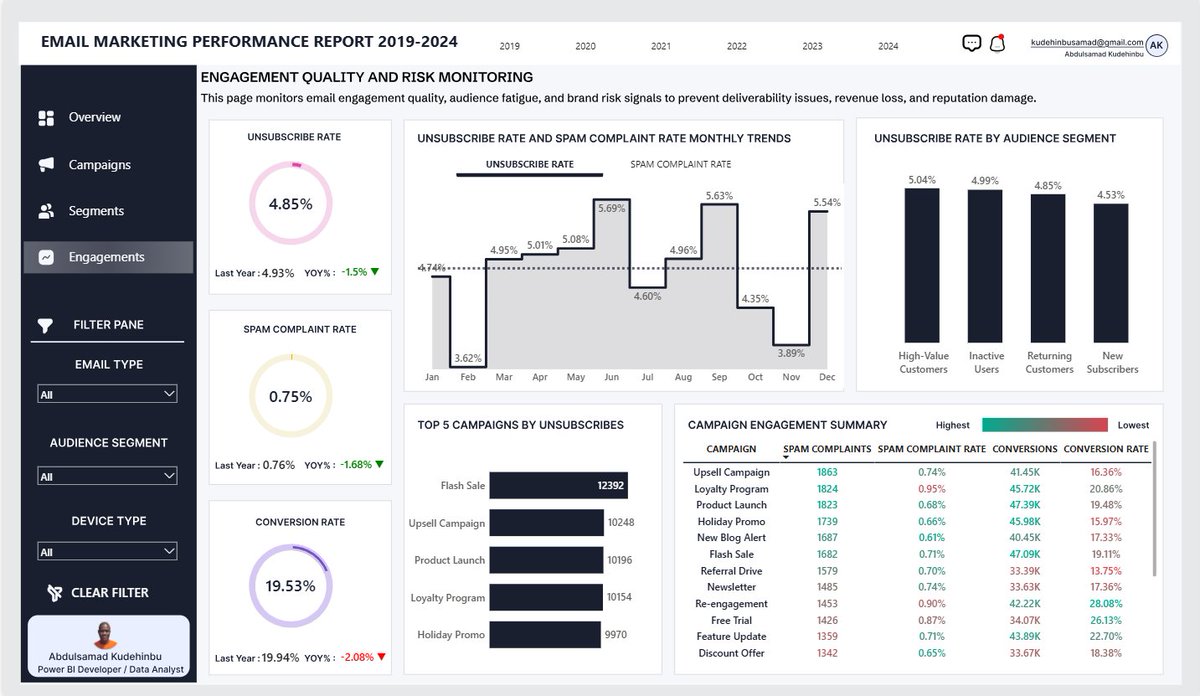
For my first Power BI Project of 2026, I designed a 4-page report enables executives to understand email performance, revenue impact, and campaign risk in a single, unified view, allowing for faster and more confident decision-making.
Customer service goes beyond answering calls, it’s about understanding patterns and what drives customer satisfaction.
I built this interactive Call Center Dashboard using @msexcel to analyze 200K+ calls, track agent performance, and uncover why calls fail or get abandoned.
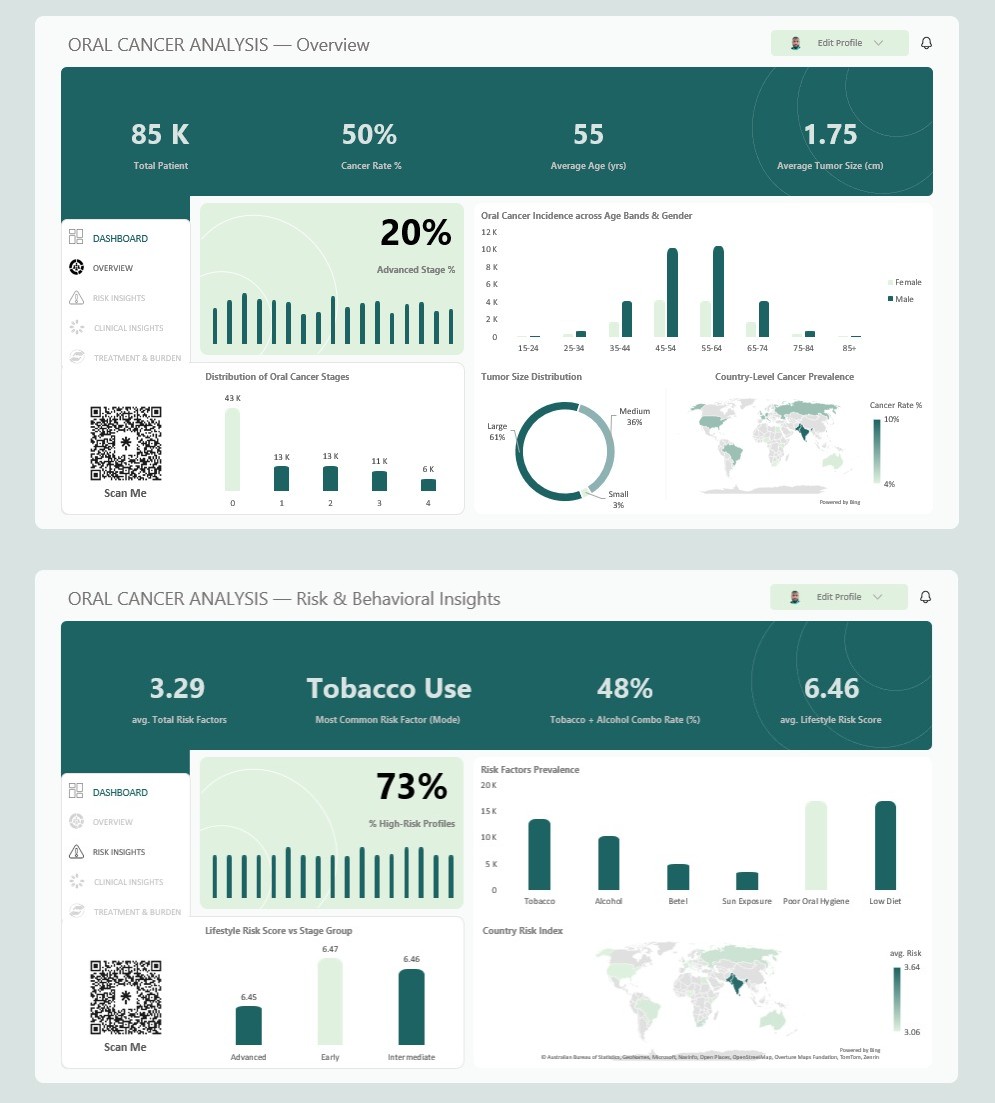
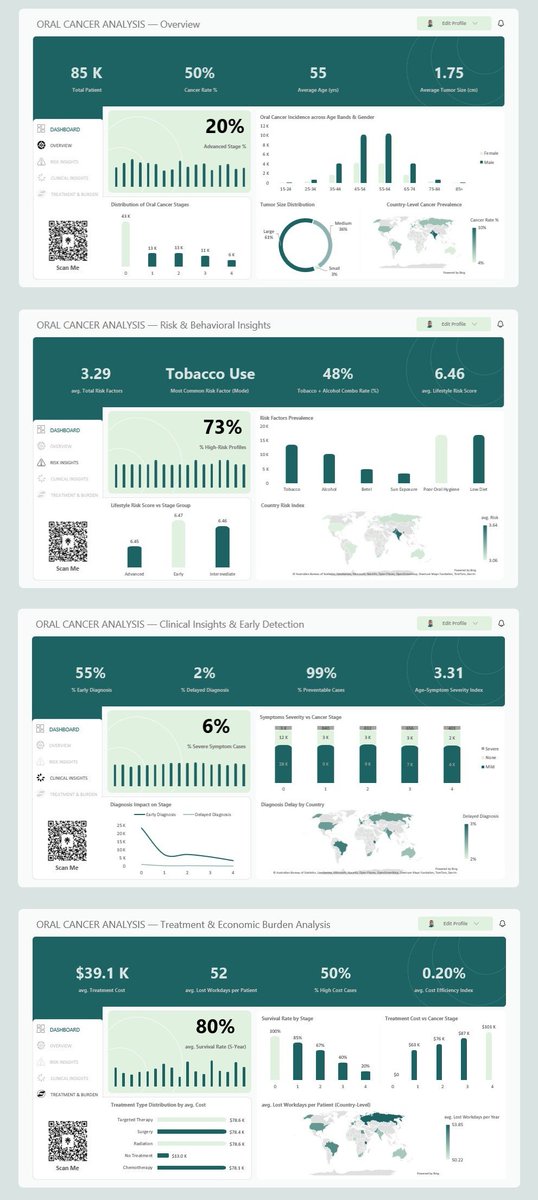
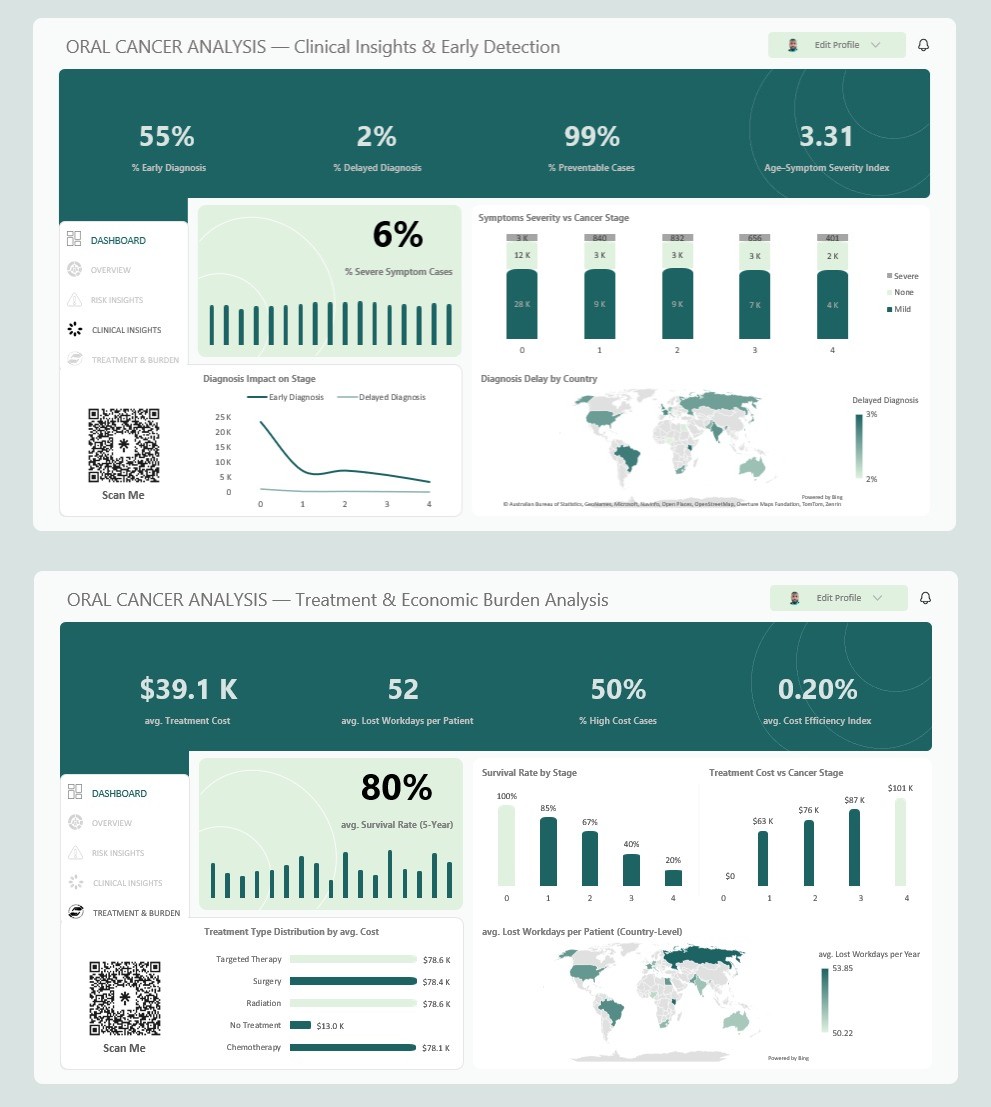
I spoke to a man who had just been diagnosed with late-stage Oral Cancer. He asked me a question:
“If this was caught earlier… would my story be different?”
Full post on LinkedIn 👇🏾
🔗 https://t.co/2LCEEkIOAZ
#OralCancer#DataAnalytics#Datafam#Healthcare#Excel
Using the data to tell the thrilling story of humanity’s journey to the stars 🌌
I built a dashboard tracking all space missions launches (1957–2022)
Full documentation: https://t.co/8HQRb6pwjG
Data truly tells our journey to the stars.
#DataVisualization#Excel#Datafam
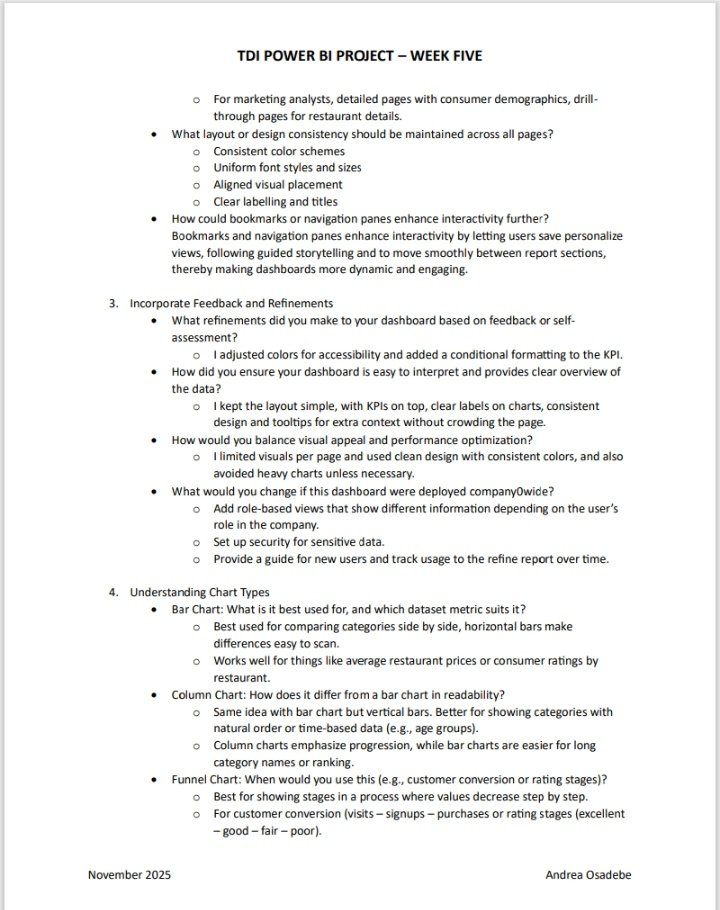
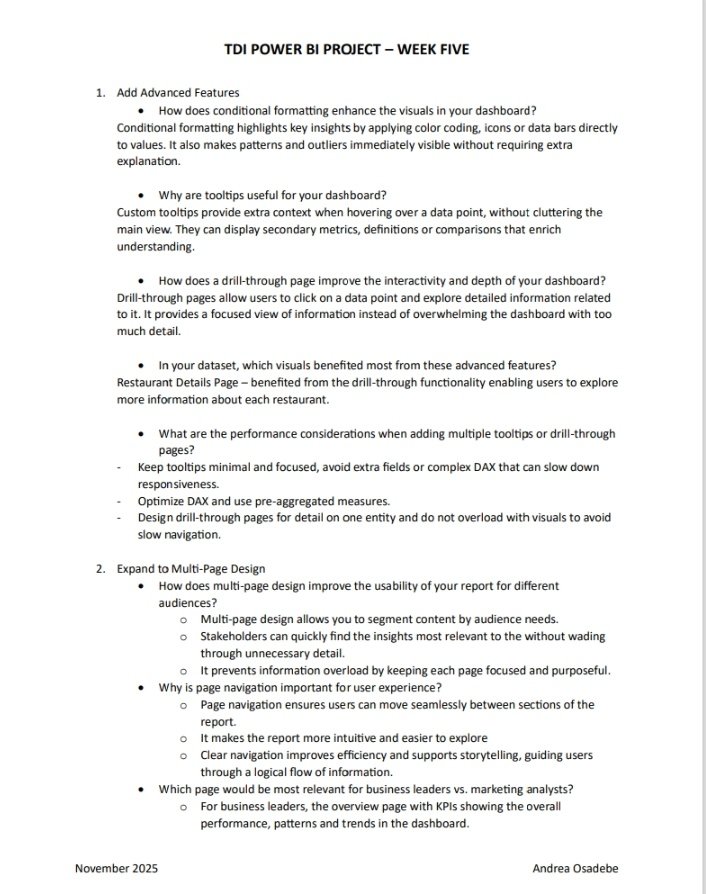
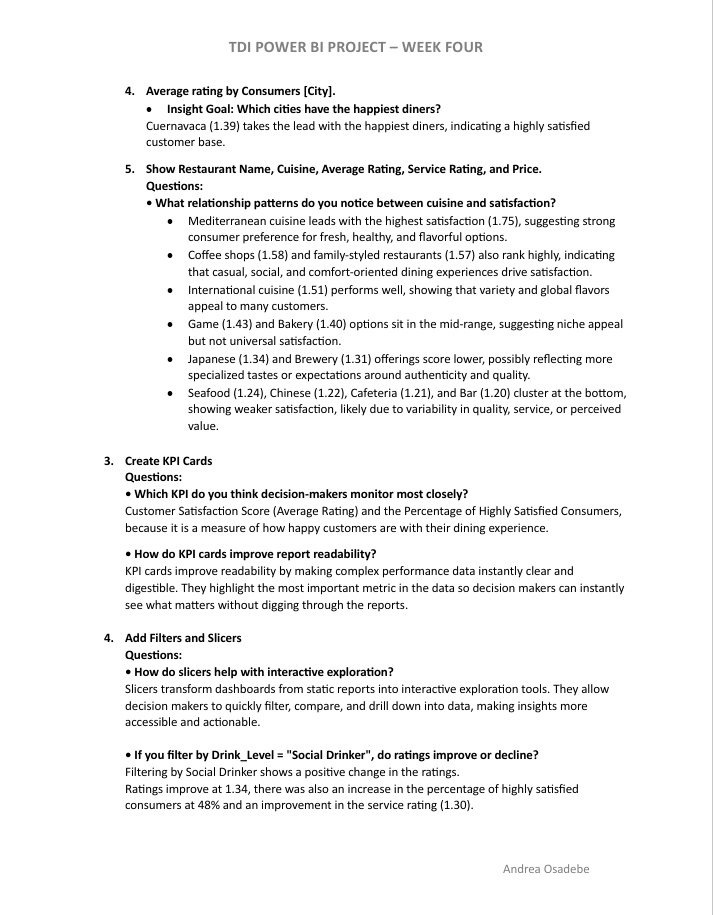
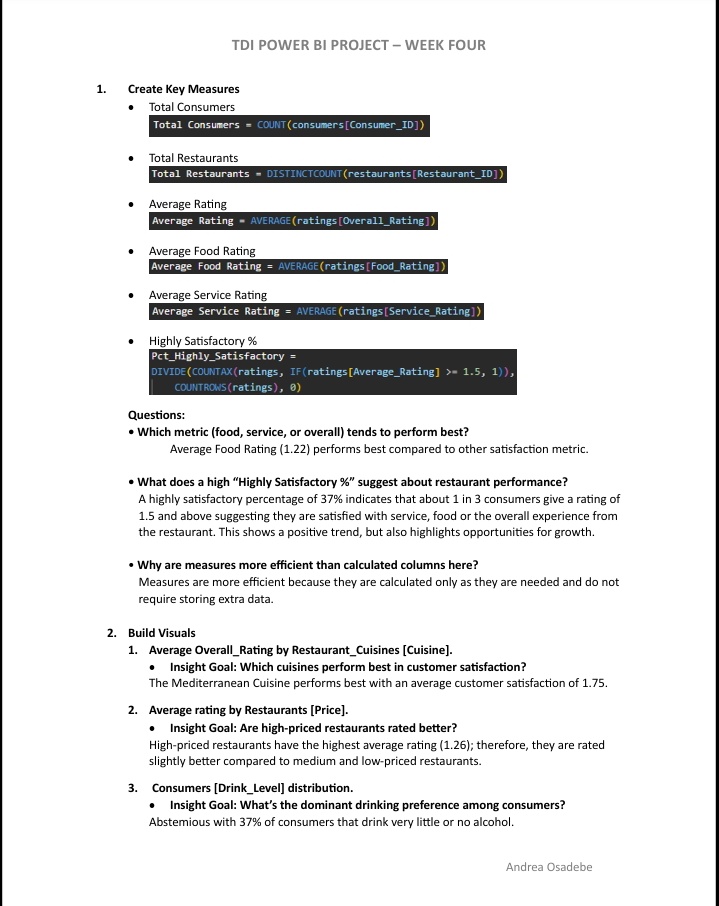
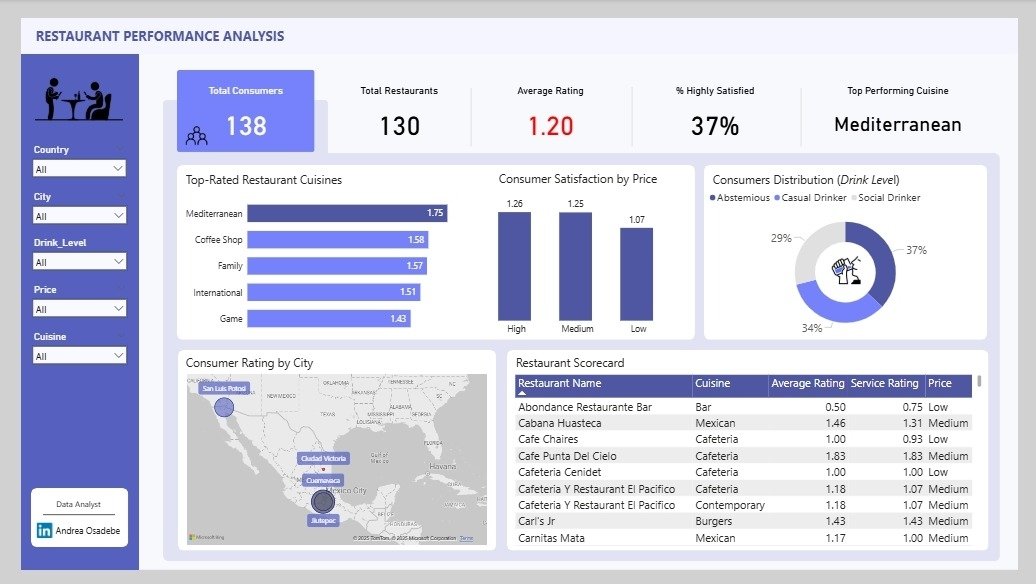
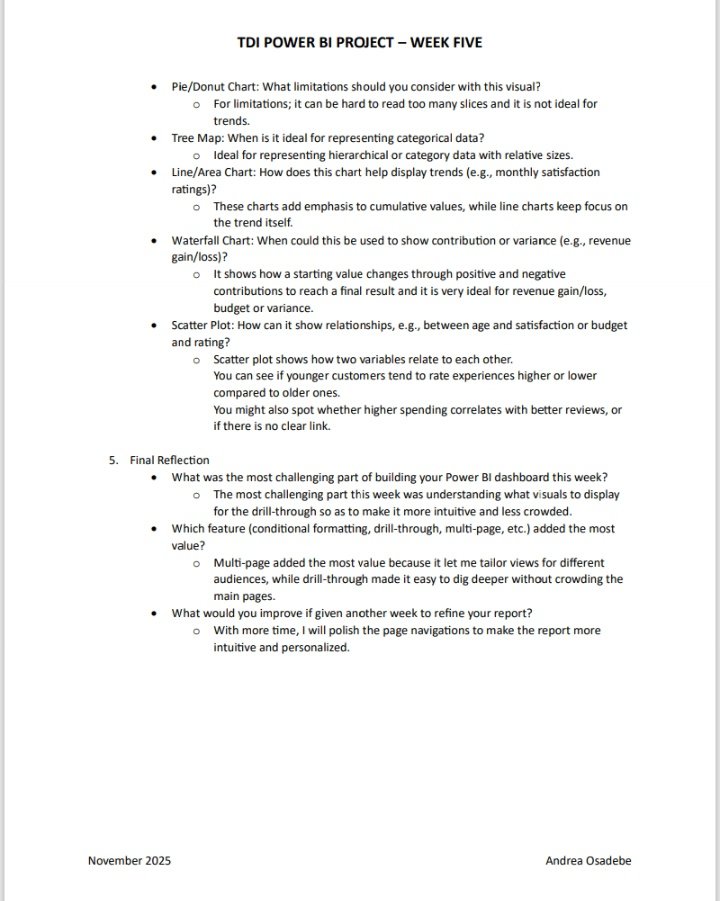
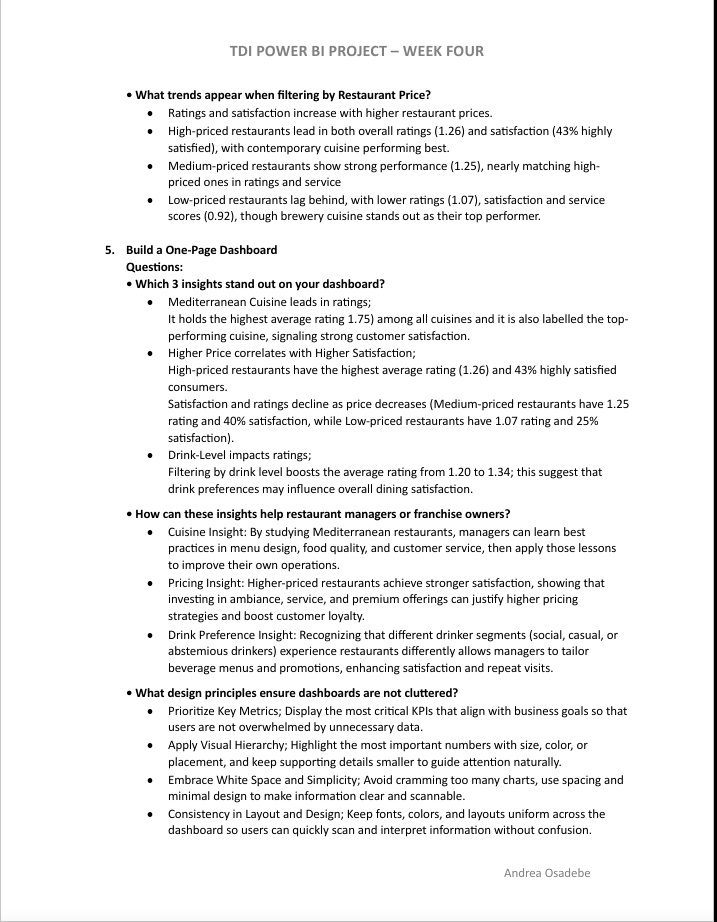
This week, the focus was on crafting a compelling data story through an interactive dashboard, highlighting key metrics and visualizations that drive actionable insights into customer satisfaction across a chain of restaurants.
@PowerBI#TDI#PowerBI#DataTransformation