#30DayChartChallenge | Day 11: Circular
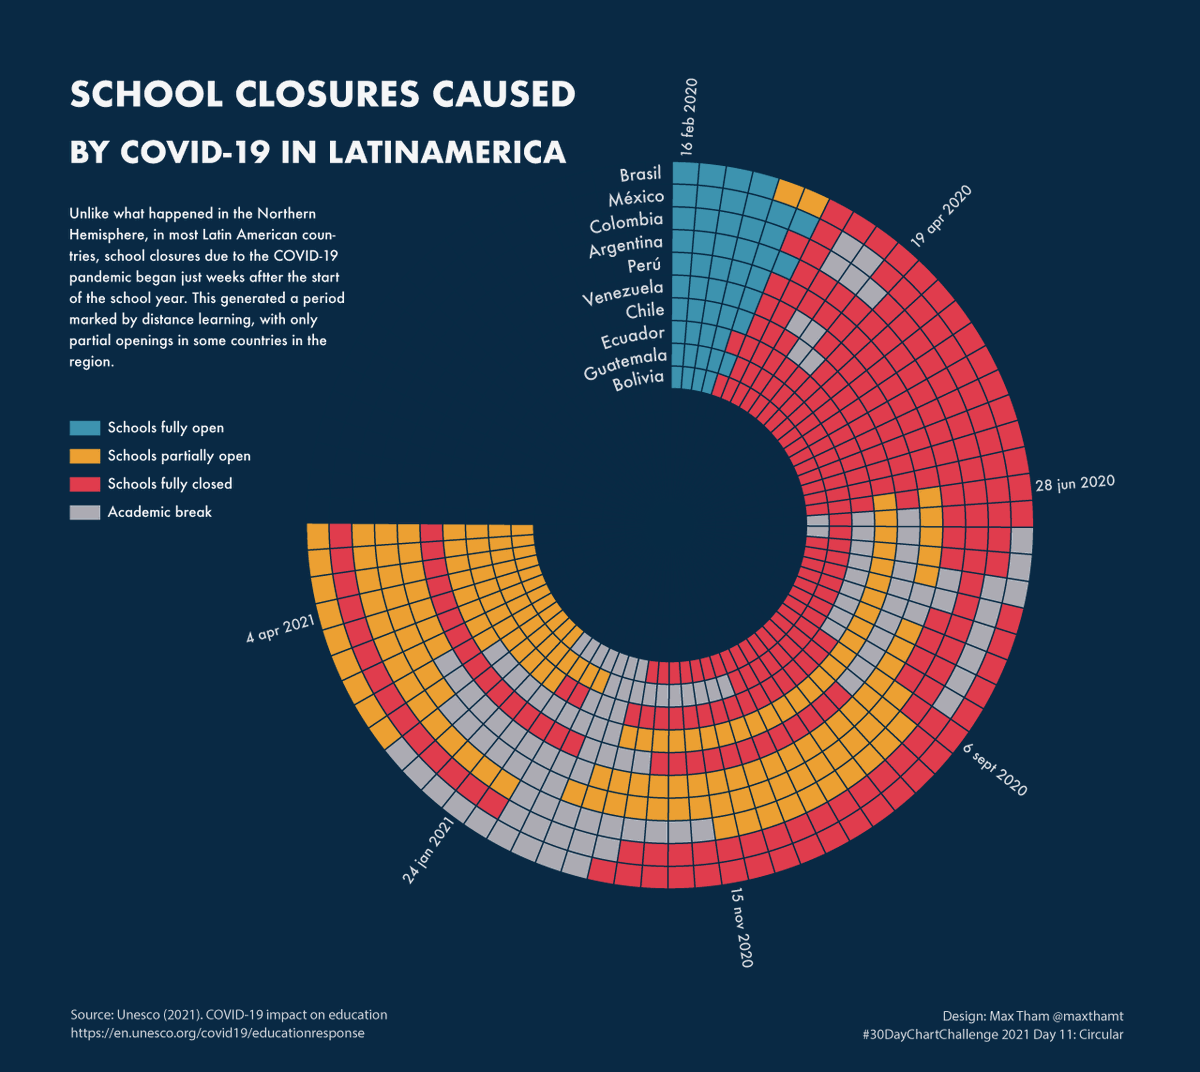
For Day 11, I used the Unesco database about school closures due to COVID-19 and showed how the school closures status has distributed in 10 Latin American countries.
Tools: #rstats#ggplot2 for the base chart & #illustrator for styling
¡Usa la (D3) fuerza!
Nos vemos este viernes 11 de Junio, a las 12PM COT para nuestro @d3js_org meetup en español. Les estaré contando commo usar el sistema de fuerzas de D3 para crear visualizaciones animadas.
¡Ayúdenme a difundir!
cc @d3visualization
https://t.co/0bSaff0Wsy
In honor of #Pride Month, we’ve curated the Tableau Public Viz Gallery with a brand new exhibit. Go take a peek now! Special thanks to @EveThomas1@boknowsdata@Alexanalytics1@sarkahubacek @maxthamt @ktkilroy for the inspiring vizzes: https://t.co/at2cR2cOdl
I managed to participate in 26 of the 30 days of the #30DayChartChallenge. I learned a lot from the great submissions of so many people and used the opportunity to use different tools #rstats#ggplot2#tableau#d3js....
A shot out to @CedScherer & @dr_xeo for organizing this!
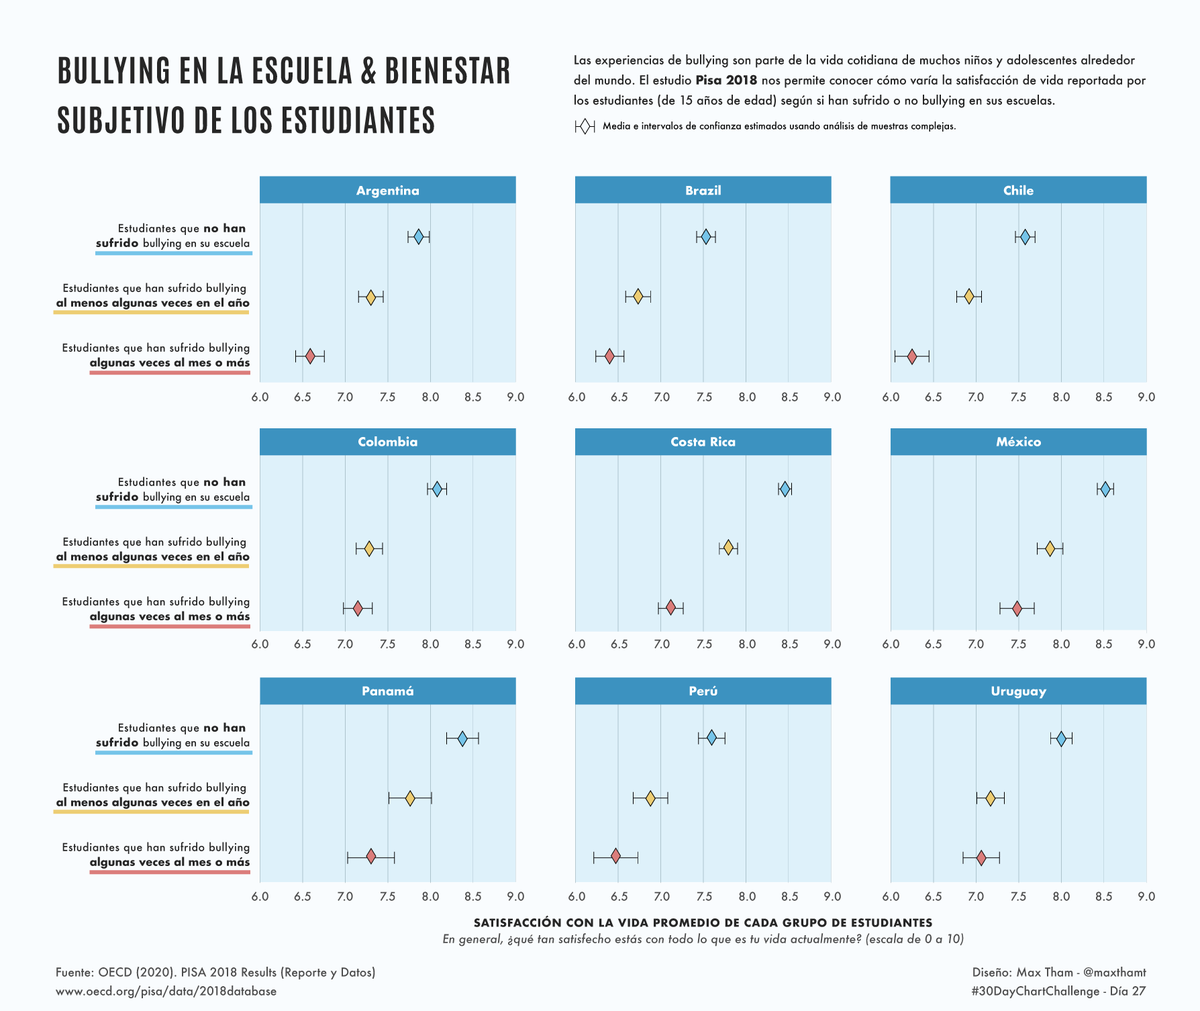
#30DayChartChallenge Día27 incertidumbre/educación
Esta visualización compara el bienestar subjetivo de estudiantes que han sufrido bullying en sus escuelas y estudiantes que no lo han sufrido
En: #rstats#ggplot#illustrator
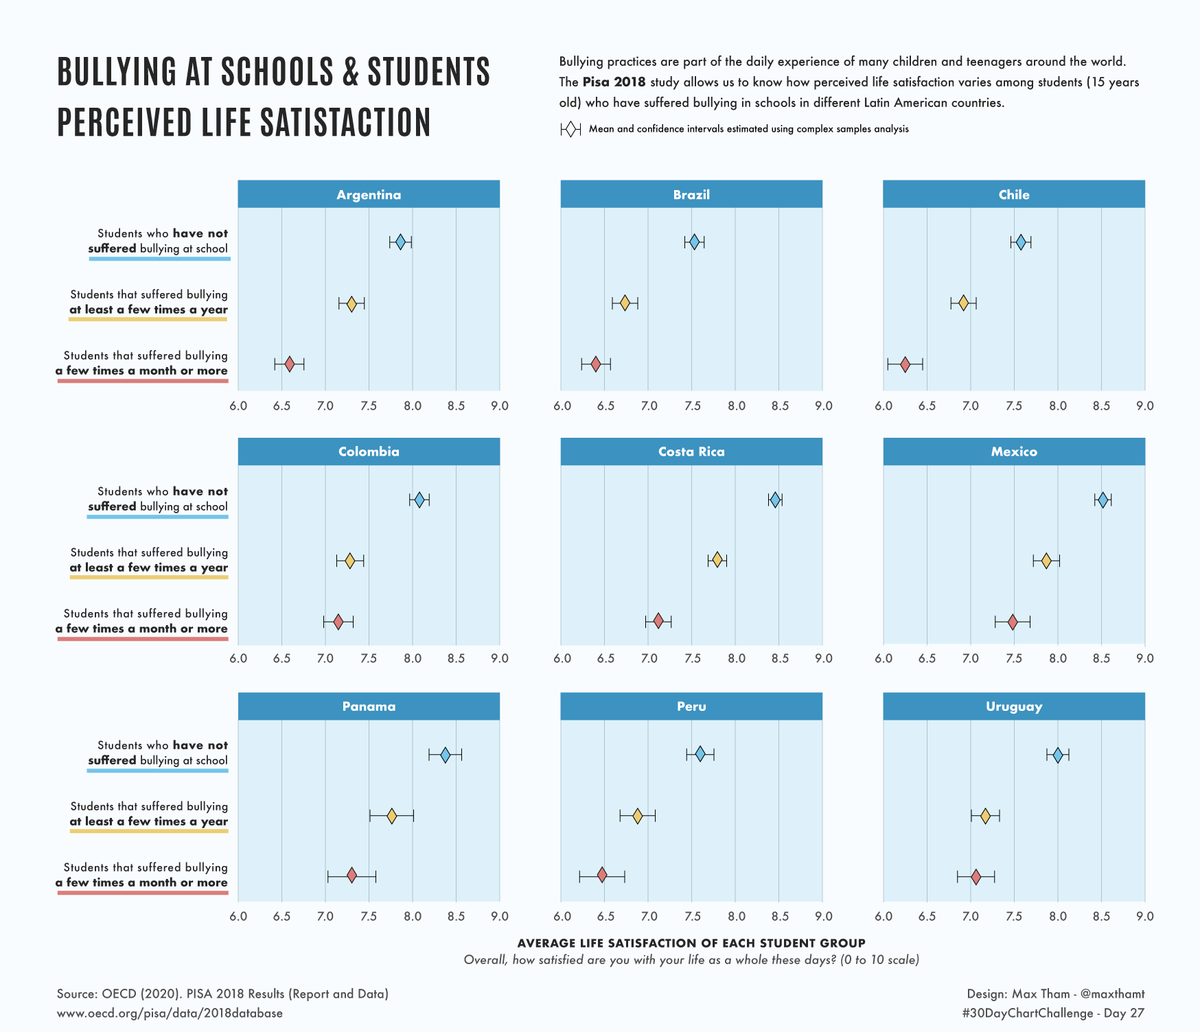
#30DayChartChallenge Day27 uncertainties/education
This #dataviz compares the perceived life satisfaction of students who have suffered bullying in their schools and students who have not suffered it.
Tools: #rstats#ggplot#illustrator
#30DayChartChallenge Día 25 incertidumbres/demografía
Para el día 25 estimé la proporción de jóvenes que se identifican como LGB/en exploración en Chile. Incluí los intervalos de confiana para visualizar la incertidumbre de la estimación.
#rstats#ggplot#illustrator
#30DayChartChallenge Day25 uncertainties/demographic
For day 25 I estimated the LGB/questioning youth in Chile and some of their demographic characteristics w/the 'survey' package. I included the confidence intervals to visualize uncertainty
Tools: #rstats#ggplot#illustrator
#30DayChartChallenge | Day 11: Circular
For Day 11, I used the Unesco database about school closures due to COVID-19 and showed how the school closures status has distributed in 10 Latin American countries.
Tools: #rstats#ggplot2 for the base chart & #illustrator for styling
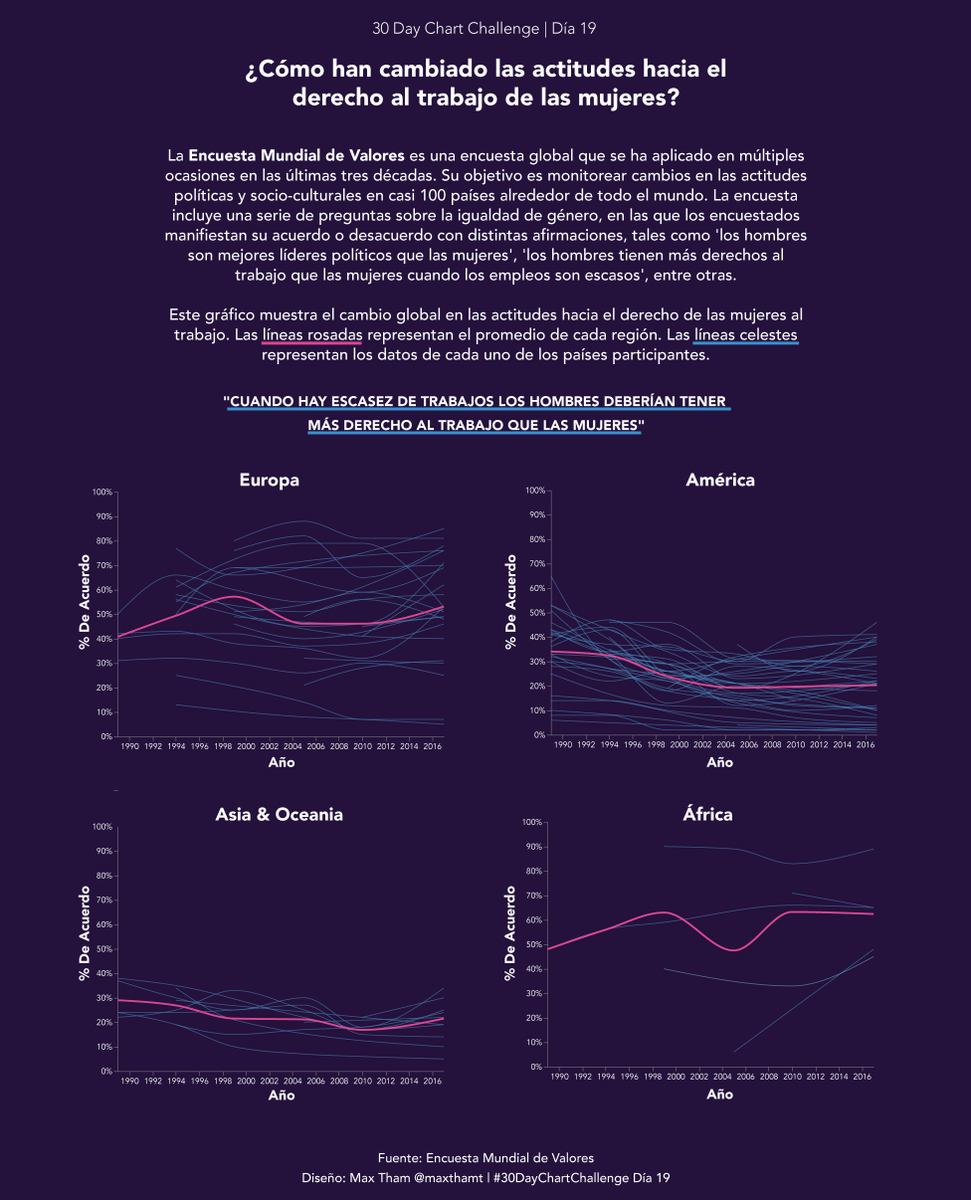
#30DayChartChallenge | Día 19: Cambio global
Visualización interactiva que muestra cómo han cambiado las actitudes hacia el derecho al trabajo de las mujeres en las últimas décadas
Link: https://t.co/RLvj3GjXyw
En @observablehq + @vega_vis
Fuente: Encuesta Mundial de Valores
#30DayChartChallenge | Day 19: Global Change
Interactive #dataviz showing how attitudes towards women's right to employment have changed in the last decades around the world.
https://t.co/SD7S7zAo4W
Tools: @observablehq + @vega_vis
Data Source: World Values Survey
Bueno gente, ¡empecemos a organizar el meetup de D3 @d3js_org en español de Mayo!
¿Quién quiere compartir o enseñarnos algo? Ayúdenme a difundir
https://t.co/MbfmSIB231
#30DayChartChallenge - Día24 series de tiempo/monocromático
Usé los datos del test de Bechdel para mostrar cómo ha evolucionado la representación de las mujeres en las películas durante las últimas décadas
Datos: https://t.co/ubEgO9auHK
#rstats@rawgraphs#illustrator
#30DayChartChallenge - Day24 time_series/monochrome
For day 24 I used the now classic Bechdel test data to show how the representation of women in popular films has evolved in the last decades
Data: FiveThirtyEight https://t.co/ubEgO9auHK
Tools: #rstats@rawgraphs#illustrator
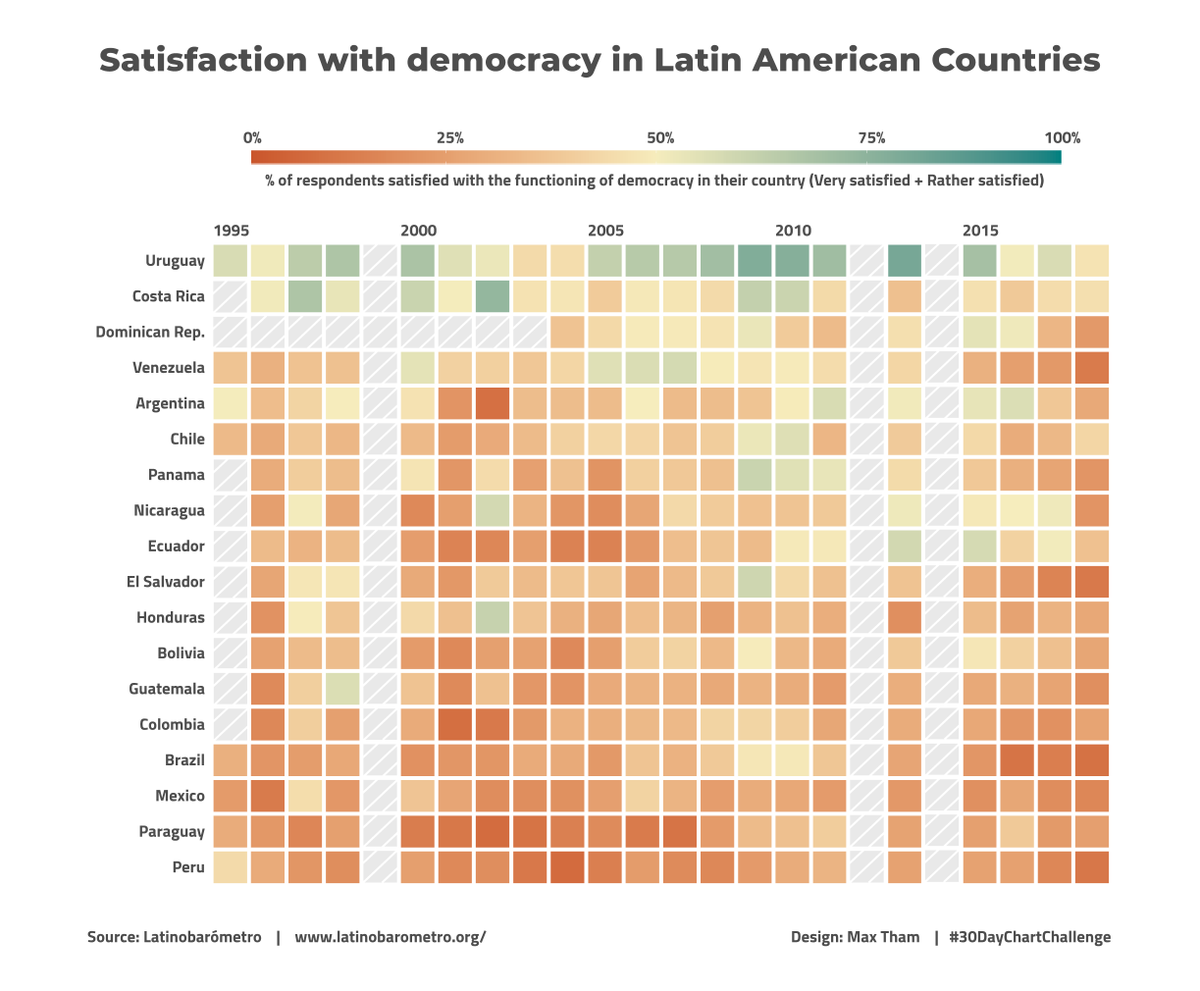
#30DayChartChallenge - Day23 time_series/tiles
In most of Latin America, more than 50% of the people have been dissatisfied with the functioning of democracy (Uruguay was one of the exceptions until 2018)
Data: https://t.co/LHLoLwc6K5
Tools: #rstats#ggplot + #illustrator