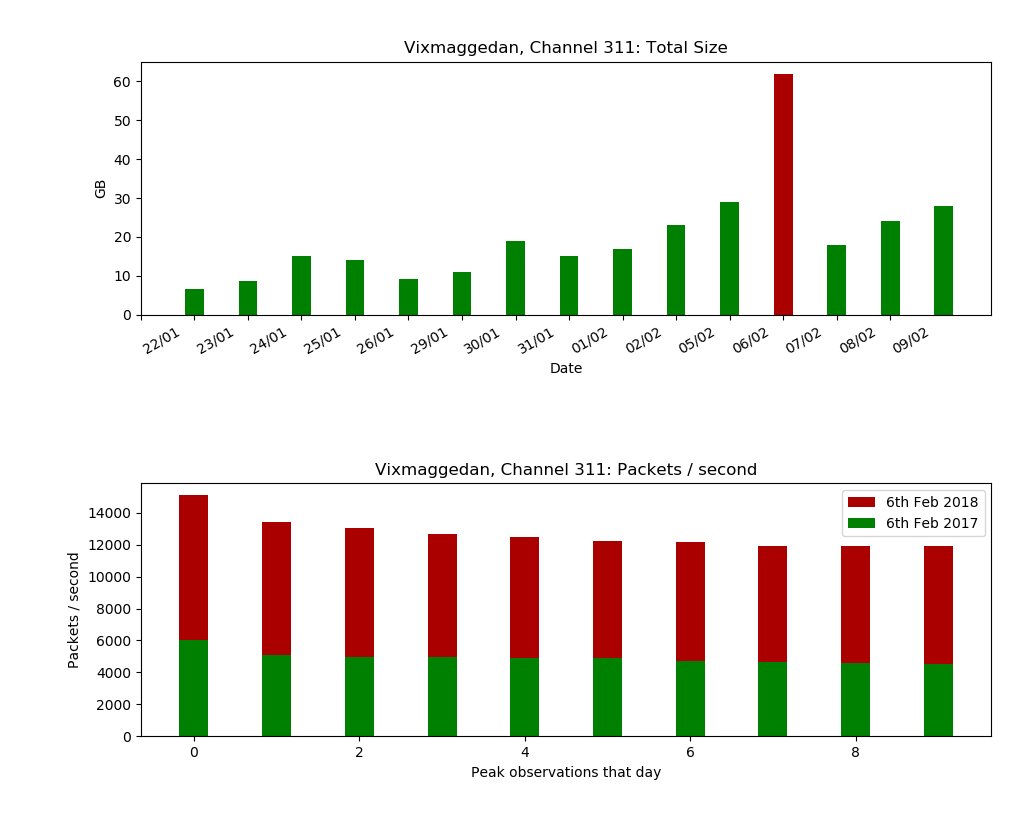
Did you know that the total $CME #data packets on Channel 311 for the 6th of February 2018 was equivalent to the total of the data packets for the entire previous week? Find out more in our latest post: https://t.co/g8uvuhnUCS
Record high #trading and #data volumes: Find out more about the spikes on the 6th February 2018 in our recent blog where we share data from the #Nanotick capture plant: $CME https://t.co/HY0Fm0gCQC
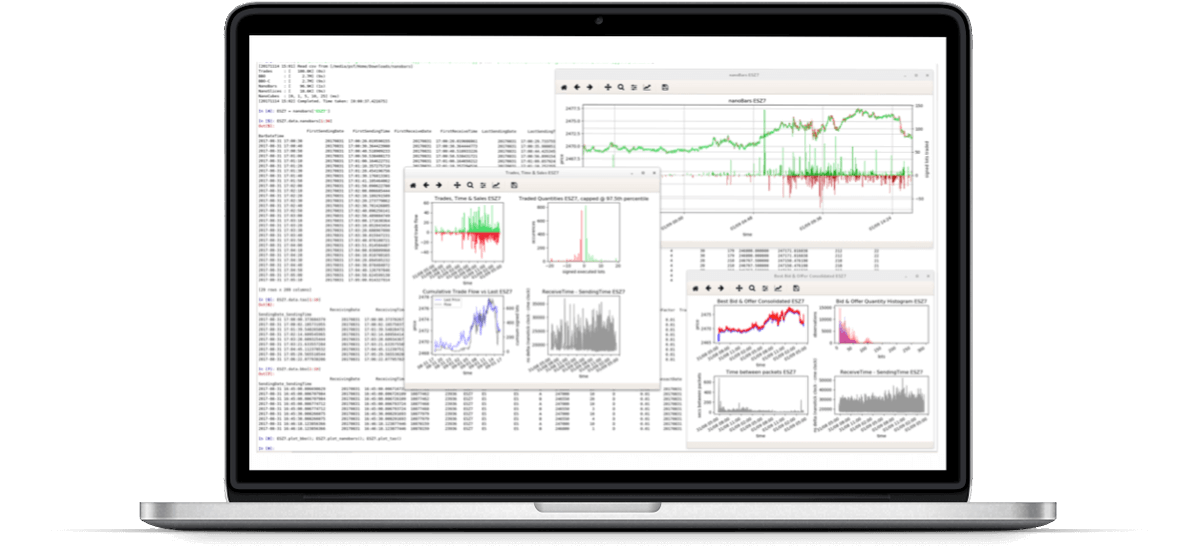
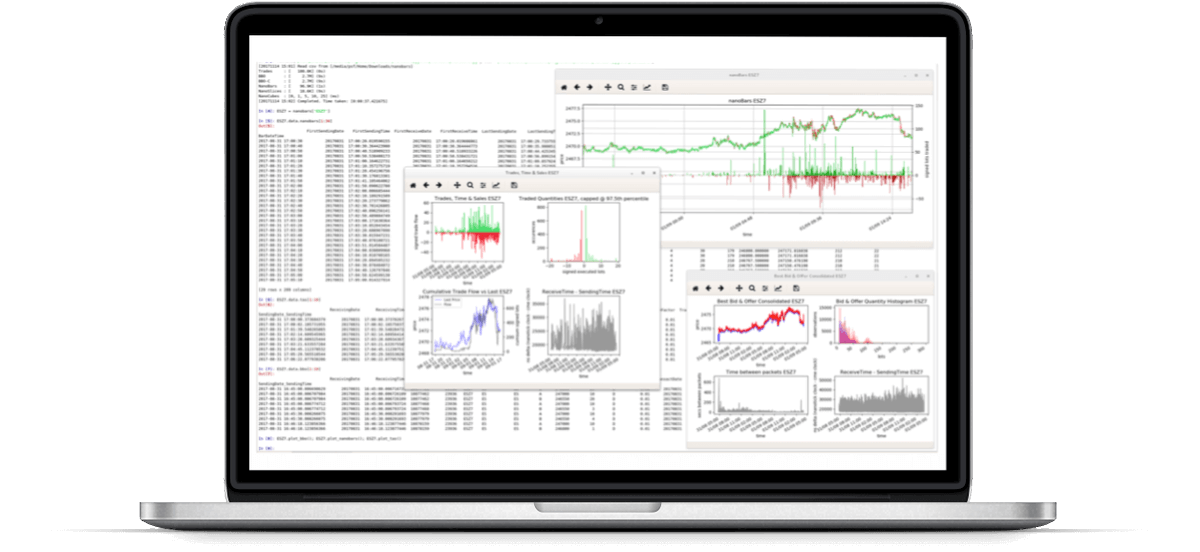
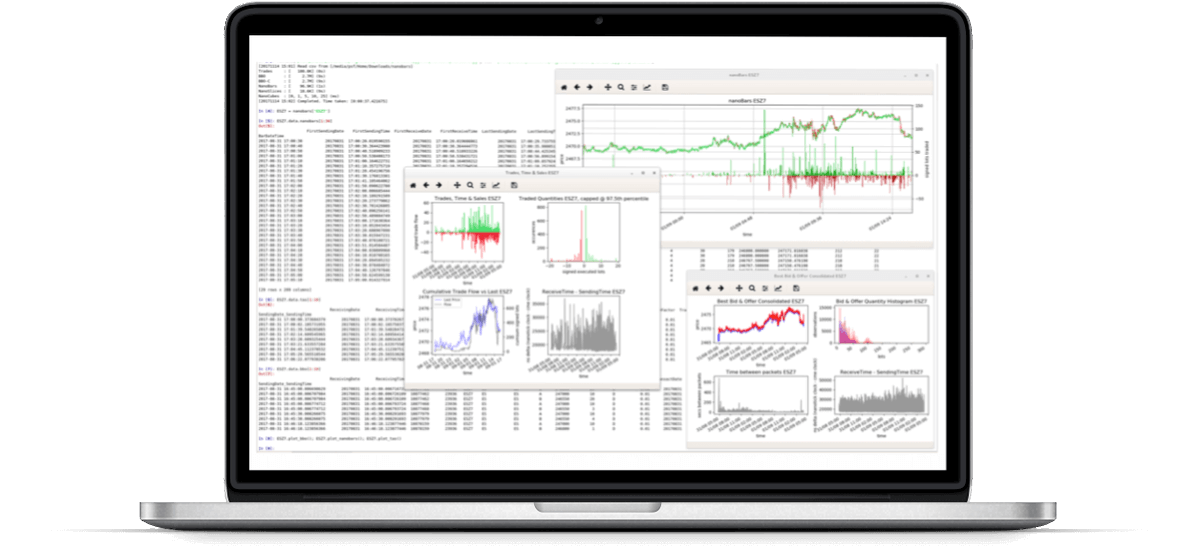
Take a look at our #video post to explore how the advanced features of #nanoBars can be used with XGBoost to deliver an extremely accurate #trading#strategy#backtest: https://t.co/FXy7ZEEeJe
What is the #Cboe#Volatility#Index? $VIX #Options and Futures can help protect agains and capitalize on #volatility to stay ahead of where the market is going. Read more about it here: https://t.co/o1hdVFLSam
Record #data volume spikes on the 6th February 2018: The $CME Group announced a new record high of total open interest of 129.5 million contracts: https://t.co/R95S0IO7Ui
Are you wondering how the gradient boosted decision tree algorithm works? This is just one of the #backtesting challenges our #demo#video on XGBoost #backtests with #nanoBars covers: https://t.co/Vo0mMRhPQQ
Our #video post explores how you can build #XGBoost#Backtests with #nanoBars - take a look to see how using #nanoBars can improve your backtest results: https://t.co/L0RA8QFDZc
Did you know that using volume data from #standard#bars can lead to some poor assumptions about what happened in the market? Our latest post explores how #nanoBars can improve your #trading#strategy#backtest: https://t.co/SKtfQFMwNQ
We examine #standard volume #bars and question if your low quality volume data is damaging your trading strategy backtest. Read our post to see how #nanoBars can help: https://t.co/6Jq2rzU9c7
Take a look at our latest post to see the difference between the naïve #tradeflow you would get from standard #OHLCV#bars and the more precise trade flow available with #nanoBars data: #datastrategy $CME $ES $EUR https://t.co/POcbgFElNU
Strategy and Signal Research with #nanoBars & #Python. Read part three of our series to see how low quality volume #data could be damaging your #tradingstrategy backtest: https://t.co/C1b38bJ9IN
Why you should use #nanoBars with Bookmap for your #datastrategy - the enriched #nanoBar#data enables extensive use of #Bookmap without recourse to the full #MBO tick history: https://t.co/ShNLWh81sm
Visualising #nanoBars with #Bookmap; see how you can benefit from precise market data, enhanced market transparency insights, and deeper price action: https://t.co/7qdGJassYY
Why use #nanoBars with #Bookmap? Read our latest post to find out how discrete #data elements within #nanoBars may be displayed incrementally and added to the total visible data: https://t.co/sabT5r1WJ7