@DHSCgovuk@imperialcollege@IpsosMORI 7 day vaccination rate is reducing. Lots of young people have had 1st dose but having to wait too long for 2nd....reduce period between jabs. Get more double jabbed sooner
This graph is amazing. It shows that measuring #SARSCoV2 levels in municipal sewage almost perfectly predicts forthcoming #COVID19 cases with a full week's notice (R=0.994). It's one of several discoveries in this new study from @Yale: https://t.co/hZVdXebx2D. C-19 is #InThePoop
@DHSCgovuk@CMO_England @PHE_uk @NHSEngland@scotgovhealth @CMOWales @PublicHealthW@healthdpt@publichealthni 👉https://t.co/CoTaRZtPZV👈
The link above is a daily updated graph and table that gives a bigger picture of UK infection rates.
It details,
✅ Confirmed Positive Cases
✅ Daily New Cases
✅ Confirmed Negative Cases
✅ Positive Cases as a % of Tests
✅ Death Rate
✅ ONS Data
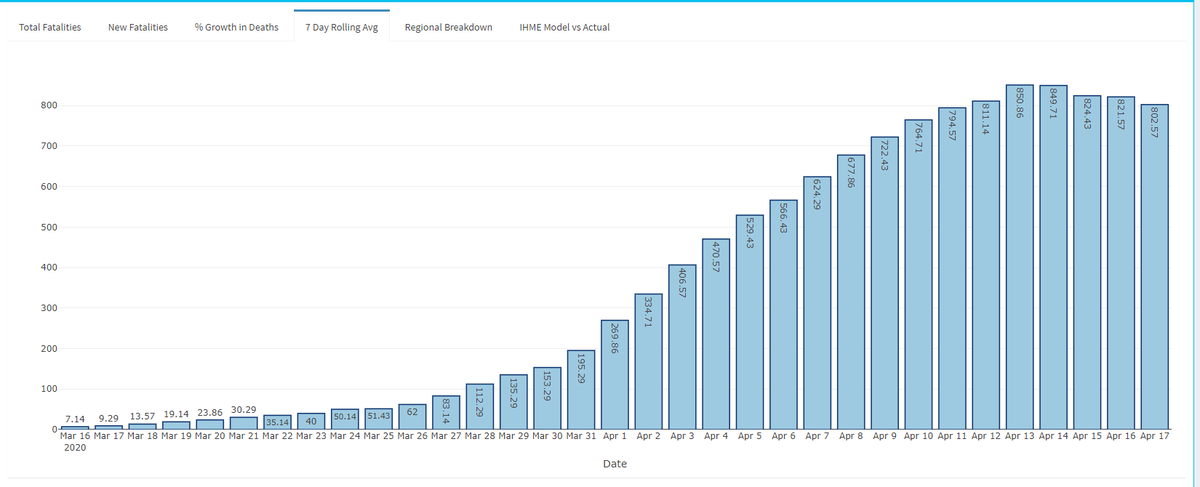
@DHSCgovuk@CMO_England @PHE_uk @NHSEngland@scotgovhealth @CMOWales @PublicHealthW@healthdpt@publichealthni The 7 day rolling fatalities average continues to fall. I think we can safely say that this is a trend and not due to the long bank holiday weekend. We might see an extended plateau or intermittent peaks but the trajectory of fatalities is downwards
As of 9am 17 April, 438,991 tests have concluded, with 21,328 tests on 16 April.
341,551 people have been tested of which 108,692 tested positive.
As of 5pm on 16 April, of those hospitalised in the UK who tested positive for coronavirus, 14,576 have sadly died.
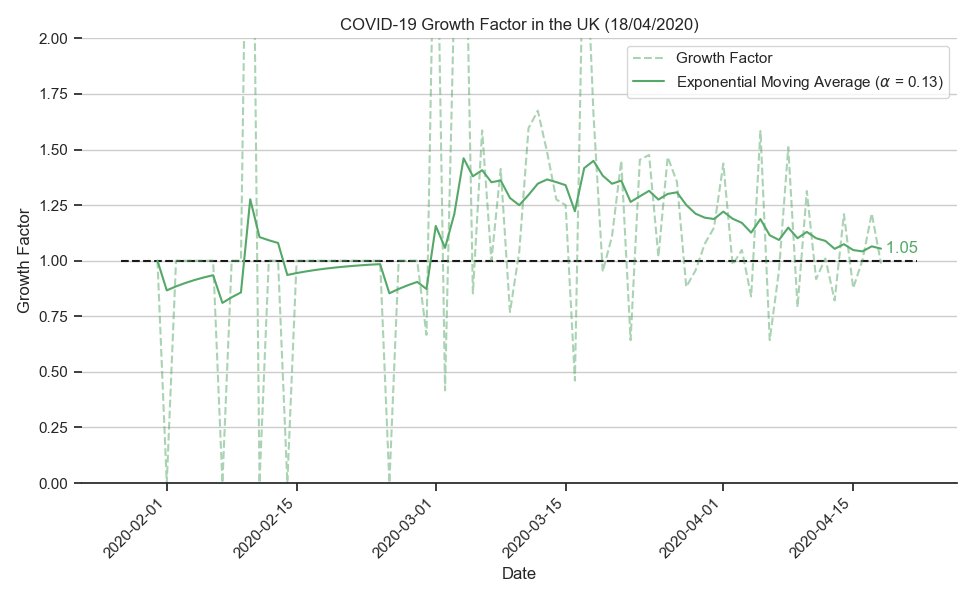
@DHSCgovuk@CMO_England @PHE_uk @NHSEngland@scotgovhealth @CMOWales @PublicHealthW@healthdpt@publichealthni 【17 April】I will voluntarily summarize the update data and make a line chart in real time to better understand the growth trend of the number of infected people.
Check more details in the data dashboard
https://t.co/SQw1mE8N05
108692 were confirmed as positive as of 9am today