I joined @jeffjohnroberts of @FortuneMagazine for a great conversation today @cantorfitzgerld Convergence in Miami.
IonQ builds both leading quantum computers and the quantum security needed to defend against them, and we manufacture it all on U.S. soil. Jeff and I talked about what that means right now, including how AI and quantum are changing the cyber threat, and what quantum readiness means for blockchain and digital assets.
I shared how we think about a layered approach to security, from post-quantum cryptography to quantum key distribution, and why the White House’s recent executive order matters. And we discussed why owning our foundry and a domestic supply chain is so important for scale and national security.
Thanks to Jeff and Cantor for the conversation:
https://t.co/fptG0ngTeK
#IonQ #QuantumComputing #QuantumSecurity #CantorConvergence
$IONQ #NQI#CUSP
2026년 11월 10일 공개된 Commission on U.S. Quantum Primacy (CUSP)의 19페이지 예비 보고서 Defining the American Quantum Era를 확인했다.
보고서의 핵심은 다음과 같다.
미국은 양자 기술을 연구하고 개발하는 데 강하지만, 그것을 대량 생산하고 실제 국가 경쟁력으로 전환하는 과정에서는 중국에 뒤처질 위험이 있다. 따라서 미국은 연구 지원을 넘어 제조시설, 소프트웨어, 공급망, 상용화까지 국가 차원에서 지원해야 한다.
119대 의회 종료가 50일 정도 남은 시점에서 이 예비 보고서는 그 의미가 크다고 하겠다.
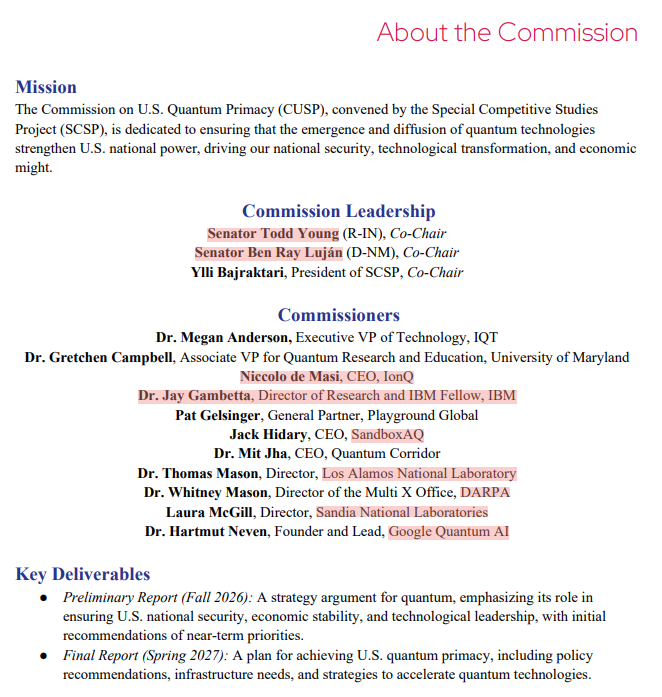
이 보고서에는
CUSP 의장으로 Todd Young , Ben Raj Lujan 상원의원이 NQI 재승인법 대표 발의자 중 한명이,
Niccolo de Masi IonQ CEO, Jay Gambetta IBM Research Director와 각 연구소 대표들이 위원으로 활동중이다.
NQI 입법 현황은 다음과 같다.
2026년 1월 8일NQI 재승인법 S.3597 발의
2026년 3월 5일CUSP 공식 출범. 국가 양자 전략 수립을 목표로 활동 시작
2026년 4월 14일S.3597 상원 상무위원회 만장일치 통과
2026년 11월 10일CUSP 예비 보고서 발표
2027년 1월 3일제119대 의회 종료. 미처리 법안은 폐기되므로, 재발의 필요
https://t.co/ynMMgaF9ck
https://t.co/k9FdXU6diU
$IONQ PriorTilt란?
https://t.co/oxRta4KT6v
의견이 팽팽히 맞서거나 서로 모순되어 결론을 쉽게 내리지 못한다면, 모든 증거를 처음부터 다시 조사하는 대신 다른 각도로 가정을 한 후 새롭게 접근하는 방법이다.
다만 PriorTilt는 반드시 올바른 답으로 이끄는 방법은 아니다. 작은 가정 변경으로 추론이 다시 진행될 가능성을 높이는 알고리즘이다.
그래서 이름이 사전에 가정을 살짝 기울인다는 의미에서 PriorTilt이다.
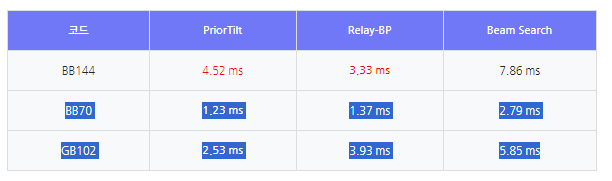
최대 610배 향상이라고 하지만, 기본적인 BP 알고리즘을 기준으로 평가하는 것은 큰 의미가 없어 보인다.
작년 12월에 소개되었던 BeamSearch에 비해 논리 오류율이 3.12배 좋아졌다.
그리고, WalkingCat에 적용예정인 BB70과 GB102에서 BeamSearch대비 속도도 향상되었다.
FTQC를 향해 한발씩 내딧는 모습이 멋지다.
JUST IN: A BIPARTISAN COMMISSION JUST WARNED CHINA COULD OUT-BUILD AMERICA IN QUANTUM
The Commission on U.S. Quantum Primacy released its first report yesterday. It’s co-chaired by a Republican and a Democratic senator, with members from IBM, Google, IonQ, DARPA, Los Alamos and Sandia.
Its finding: the US leads today, in research and in working quantum computers.
But China’s edge in supply chains and manufacturing could let it scale quantum faster than America can.
America invents it, China builds it. The commission is warning that pattern could repeat.
What it wants:
A national program to build quantum hardware and software together, modeled on the project that built America’s fastest supercomputers.
A National Quantum Foundry Access Program, so US companies can actually manufacture.
Faster migration to quantum-proof encryption across critical infrastructure.
An allied quantum market, so partners buy from each other and not from China.
Senator Todd Young put it this way: discoveries “only matter if they reach the field, the factory, and the warfighter.”
The final report, with full policy recommendations, lands in spring 2027.
$INFQ $IONQ $QNT $QBTS
"빅테크가 AI로 돈을 못 번다고요?"
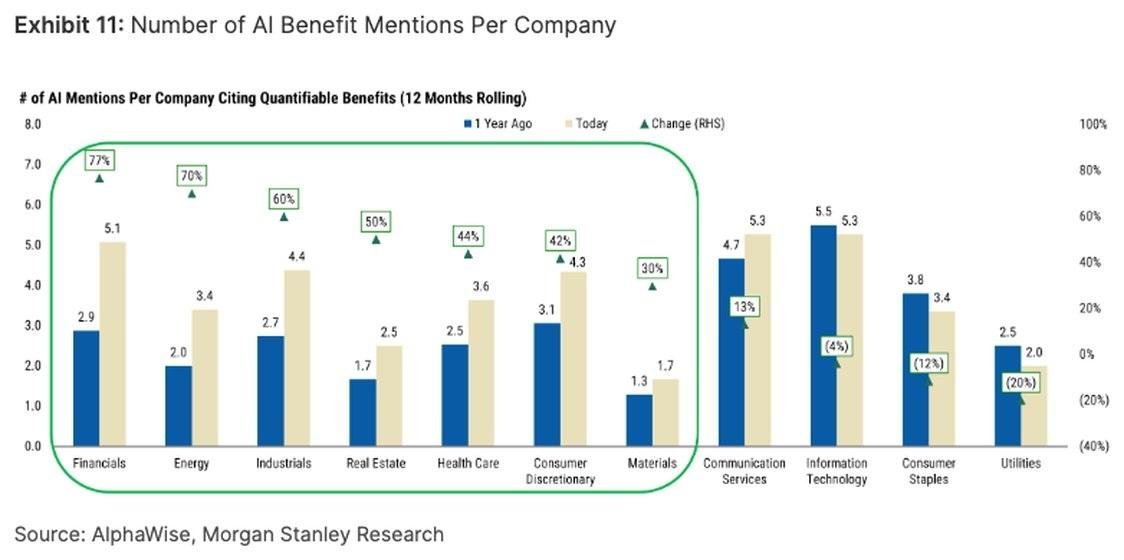
질문이 틀렸습니다. 모건스탠리의 실사 데이터가 그 답을 보여줍니다.
차트 제목:
각 기업이 실적발표 등에서 수치화 가능한 실질적 AI 혜택(비용 절감, 생산성, 수익 창출)을 언급한 횟수 변화.
1. 테크 기업의 정체(-4%)와 레거시 산업의 대폭발(+77%)
차트 오른쪽 IT/테크 기업들의 실질 AI 수혜 언급은 1년 전 5.5회에서 현재 5.3회로 오히려 4% 줄었습니다. 테크 기업들은 이미 도입 단계를 지나 천문학적인 CapEx 집행에 집중하고 있기 때문입니다.
반면 차트 왼쪽의 녹색 박스, 즉 전통 굴뚝 산업과 금융의 수치는 말 그대로 폭증했습니다.
2. 누가 AI로 진짜 돈을 벌고 있는가?
- 금융(Financials): +77% 폭증 (2.9 ➔ 5.1)
- 에너지(Energy): +70% 폭증 (2.0 ➔ 3.4)
- 산업재/제조(Industrials): +60% 폭증 (2.7 ➔ 4.4)
- 부동산(Real Estate): +50% 폭증
- 헬스케어(Health Care): +44% 폭증
- 경기소비재(Retail): +42% 폭증
은행은 신용평가와 사기 탐지 자동화로 인건비를 줄이고, 에너지 기업은 시추·전력망 효율화로 마진을 남기며, 제조업은 스마트팩토리 검품 자동화로 수율을 끌어올리고 있습니다.
3. AI의 본질: '테크 섹터의 유행'에서 '전 산업의 OPM 개선 치트키'로
시장은 "오픈AI나 마이크로소프트가 AI 소프트웨어 단품을 팔아서 얼마를 남기는가"만 쳐다보며 ROI를 의심합니다.
하지만 진짜 거대한 부가가치는 소프트웨어를 사다 쓴 전 세계 90%의 비(非)테크 기업들이 영업이익률(OPM)을 구조적으로 개선하는 과정에서 폭발하고 있습니다.
결론:
소비자용 챗봇의 신기함은 끝났을지 몰라도, 전통 산업 현장의 비용을 깎아주는 엔터프라이즈 AI는 이제 막 골든크로스를 지나 실적으로 증명되기 시작했습니다.
#모건스탠리 #AI투자 #ROI #실물경제 #스마트팩토리 #금융AI #기업분석
$IONQ
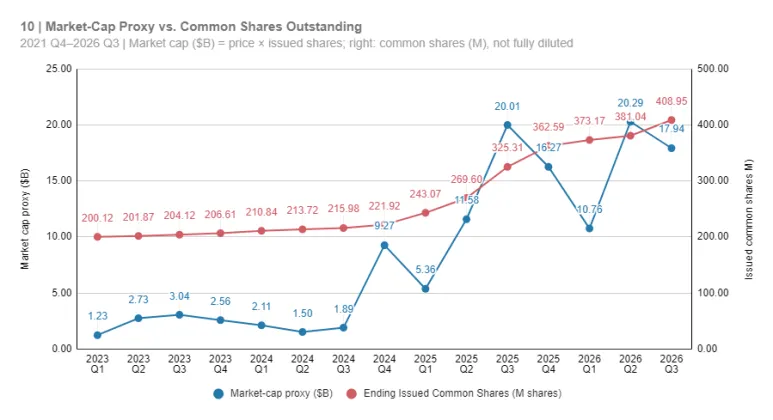
10. Estimated Market Capitalisation vs. Shares Outstanding — Market Value Can Move Differently from the Share Price
Estimated market capitalisation is calculated as quarter-end share price multiplied by common shares outstanding at the same date. It increased from approximately $1.23 billion in Q1 2023 to $17.94 billion in Q3 2026 — about 14.6 times.
But compared with Q3 2025, the estimated market cap declined from about $20.01 billion to $17.94 billion. Outstanding common shares rose from 325.31 million to 408.95 million over the same period, but the share-price decline was proportionally larger.
The reason a stock-price change and market-cap change can differ is that the number of outstanding shares is not fixed. Looking only at the share price can therefore give a misleading picture of how the market’s valuation of the whole company has changed.
This is, however, only an estimated market capitalisation that excludes potential dilution. It differs from a fully diluted valuation that considers common shares issued after the October 2026 financing, pre-funded warrants, other warrants and unvested RSUs.
The approximately $17.94 billion figure combines the share price and shares outstanding as of September 30, 2026. It should not be described as IonQ’s real-time market capitalisation in November.
$IONQ
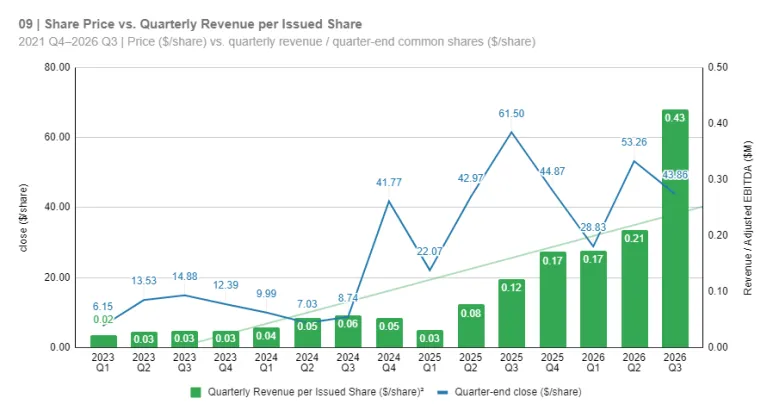
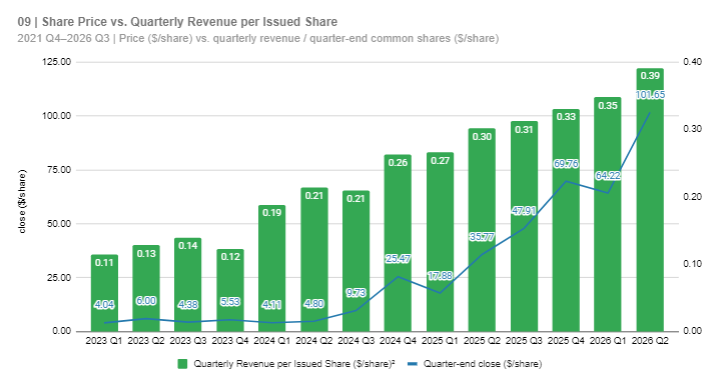
09. Share Price vs. Revenue per Share — When Do Business Performance and Stock Price Move Together?
Between Q3 2025 and Q3 2026, quarterly revenue per issued share rose from $0.1225 to $0.4251, or approximately 3.47 times. Yet the quarter-end share price declined from $61.50 to $43.86, or roughly 28.7%.
This divergence raises questions about how investors value the quality of future growth, margins, financing needs and potential dilution relative to historical revenue. However, the chart alone cannot identify one definitive cause of the stock-price decline.
Crucially, the closing price at the end of a quarter is formed before that quarter’s earnings are released. Pairing subsequently reported results with the earlier quarter-end price is a retrospective comparison, not an analysis of the market’s immediate reaction to those earnings.
Higher revenue per share is a starting point for valuation, not proof of undervaluation. Reaching that conclusion requires consideration of trailing-twelve-month revenue multiples, the profitability outlook and potential fully diluted share counts.
$IONQ
09. Share Price vs. Revenue per Share — When Do Business Performance and Stock Price Move Together?
Between Q3 2025 and Q3 2026, quarterly revenue per issued share rose from $0.1225 to $0.4251, or approximately 3.47 times. Yet the quarter-end share price declined from $61.50 to $43.86, or roughly 28.7%.
This divergence raises questions about how investors value the quality of future growth, margins, financing needs and potential dilution relative to historical revenue. However, the chart alone cannot identify one definitive cause of the stock-price decline.
Crucially, the closing price at the end of a quarter is formed before that quarter’s earnings are released. Pairing subsequently reported results with the earlier quarter-end price is a retrospective comparison, not an analysis of the market’s immediate reaction to those earnings.
Higher revenue per share is a starting point for valuation, not proof of undervaluation. Reaching that conclusion requires consideration of trailing-twelve-month revenue multiples, the profitability outlook and potential fully diluted share counts.
$IONQ
08. RPO and Contract Liabilities — Is There a Foundation for Continued Revenue Growth?
Remaining performance obligations (RPO) represent the portion of a contract’s transaction price allocated to obligations that have not yet been fulfilled. RPO increased from $485 million in Q2 2026 to $1,168 million in Q3 2026 — approximately 2.41 times.
Compared with $141.1 million in Q3 2025, RPO was approximately 8.28 times higher. However, this does not mean that the entire balance came from new orders for quantum computers. The contract pipeline consolidated through the SkyWater acquisition also matters.
Deferred revenue and contract liabilities rose from approximately $87.01 million in Q2 2026 to $241.81 million in Q3 2026. These balances relate to consideration received or due for performance obligations for which revenue recognition has not yet occurred.
RPO and contract liabilities should not simply be added together. Their definitions and recognition rules differ, and some contract liabilities may be included in RPO.
The company disclosed that it expected to recognise about 50% of Q3 2026 ending RPO as revenue within the following 12 months. However, RPO can include committed orders that are subject to unappropriated funding. The forecast should therefore not be treated as a guaranteed amount of future revenue.
$IONQ
08. RPO and Contract Liabilities — Is There a Foundation for Continued Revenue Growth?
Remaining performance obligations (RPO) represent the portion of a contract’s transaction price allocated to obligations that have not yet been fulfilled. RPO increased from $485 million in Q2 2026 to $1,168 million in Q3 2026 — approximately 2.41 times.
Compared with $141.1 million in Q3 2025, RPO was approximately 8.28 times higher. However, this does not mean that the entire balance came from new orders for quantum computers. The contract pipeline consolidated through the SkyWater acquisition also matters.
Deferred revenue and contract liabilities rose from approximately $87.01 million in Q2 2026 to $241.81 million in Q3 2026. These balances relate to consideration received or due for performance obligations for which revenue recognition has not yet occurred.
RPO and contract liabilities should not simply be added together. Their definitions and recognition rules differ, and some contract liabilities may be included in RPO.
The company disclosed that it expected to recognise about 50% of Q3 2026 ending RPO as revenue within the following 12 months. However, RPO can include committed orders that are subject to unappropriated funding. The forecast should therefore not be treated as a guaranteed amount of future revenue.
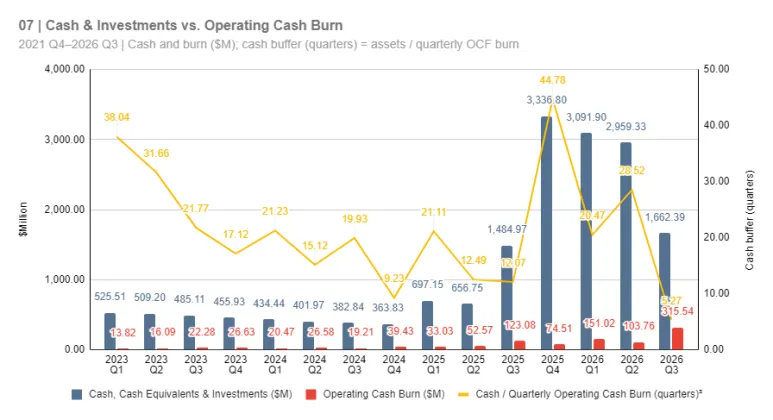
07. Cash, Investments and Cash Buffer — How Long Could the Current Spending Pace Be Sustained?
IonQ’s cash, cash equivalents and investments fell from approximately $3.34 billion at the end of 2025 to $1.66 billion at the end of Q3 2026. The balance was $2.96 billion at the end of Q2 2026, implying a decline of roughly $1.30 billion during one quarter.
According to the Form 10-Q, a major driver of the Q3 cash decline was approximately $1.06 billion in cash paid in connection with the SkyWater acquisition. This is separate from operating cash outflow; it would be incorrect to assume that the company consumed that entire amount because revenue fell short of operating expenses.
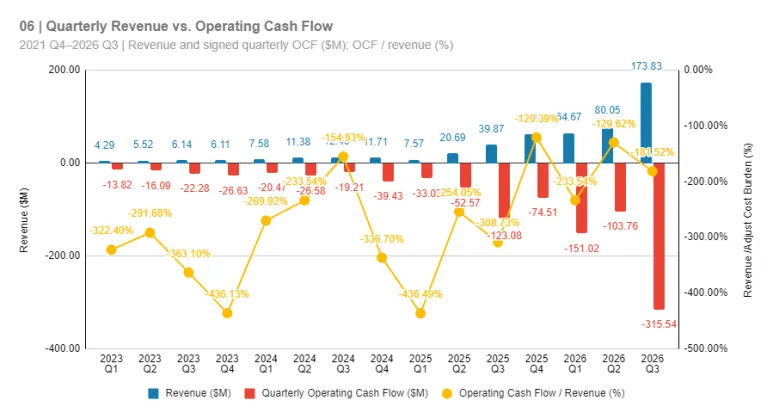
The chart’s cash buffer of 5.27 quarters is simply quarter-end cash and investments of $1,662.39 million divided by that quarter’s OCF outflow of $315.54 million. At a hypothetically constant pace, it works out to about 1.3 years — but it is not a forecast of the company’s actual remaining runway.
A significant subsequent event is that IonQ completed a roughly $1.99 billion equity offering in October 2026. Including that financing, the company described pro forma quarter-end cash of approximately $3.7 billion. This must not be confused with the actual balance of about $1.7 billion on September 30.
The financing strengthened liquidity, but the new shares issued and future cash consumption must be considered together.
#GoldenDome#SHIELD
2번째 리스트에 올라온 업체 명단입니다. 이들은 전부 $IONQ 와 MOU를 맺고 있습니다.
참고로
SEED는 1차명단에,
Vector Atomic과 Capella Space는 2차 명단에,
IONQ과 Skyloom은 3차 명단에 올라와 있습니다.
828 6XAD7SEED INNOVATIONS, LLC
272 81U56VECTOR ATOMIC INC
388 7R0F9CAPELLA SPACE CORP
87 7XLB8IONQ, INC.
93 8KV11SKYLOOM GLOBAL CORP.
#GoldenDome#SHIELD
2번째 리스트에 올라온 업체 명단입니다. 이들은 전부 $IONQ 와 MOU를 맺고 있습니다.
참고로
SEED는 1차명단에,
Vector Atomic과 Capella Space는 2차 명단에,
IONQ과 Skyloom은 3차 명단에 올라와 있습니다.
828 6XAD7SEED INNOVATIONS, LLC
272 81U56VECTOR ATOMIC INC
388 7R0F9CAPELLA SPACE CORP
87 7XLB8IONQ, INC.
93 8KV11SKYLOOM GLOBAL CORP.
07. Cash, Investments and Cash Buffer — How Long Could the Current Spending Pace Be Sustained?
IonQ’s cash, cash equivalents and investments fell from approximately $3.34 billion at the end of 2025 to $1.66 billion at the end of Q3 2026. The balance was $2.96 billion at the end of Q2 2026, implying a decline of roughly $1.30 billion during one quarter.
According to the Form 10-Q, a major driver of the Q3 cash decline was approximately $1.06 billion in cash paid in connection with the SkyWater acquisition. This is separate from operating cash outflow; it would be incorrect to assume that the company consumed that entire amount because revenue fell short of operating expenses.
The chart’s cash buffer of 5.27 quarters is simply quarter-end cash and investments of $1,662.39 million divided by that quarter’s OCF outflow of $315.54 million. At a hypothetically constant pace, it works out to about 1.3 years — but it is not a forecast of the company’s actual remaining runway.
A significant subsequent event is that IonQ completed a roughly $1.99 billion equity offering in October 2026. Including that financing, the company described pro forma quarter-end cash of approximately $3.7 billion. This must not be confused with the actual balance of about $1.7 billion on September 30.
The financing strengthened liquidity, but the new shares issued and future cash consumption must be considered together.
$IONQ
06. Quarterly Revenue and Operating Cash Flow — Is Improved Loss Efficiency Showing Up in Cash?
Operating cash flow (OCF) is useful for assessing the cash generated or consumed by operating activities, rather than looking only at accounting losses. IonQ reported $173.83 million in Q3 2026 revenue, but quarterly OCF was −$315.54 million.
That operating cash outflow was approximately 2.56 times the $123.08 million outflow in Q3 2025. At the same time, OCF as a percentage of revenue improved from −308.7% to −181.5%. The absolute amount deteriorated, while the revenue-relative ratio improved.
I discussed the comparison between revenue growth and adjusted cost growth in Is IonQ’s Revenue Growth Outpacing Its Costs?. The additional question here is when operating cash flow will begin to improve on a sustained basis. Acquisition payments and capital expenditure may be recorded in investing cash flows rather than OCF, so they should be distinguished from the movement in total cash.
$RKLB
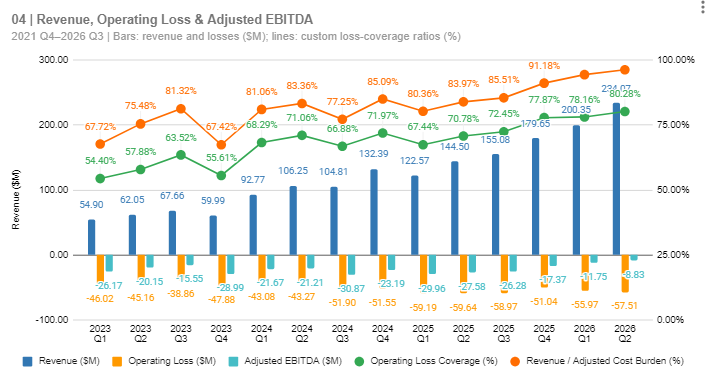
내일 아침 실적발표입니다.
2026 Q2 / Q3 가이던스
Revenue : 234.1 / 250~265
GAAP Gross Margin : 36.1% / 29~31%
GAAP Operating Loss : -57.5 / -60.9~76.5
Adj EBITDA : -8.8 / -17~-23
Adj Loss Coverage : 96.36% / 91.6~94.0%
Rocket Lab은 이미 Q3 매출은 증가하지만, 수익성은 Q2보다 악화될 것으로 예상하고 있습니다.
따라서 Q3 Adjusted EBITDA가 -$20M으로 발표된다고 해서 그 자체로 실적 악화 충격이라고 볼 수는 없습니다. 이미 회사가 예고한 범위의 중간값이기 때문이죠.
반대로 매출이 $265M을 넘고 Adjusted EBITDA 손실도 $17M보다 작다면, 시장이 기대하는 영업레버리지가 예상보다 빠르게 나타난다는 강력한 신호입니다.
주당 매출은 Q2 에 $0.39였는데, 3분기에는 주식수가 4.9% 증가 할것으로 생각되는 만큼 위에서 언급한 매출 가이던스가 핵심일 것 같습니다.
$IONQ
06. Quarterly Revenue and Operating Cash Flow — Is Improved Loss Efficiency Showing Up in Cash?
Operating cash flow (OCF) is useful for assessing the cash generated or consumed by operating activities, rather than looking only at accounting losses. IonQ reported $173.83 million in Q3 2026 revenue, but quarterly OCF was −$315.54 million.
That operating cash outflow was approximately 2.56 times the $123.08 million outflow in Q3 2025. At the same time, OCF as a percentage of revenue improved from −308.7% to −181.5%. The absolute amount deteriorated, while the revenue-relative ratio improved.
I discussed the comparison between revenue growth and adjusted cost growth in Is IonQ’s Revenue Growth Outpacing Its Costs?. The additional question here is when operating cash flow will begin to improve on a sustained basis. Acquisition payments and capital expenditure may be recorded in investing cash flows rather than OCF, so they should be distinguished from the movement in total cash.
$IONQ
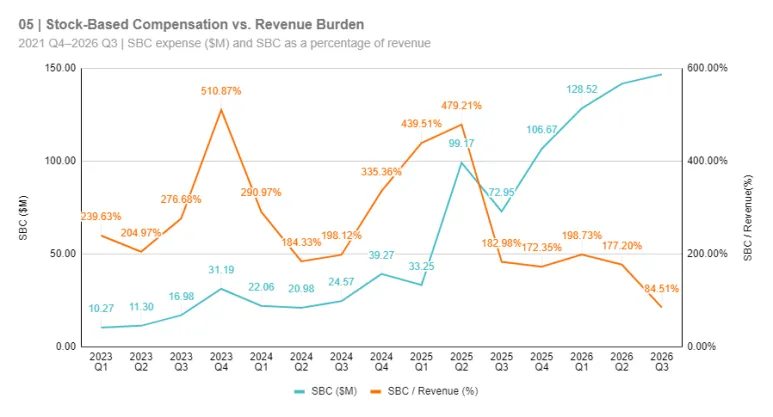
05. Stock-Based Compensation (SBC) — Shareholder Costs Persist as Revenue Grows
Stock-based compensation (SBC) increased from $72.95 million in Q3 2025 to $146.91 million in Q3 2026, roughly doubling. The absolute expense burden did not decline.
Nevertheless, SBC as a percentage of revenue fell from 183.0% to 84.5%, largely because the revenue denominator grew so rapidly. But 84.5% is still a very substantial proportion.
SBC is a non-cash accounting expense, but it may create a real economic dilution burden for existing shareholders. The expense-recognition date and the date of actual share issuance are not necessarily the same, so SBC expense cannot be matched one-for-one with the quarter’s increase in outstanding shares.
SBC is already included in GAAP expenses and should not be added to the GAAP operating loss a second time. The purpose of this chart is not merely to describe the losses, but to examine how the compensation structure behind growth affects existing shareholders’ ownership stakes.
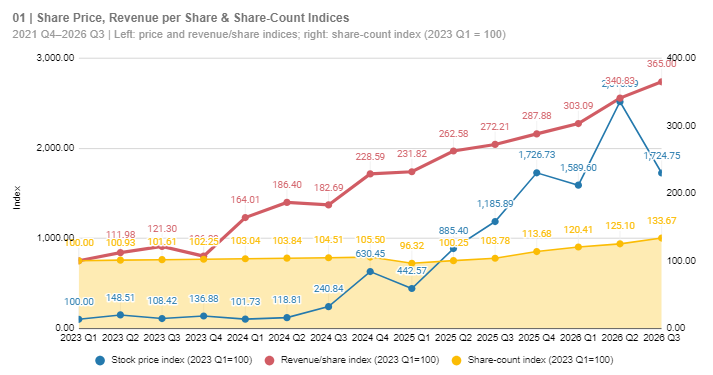
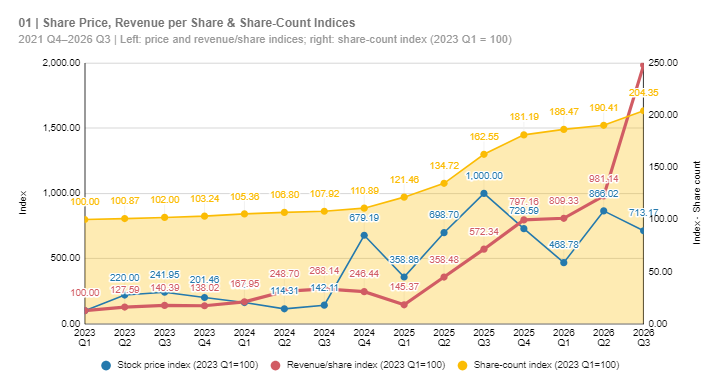
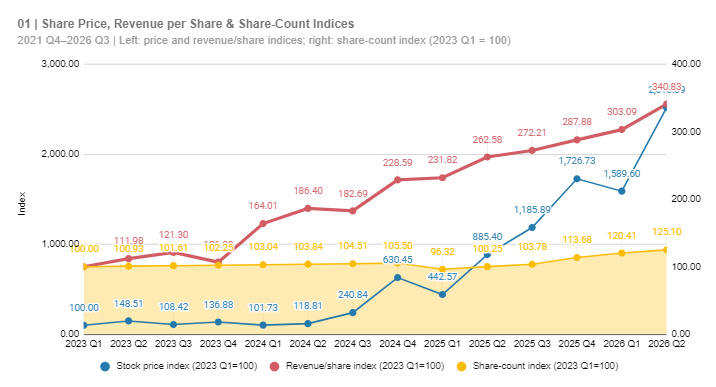
$IONQ 를 분석한 김에 많이들 투자하는 $RKLB 와 같이 비교를 해보겠습니다.
Disclaimer : 아래 내용은 개인적으로 가장 많이 투자하는 두 종목을 세가지 재무지표만을 가지고, 상대적으로 비교하는 것일 뿐 전체 분석도 아니고, 절대적인 분석이 아님을 미리 밝힙니다.
나란히 비교하기 위해서 정렬을 해보겠습니다.
기준 시점: 2023년 Q1 = 100
비교 지표:
1.주가 지수
2.주당매출 지수
3.발행주식 수 지수
2023년 Q1부터 2026년 Q2까지 비교입니다. RKLB는 아직 Q3 발표전이기 때문입니다.
즉, 2023년 1분기 대비 주가가 어느정도 상승했는지, 주당 매출은 얼마나 늘었는지, 주식 발행은 얼마나 더 했는지를 보는 것입니다.
IONQ
주가: 8.66배
주당매출: 9.81배
주식 수: 1.90배
RKLB
주가: 25.16배
주당매출: 3.41배
주식 수: 1.25배
일단, 주식수는 IONQ가 훨씬 많이 늘었습니다. 노란색 영역 차트만 봐도 한눈에 알 수 있습니다.
하지만, 주당 매출은 IONQ가 RKLB에 비해 약 3배 정도 성장했습니다.
즉, 희석을 감안하고도 매출의 질적 성장은 IONQ가 더 강했다고 볼 수 있습니다.
그런데 주가 상승은 RKLB가 훨씬 더 컸습니다.
IONQ: +766.0%
RKLB: +2,416.1%
RKLB는 실적 개선보다 밸류에이션 확장이 훨씬 크게 작용했고,
IONQ는 밸류에이션보다 주당 실적 성장의 기여가 더 컸다고 해석할 수 있습니다.
그럼 주가지수를 주당 매출지수로 나눠보겠습니다.
주당매출 대비 시장이 얼마나 더 비싸게 평가하고 있는가를 보기 위함입니다.
2026년 Q2 기준
IONQ: 866.02 / 981.14 = 0.88
RKLB: 2516.09 / 340.83 =7.38
해석은 이렇습니다.
IonQ: 주당매출 성장 속도 대비 주가 상승은 오히려 덜했다.
RKLB: 주당매출 성장 대비 주가는 훨씬 더 많이 올랐다.
즉, 상대적으로 보면
IONQ는 실적이 주가를 끌고 갔고,
RKLB는 기대감이 주가를 훨씬 더 끌어올렸다고 볼 수 있습니다.
(써놓고 보니까 이상하네요) IONQ는 주가가 $80정도까지 올랐지만, 아직 이렇다할 퍼포먼스가 나지 않는 상황에서 매크로 악재가 겹치면서 많이 눌린 상태구요, RKLB도 역시 매크로에 많이 눌리긴 했지만, 일렉트론 발사의 꾸준한 성공과 여러 계약 수주를 통해 상대적인 안정감을 보이는 모습이라고 표현하는 것이 더 맞겠네요.
투자자 입장에서 해석해보면,
IONQ는 주식 희석이 크고, 현금 소진도 많고, 수익성은 아직 멀지만, 희석을 감안해도 주당매출 성장률이 매우 높습니다.
한마디로, 사업은 아직 거칠지만, 주가 대비 성장성은 더 매력적으로 보일 수 있다고 말할 수 있습니다.
RKLB는 주식희석이 덜하고, 매출 규모가 상대적으로 크며, 수익성과 현금흐름 구조가 훨씬 낫지만, 주당매출 성장률보다 주가가 너무 많이 앞서갔습니다.
한마디로, 기업의 질은 RKLB가 더 안정적이지만, 주가 측면에서는 (상대적으로) 더 비싸게 거래됐다고 볼수도 있습니다.
처음에 밝힌 바와 같이 이 글은 세가지 재무지표로 단순 비교라서, 기술적인 로드맵 등 성장주로서 평가해야 할 중요한 내용이 빠져있으니, 이 점 다시 한번 유의하시길 바랍니다.
$RKLB
내일 아침 실적발표입니다.
2026 Q2 / Q3 가이던스
Revenue : 234.1 / 250~265
GAAP Gross Margin : 36.1% / 29~31%
GAAP Operating Loss : -57.5 / -60.9~76.5
Adj EBITDA : -8.8 / -17~-23
Adj Loss Coverage : 96.36% / 91.6~94.0%
Rocket Lab은 이미 Q3 매출은 증가하지만, 수익성은 Q2보다 악화될 것으로 예상하고 있습니다.
따라서 Q3 Adjusted EBITDA가 -$20M으로 발표된다고 해서 그 자체로 실적 악화 충격이라고 볼 수는 없습니다. 이미 회사가 예고한 범위의 중간값이기 때문이죠.
반대로 매출이 $265M을 넘고 Adjusted EBITDA 손실도 $17M보다 작다면, 시장이 기대하는 영업레버리지가 예상보다 빠르게 나타난다는 강력한 신호입니다.
주당 매출은 Q2 에 $0.39였는데, 3분기에는 주식수가 4.9% 증가 할것으로 생각되는 만큼 위에서 언급한 매출 가이던스가 핵심일 것 같습니다.