🚨The US Dollar remains the world's dominant currency:
Banks outside the US are holding a record ~$14.5 trillion in US Dollar deposits and loans, according to BIS data.
This figure has risen by over +$4 trillion since 2010.
By comparison, banks outside the Eurozone hold just ~$3.5 trillion in Euro-denominated assets, less than 25% of the Dollar equivalent, while the British Pound and Japanese Yen remain negligible at well under $1 trillion each.
This means the global financial system runs on US Dollars far beyond America's own borders, with banks worldwide borrowing, lending, and conducting business in Dollars that never pass through the United States.
The diversification from the Dollar is real, but a complete collapse is far away.
🧵 In 1995, tech companies started borrowing to build.
By 1999, Nasdaq had risen 400% 📈
Today in 2026:
• Google raises $85B (largest equity deal in history)
• Meta considering tens of billions more
• SpaceX, OpenAI, Anthropic: $3.6T in IPOs queued up
The leverage cycle just kicked into overdrive. 🚀
(The 90s Parallel)
Here’s what happened last time capital flooded in:
📅 1995–1997: VCs + debt funded the network buildout
📈 S&P 500: +37.6%, +23%, +33% those 3 years
📅 1998–1999: Tech & telcos issued junk bonds
📈 Nasdaq TRIPLED from autumn 1998 → March 2000 peak
Capital availability = the fuel.
Fast forward to 2026:
💰 Global tech issued $428B in bonds in 2025 alone — record high
💰 The Big 4 hyperscalers will spend $725 B+ in capex this year
💰 That’s 94% of their operating cash flow
→ They’ve had to turn to equity AND bond markets
This is the leverage cycle going parabolic.
In the 90s, companies had no revenues and borrowed to survive.
Today: GOOG generates $170B operating cash flow/yr and STILL raised $85B
META generates $115B operating cash flow/yr and may raise more.
This isn’t desperation capital. This is acceleration capital. 🏎️
What it means for stocks??
The 1995–2000 run lasted 5 full years after the leverage cycle started.
We may be in year 2 or 3 of this AI capex supercycle.
The stocks levered to this buildout:
$CRWV $NBIS $MRVL $ALAB $LITE $VRT $CRDO $AAOI $NET $DRAM
Stay long.
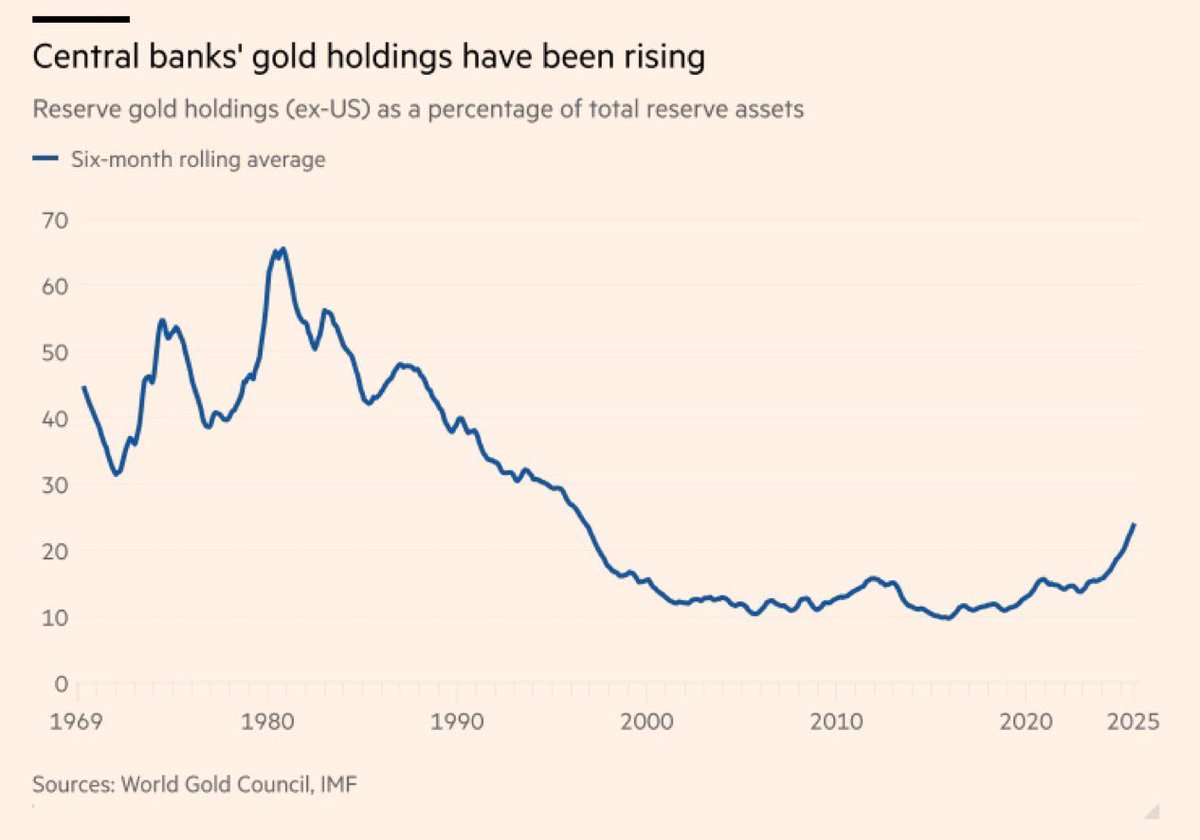
After Poland's Deputy Prime Minister reposted this chart, it made the rounds in Poland. Many members of parliament reposted it, highlighting the great job of the current government.
Literally nobody addressed my main question about the unsustainable fiscal deficit & demographics
Every Cargo Has Its Own Ship🚢🌍
Global trade does not move on one kind of vessel.
It moves through a specialized fleet.
Bulk carriers move coal, grain, and minerals.
Oil tankers move crude and refined products.
LNG ships move gas at extreme cold temperatures.
Container ships move manufactured goods.
RoRo ships move cars and trucks.
Heavy-lift vessels move oversized equipment.
That is the hidden architecture of globalization.
Energy, food, minerals, vehicles, chemicals, and infrastructure all depend on the right ship showing up at the right port.
Shipping is not just transport.
It is the operating system of global trade.
Guardare questo video mi riporta alla mente la mia infanzia in Iran.
Subito dopo la rivoluzione, il nuovo regime ha evitato di opprimere eccessivamente la popolazione, temendo una controrivoluzione immediata.
Tuttavia, l'inizio della guerra con l'Iraq di Saddam Hussein è diventato il pretesto perfetto per proclamare lo stato di emergenza, eliminare l'opposizione interna e imporre un potere assoluto.
Quel momento ha segnato l'inizio della dittatura.
Alle scuole medie è stata introdotta la segregazione di genere: ho condiviso la classe con le mie compagne solo per un anno, prima che ci separassero. Ricordo che ogni mattina, a prescindere dal freddo o dal caldo, eravamo costretti a radunarci all'aperto per ascoltare versetti del Corano che non comprendevamo, e subito dopo dovevamo intonare slogan come "Morte all'America" e "Morte a Israele".
Il controllo sui corpi e sull'abbigliamento era totale. Non potevo portare i capelli lunghi; ogni mattina un supervisore ci ispezionava uno per uno, trattandoci con la stessa durezza che si vede nel video. Erano vietati i capi firmati, i colori accesi e le camicie a maniche corte.
Vedere bambini di 6 o 7 anni puniti e cacciati da scuola per ragioni simili era la normalità all'interno di quella che era, a tutti gli effetti, una dittatura islamo-comunista.
#iran #dictatorship #communism
La bufala del Genocidio spiegata bene.
Mentre Zula e gli stercorari propal ogni giorno raccontano di cecchini che ammazzano bimbi a mazzi, qui si vede un branco di cuccioli di ciabattati giocare alla lapidazione.
Il soldato “stranamente” non li abbatte.
Even the US with 51% design and 68% EDA cannot make a chip without Japanese equipment, Korean materials and Taiwanese capacity. There is no chip autarky.
US Equity Markets have NOT topped.
Though, more downside is likely to come before we head higher into the Final Market Top.
So NOT ringing the BELL yet 🔔
BUT - the situation is very different in Markets around the World.
Below the Hang Seng. The top is in! And it will head MUCH lower.
Soon - the mantra will be: "The US will pull rest of the World out of the slump".
It will not be the case - however it will create the ROTATION from RoW into US assets in the final push higher in US Risk Assets - incl. Crypto!
Wait for it!
🇮🇷 Fars News reported an explosion heard near Khark Island.
Tasnim News just said the sounds are caused by the detonation of unexploded ordnance.
Keeping you updated if more info comes out
🚨 Yesterday I wrote that all four historic market risks – inflation, liquidity, tech, credit – are simultaneously present for the first time in 50 years.
Today let's zoom out further. Way out.
This chart shows 225 years of US stock prices, inflation-adjusted. It reveals something most modern investors have never seen, because the data simply isn't long enough in our living memory.
Roughly every 60 years, the market completes a full secular cycle:
– 1802 → 1857: 50-year rise, ended with US secession war and 5 years down
– 1857 → 1920: 63-year cycle, ended with WWI, post-war inflation and 11 years down
– 1920 → 1981: 61-year cycle, ended with oil shocks, Vietnam, stagflation and 13 years down
– 1981 → ?: the current cycle
If the pattern holds, the next secular top arrives around 2028. Followed by a 10-15 year inflation-driven drawdown that bottoms somewhere between 2039 and 2043.
The recipe is always the same
Each secular ending has three ingredients:
1. Persistent inflation
2. Geopolitical conflict (war, deglobalization, empire transition)
3. A speculative melt-up in the dominant sector of the era
The 1850s had railroads.
The 1910s had electrification and trusts.
The 1970s had the Nifty Fifty.
The 2020s have AI.
We're already two of three in 2026. Inflation has returned. Deglobalization is accelerating. The AI melt-up is the missing piece, and it's underway.
Why this matters
The playbook that worked from 1981 to today was defined by one regime: falling rates, globalization, passive flows, US tech dominance.
That regime ends with every 60-year cycle. Historically, the next decade rewards a completely different set of assets.
What worked in the cycle just ending:
– Long-duration growth
– Passive index investing
– US large-cap concentration
– Tech
What has worked through every secular transition since 1800:
– Cash-flowing businesses with pricing power
– Real assets and infrastructure
– Defensive, durable, boring
– Active stock selection
The uncomfortable part
Every cycle felt unique to the people living through it.
The 1920s investor was certain the new technologies of his age were different from the railroads of 1857.
The 1968 investor was certain stagflation couldn't happen in the modern economy.
They were all wrong in the same way.
If we're somewhere near the top of cycle four, the quality stocks being mocked today aren't dead money.
They're early.
🚨 Follow the ‘Godfather of AI’ 📈
Jensen is quietly building a strategic Berkshire of AI companies — $18.37B invested across 6 companies.
FABs. Optics. Neoclouds. EDA. AI-RAN. Jensen isn’t buying stocks. He’s buying control points.
🔥 Here’s what he’s buying and why the 1-year returns are insane 👇
∙$INTC +422% over the past year
∙$NBIS +529% over the past year
∙$COHR, $LITE +400% over the past year
∙$NOK +157% in 2026 YTD alone, +45% in 2025 (TTM +300%+)
∙$CRWV -1.6% over past year (IPO’d March 2025, YTD +53%)
∙$SNPS +2.5% over the past year
This isn’t a portfolio. It’s a supply chain.
🔵 $INTC → domestic FAB access = TSMC hedge
⚪ $CRWV + $NBIS → captive GPU demand loop
🔷 $COHR, $LITE → owns the optics bottleneck at 100K+ GPU scale
🟣 $SNPS → lock-in via CUDA-accelerated chip design
🟢 $NOK → AI-RAN = GPU into every 5G tower