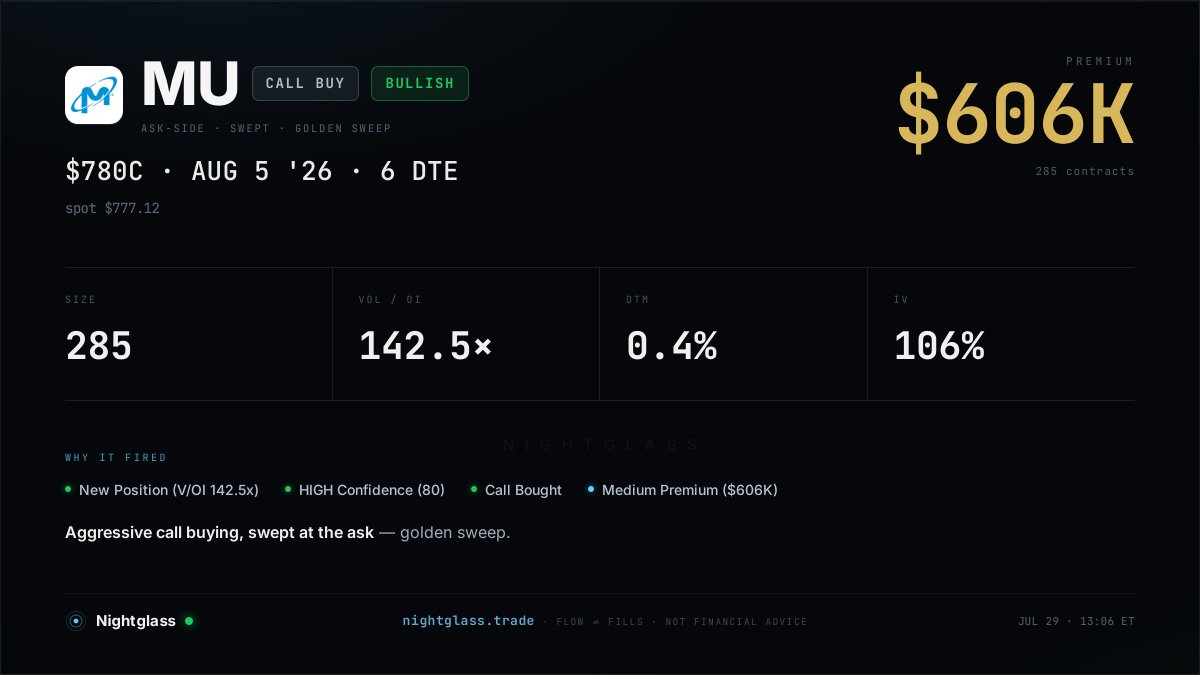
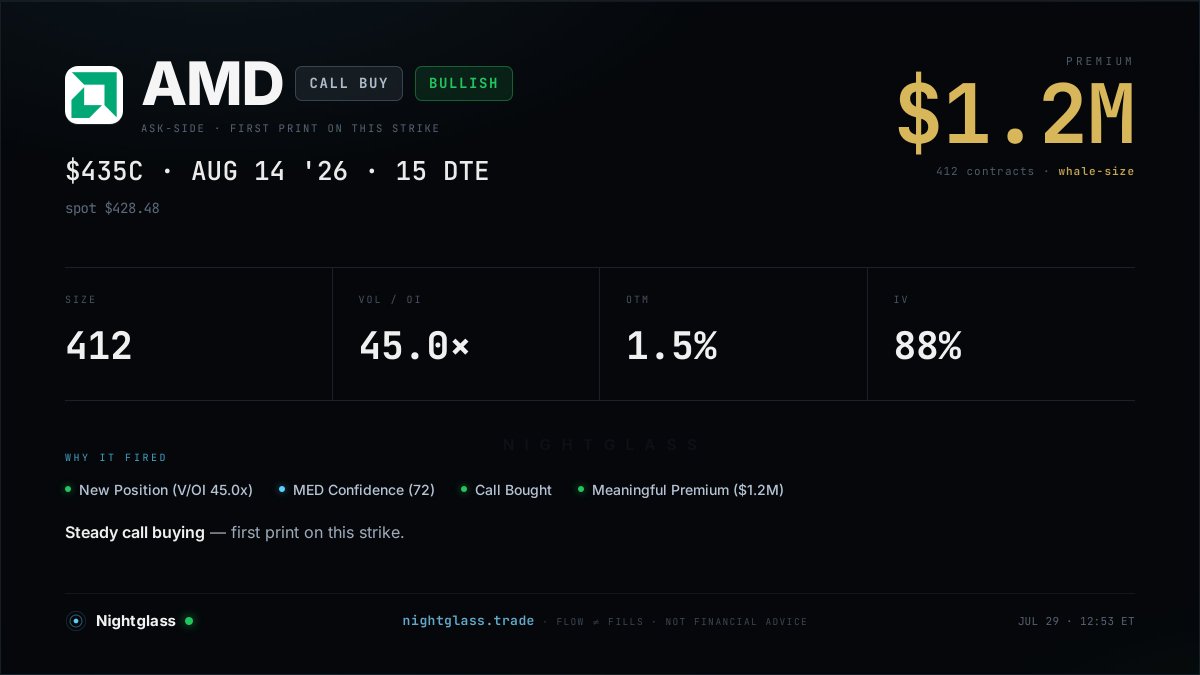
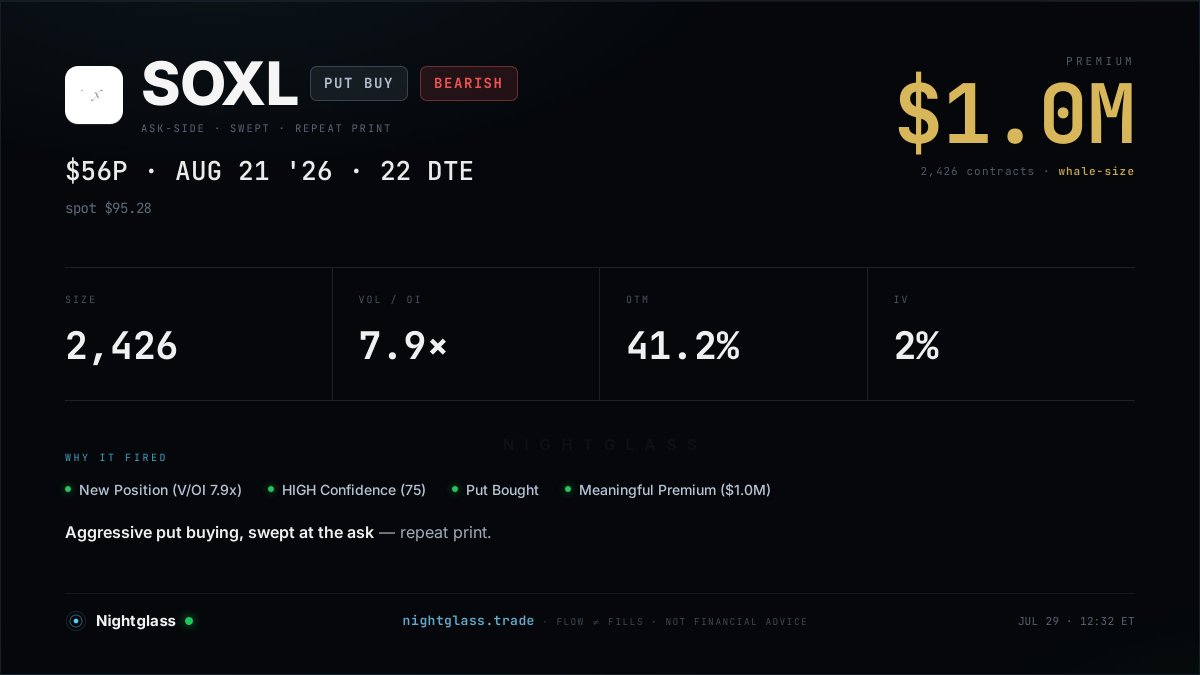
You heard options flow can help your trading gain an edge, but you're still not confident in how to read it.
Good news for you: we built a free academy for exactly that — written by a former BlackRock analyst.
9 modules that take you from "how to read a trade" to reading direction, conviction, and multi-leg structures on your own. Quizzes, practice trades, final exam.
No email. No paywall. https://t.co/ddTGc99XsB
98% of options flow is noise.
And even when it’s not, most traders don’t know how to read it.
You see $SNDK calls sold and assume it’s bearish.
You see $SNDK calls bought and assume it’s bullish.
But most of those prints aren’t standalone bets — they’re legs in a much larger structure.
Take this $SNDK ladder:
Calls sold at 1020
Calls bought at 1030
Calls sold again at 1080
If you only see one leg, you completely miss the actual risk profile: defined premium risk, a pin-risk valley at 1030, and a capped profit plateau starting at 1080.
This is the power of Nightglass.
We built proprietary models that reconstruct structured trades from raw tape in real time — so you see the whole position, not isolated noise.
No one else gives you this level of structural insight on live flow.
Want access?
Join the Nightglass waitlist and be the first to know when we open to the public.
Someone told me @nightglasstrade “shows too many calls and not enough puts.”
That’s exactly what should happen when you stop treating every put print as a bearish signal.
Most of the put flow is hedging, rolling, or risk‑management noise — not smart money shorting the underlying. If you don’t model that correctly, your “bearish flow” feed just turns into a wall of false positives.
To pull real bearish signals out of the noise, you have to go way beyond simple put‑call ratios. That means:
Tracking Greeks and delta profiles so you know which strikes actually move the underlying. ATM / high‑delta puts behave very differently from far OTM crash insurance.
Using contract‑level exchange data to see whether size is opening vs closing, sweeps vs blocks, bid vs ask aggression, and how the trades are routed.
Layering in proprietary datasets around open interest, skew/IV changes, and dealer positioning so you can separate protective hedges from directional shorts.
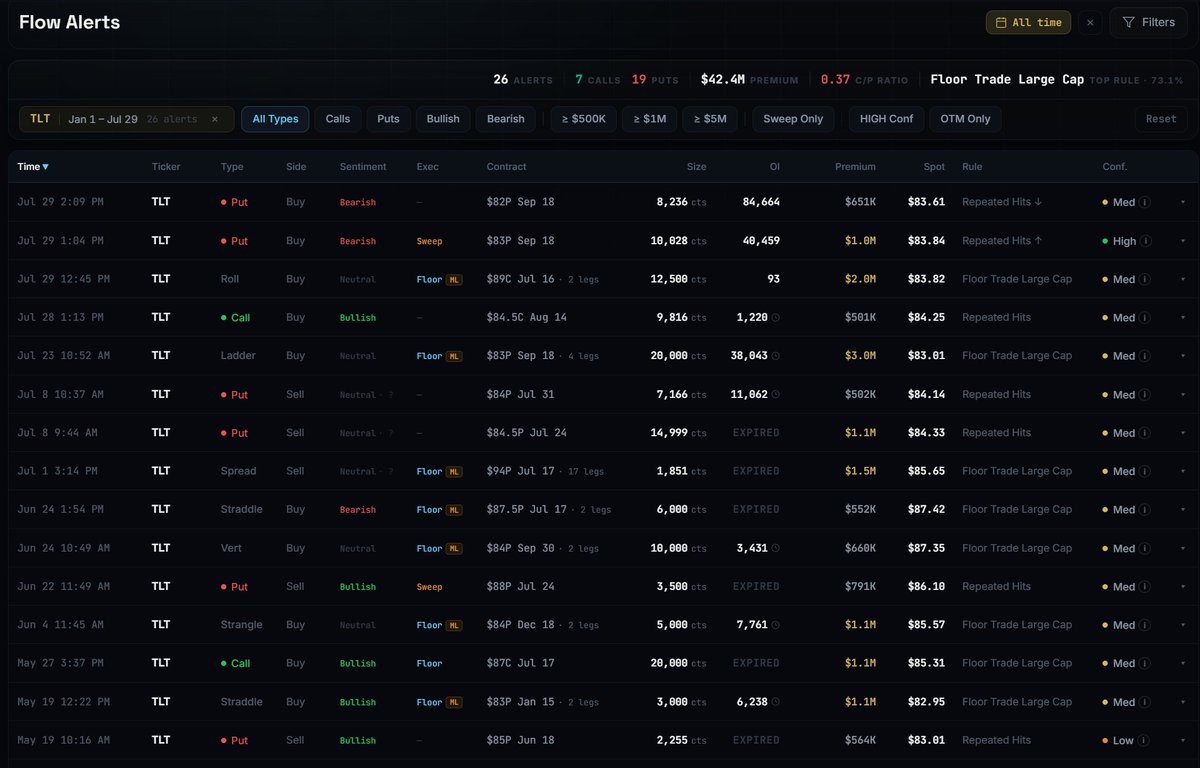
Here’s a clean example of why Nightglass looks “call heavy” if you only glance at the tape:
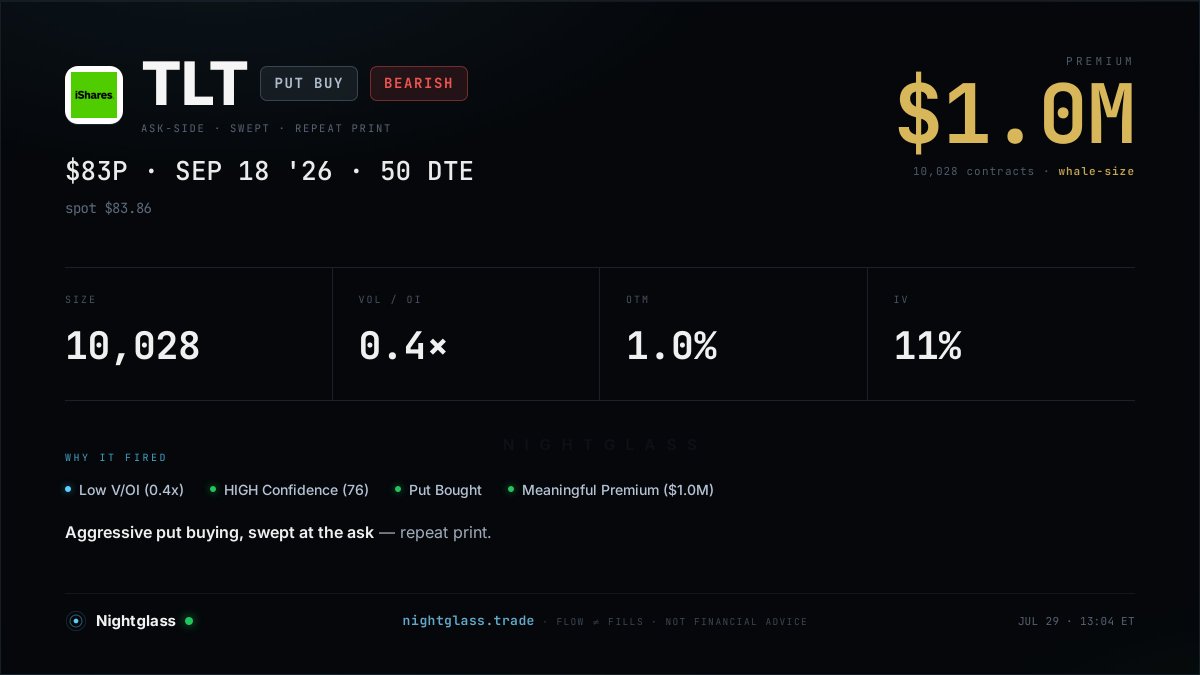
Nightglass high quality filters showed bull flow at the May lows, and flipped to bearish flow today into the FOMC window, when the tape shifted from hedge removal to fresh downside positioning and duration risk was back in focus.
So if you see fewer puts than you expect, it’s not because the system “missed” bearish trades.
It’s because the platform is refusing to call every insurance policy a short, and only promoting the flows that actually matter for price.