I trade liquidity, risk and positioning.
Not opinions.
I’ve seen what euphoria does.
I’ve seen what panic does.
Capital survives when ego doesn’t.
If you want noise, scroll.
If you want to understand how markets actually move, stay.
—
Opero liquidez, risco e posicionamento.
Não opiniões.
Já vi o que a euforia faz.
Já vi o que o pânico faz.
Capital sobrevive quando o ego não.
Se quer barulho, pode passar.
Se quer entender como o mercado realmente se move, fica.
🚨ARE WE GOING LOWER? THE CHART HAS ANSWERED THIS TWICE ALREADY.
May 2025: Extreme Fear, $74K floor. Recovery to $108K.
January 2026: Extreme Fear, $74K floor. Recovery to $91K.
Today: Fear at 42, $78K. Still above the floor. Sentiment not even at Extreme Fear.
The pattern on this chart is consistent. Extreme Fear near $74K has been the buy signal twice. We are currently $4K above that level with a less extreme sentiment reading.
Going lower from here means breaking a level that held through two Extreme Fear episodes. That is a high bar. Nothing in the current sentiment structure is screaming that the floor gives way.
The index has not reached Extreme Fear. Price has not broken $74K. Neither condition for a new low has been met.
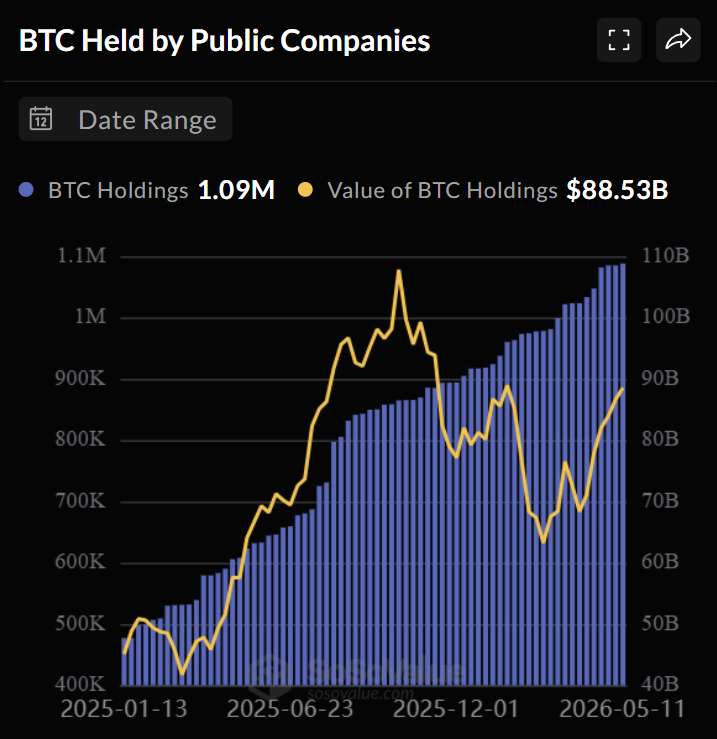
🚨THE CHART THAT EXPLAINS WHY THIS CYCLE IS STRUCTURALLY DIFFERENT.
400K to 1.09M BTC held by public companies in 16 months. Nearly a 3x in coin accumulation while price went sideways to down through most of that period.
Notice what happened during the Nov 2025 price peak: dollar value spiked to $110B but coin count kept rising. Companies were not selling into the ATH. They were still buying.
That behavior does not exist in retail. That is a treasury mandate. A balance sheet decision. A multi-year horizon.
690,000 BTC absorbed by corporate balance sheets and effectively removed from circulation. The float just got structurally smaller. Price discovery from here happens on reduced supply.
🚨THE MOST DANGEROUS MOMENT IN CRYPTO IS NOT WHEN THE MARKET DROPS. IT'S WHEN IT LOOKS LIKE IT WILL AND DOESN'T.
April 2025. $74K. Glassnode flagging max capitulation. Timelines full of $40K targets.
Nobody wanted to buy. Everyone was waiting for the next leg down.
The market didn't cooperate.
$74K to $110K with no comfortable re-entry for anyone who stood aside waiting for a collapse that never came.
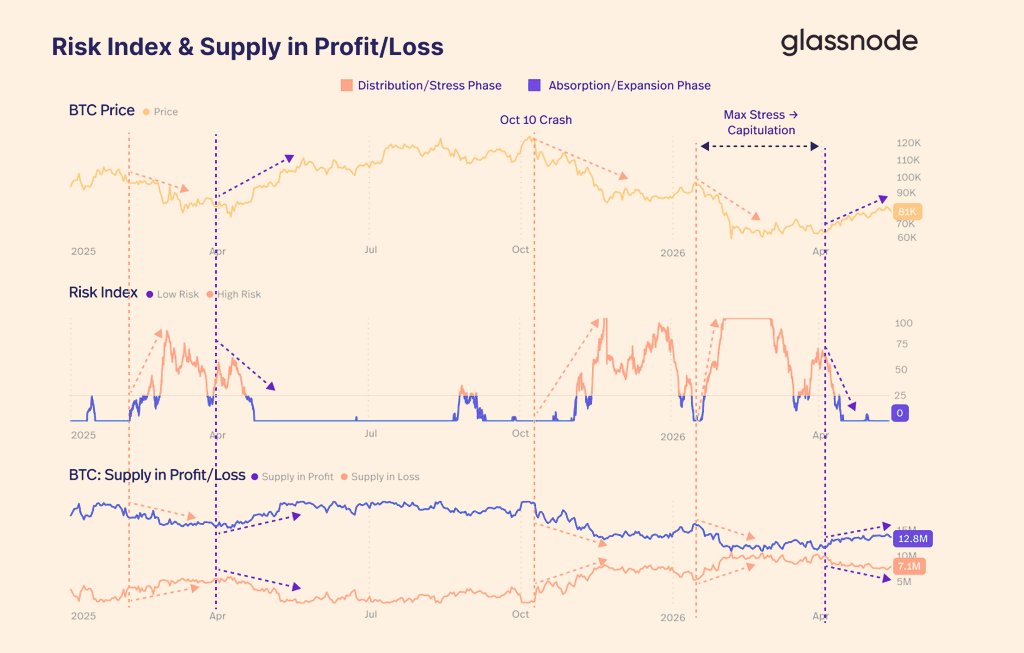
Risk Index is back at zero. The fear narrative is back. The setup is back.
Same question as always: do you wait for confirmation or do you act when the data shows up?
@0xReflection The part most are skipping: 7.1M BTC in loss is elevated but not panic-level. April 2025 bottom had a worse ratio and still flipped. What matters is the direction of that number, not the absolute value. Loss supply peaked and is now contracting. That is the signal.
🚨 RISK INDEX JUST RESET TO ZERO. THIS IS THE SETUP MOST PEOPLE WILL MISS.
Glassnode's Risk Index is sitting at 0 after the Max Stress/Capitulation window. Last time this happened was April 2025, right before the Absorption phase ripped price from ~$75K to $110K.
Supply in Loss is now 7.1M BTC. Supply in Profit still 12.8M.
That ratio is not distribution territory. That is a market absorbing pain, not one imploding under it.
Every Distribution/Stress Phase on this chart resolved with expansion.
Every single one.
Price is ~$91K. Risk is floored. Loss supply is elevated but not extreme. The market just handed you the same setup it handed you 12 months ago.
@CryptoMichNL@MNFund_ Bear market performance is the only résumé that matters in this industry. Anyone can post returns from Nov 2024 to Jan 2025.
+8% while BTC dropped 25% and ARB dropped 60% is a real number. That's not alpha, that's a different game entirely.
People see 0/30 and think "must be early." The more important read is the distribution of progress scores.
Some indicators are at 10-20%. Others are already at 70-90%. That divergence tells you the cycle is maturing unevenly. Dominance at 92.4% progress. LTH supply at 83.5%. Those two don't look early.
Everyone waiting for dominance to break 60% as the altseason signal is watching the wrong trigger.
The real signal is whether dominance holds 60.20% on the retest. If it does, the alt rotation thesis gets pushed back again. Capital doesn't care about narratives, it follows the path of least resistance.
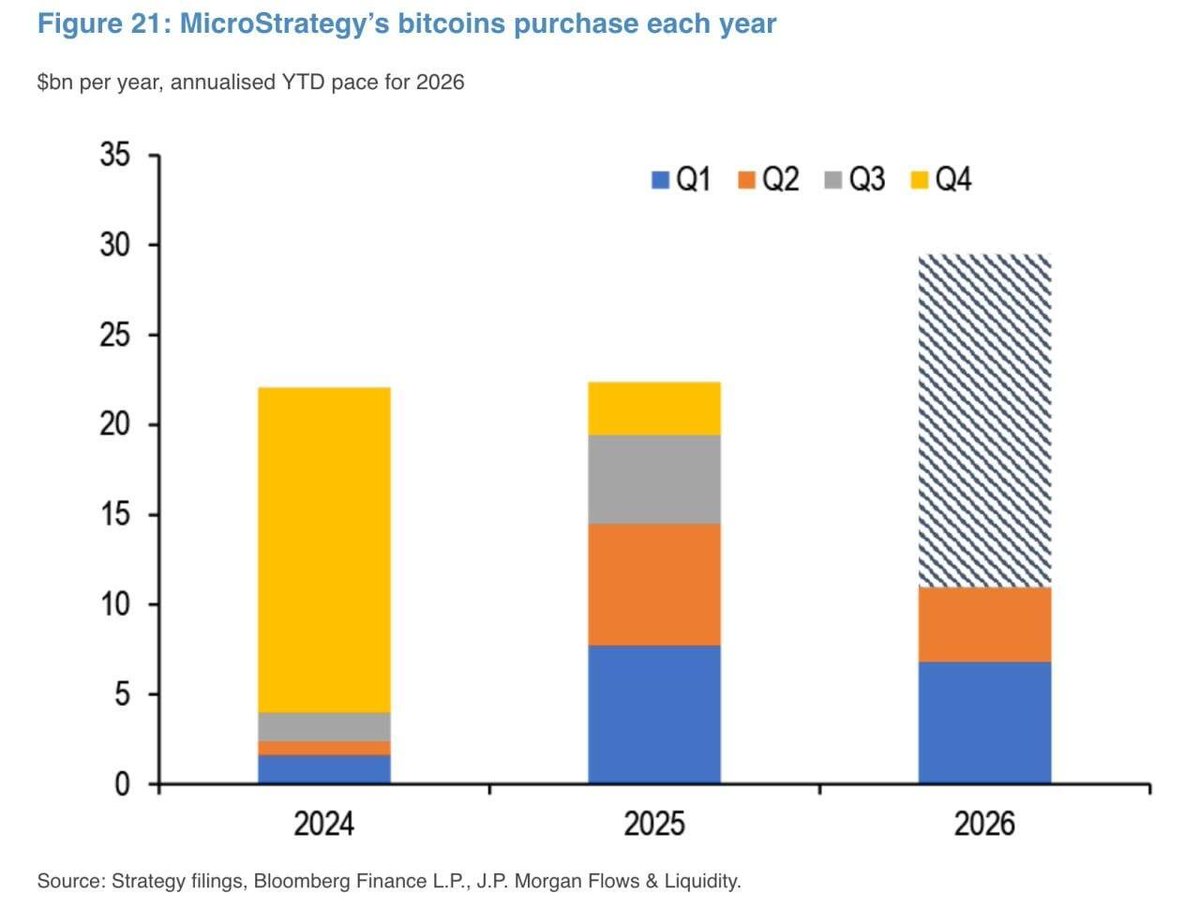
🚨STRATEGY IS ON PACE TO BUY MORE BTC IN 2026 THAN THE PREVIOUS TWO YEARS COMBINED
$22B in 2024. $22.5B in 2025. 2026 annualized pace: ~$30B. And we're only in Q2.
This isn't a company buying bitcoin anymore. This is a systematic absorption machine pulling supply off the market at an accelerating rate every single year.
@KillaXBT Valid risk. But 5-8% down needs forced sellers. Where's the OI buildup that gets liquidated into the print?
If CPI comes in soft, the short is the wrong trade. Know your levels before the number, not after.
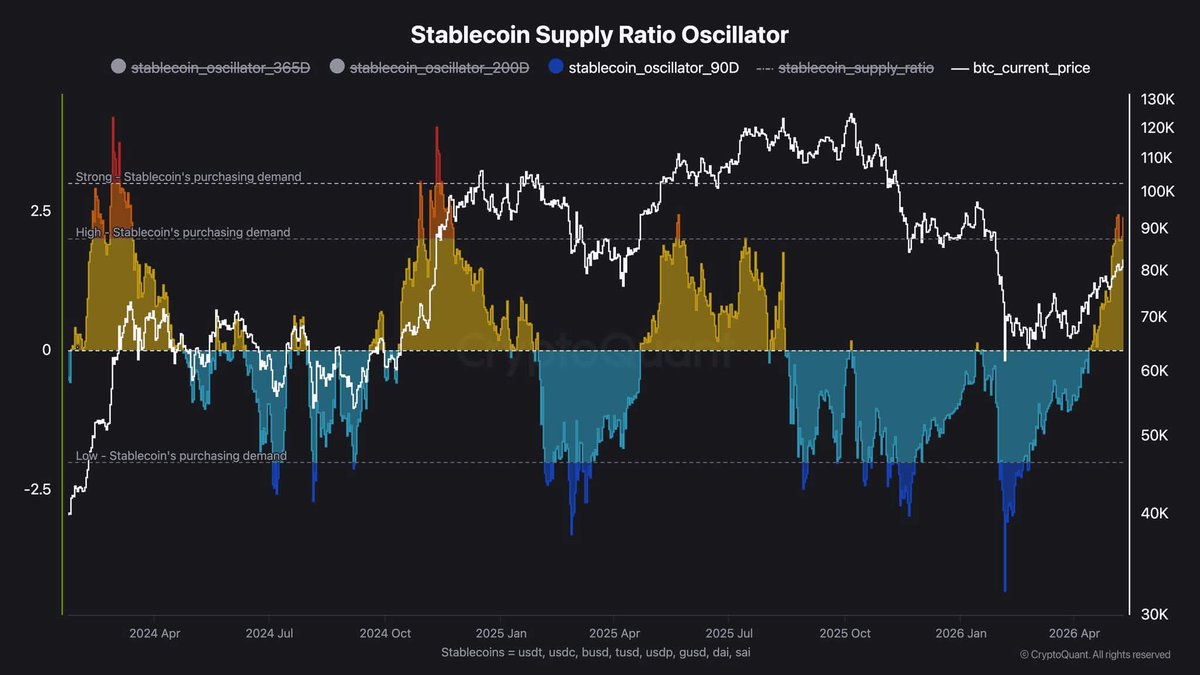
🚨STABLECOIN PURCHASING POWER IS COILING AGAIN
The SSR oscillator just flipped back into positive territory on the 90D after spending most of Q1 2026 deep in the red. Last time this exact setup printed (Oct 2024), BTC was at 60K.
Three months later it was at 100K.
The mechanic is simple: low SSR = stablecoins are cheap relative to BTC supply = dry powder waiting to deploy. High SSR = stablecoins already converted = fuel spent.
Right now the 90D is turning while the 365D and 200D are still negative. That divergence is the tell. Early rotation, not late-cycle euphoria.
🚨 ISSO VAI INCOMODAR MUITA GENTE
Um garoto de 23 anos de Miami não faz trades. Não olha gráfico. Não acompanha PnL.
4 fins de semana com Claude Code. Um Mac Mini. 7 telefones na mesa com contas separadas na Polymarket.
O agente monitora 80+ mercados, caça probabilidades mal precificadas, dimensiona as apostas e submete de onde tem margem. Hold médio de 14 minutos. Taxa de acerto: 71,4%.
Ontem à noite, enquanto dormia: 1.247 trades executados.
Fevereiro: $194k. Março: $389k. Abril: $487k. Maio: $780k. Estamos no dia 10.
A única coisa que ele checa por dia é a fila de saques da Polymarket pro vault da Hyperliquid.
E você o que está fazendo agora?
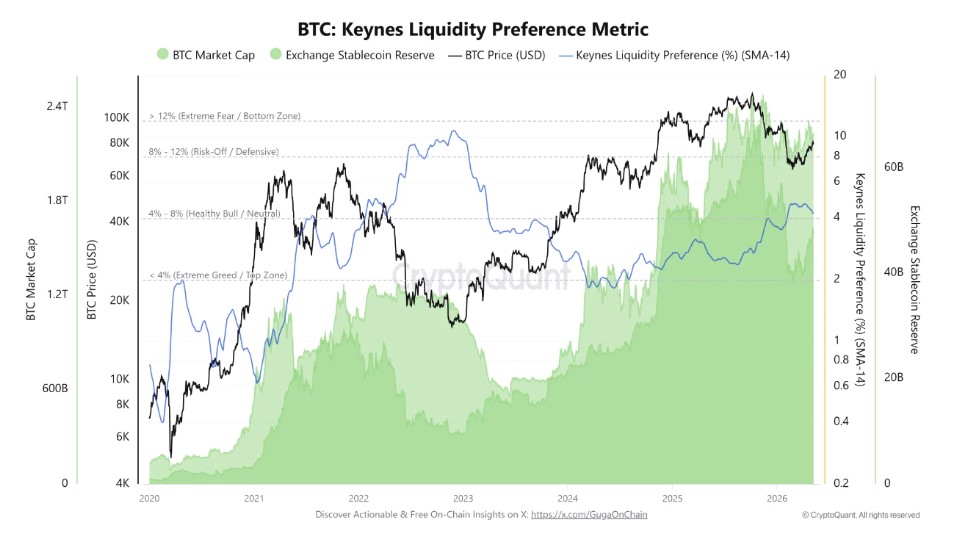
🚨THE LIQUIDITY SITTING ON THE SIDELINES
Keynes Liquidity Preference at 8-9% right now. That's the Risk-Off / Defensive zone.
Translation: stablecoin reserves on exchanges are historically elevated relative to BTC market cap. Capital is parked, not deployed. That's not a bear market signal. That's dry powder waiting for a trigger.
Every time this metric dropped from the 8-12% range back toward 4%, BTC was already moving.
Gap filled, range intact, weekly close pending. Standard read.
What's not on the chart is the spot TWAP buyer that's been working Binance all weekend and the $570M liquidation cluster sitting right underneath price.
Someone is using this consolidation. The question is what they're building toward.
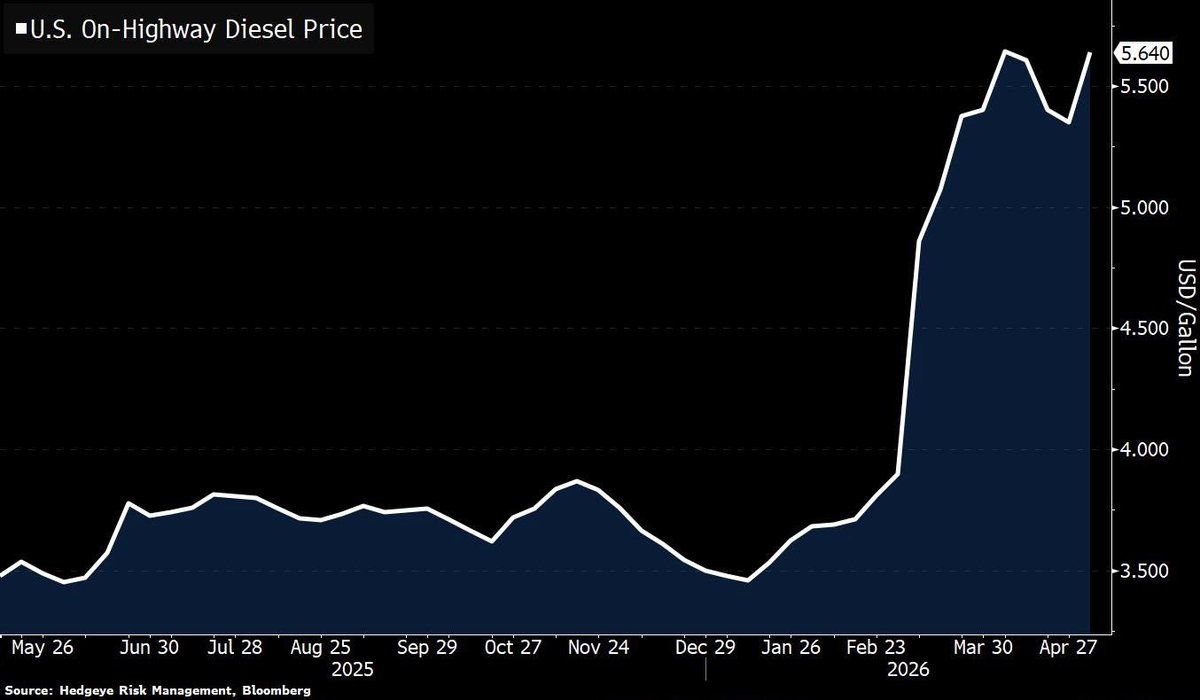
Diesel is the economy's base layer. Everything moves on trucks.
$5.64 a gallon means every product on every shelf costs more to get there. That's not an energy story. That's a CPI floor that doesn't care what the Fed does with rates.
Hard to cut inflation when the cost of moving goods keeps going up.
@DaanCrypto Monday gains make sense if you think about what happens over the weekend.
Spot TWAP buyers accumulate Saturday and Sunday with thin volume. CME opens Monday. Futures traders catch up to where spot already moved. The gap gets priced in fast.