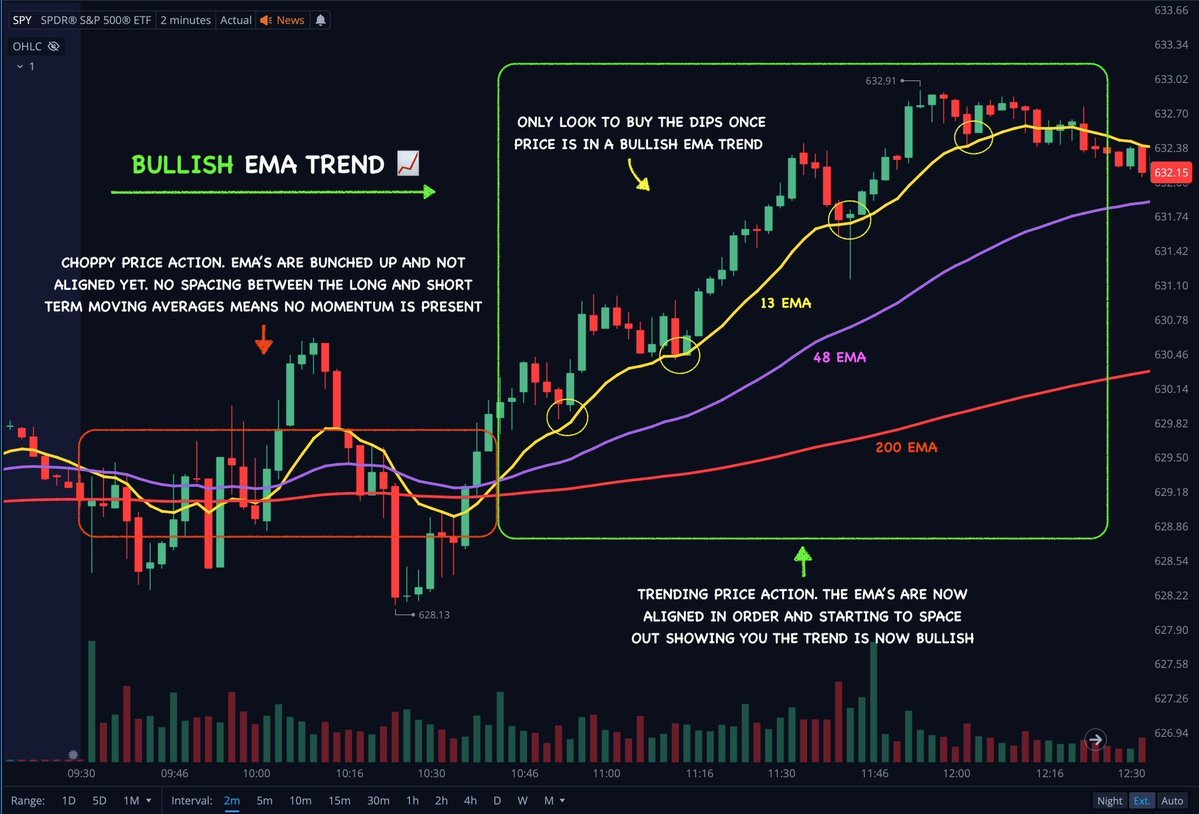
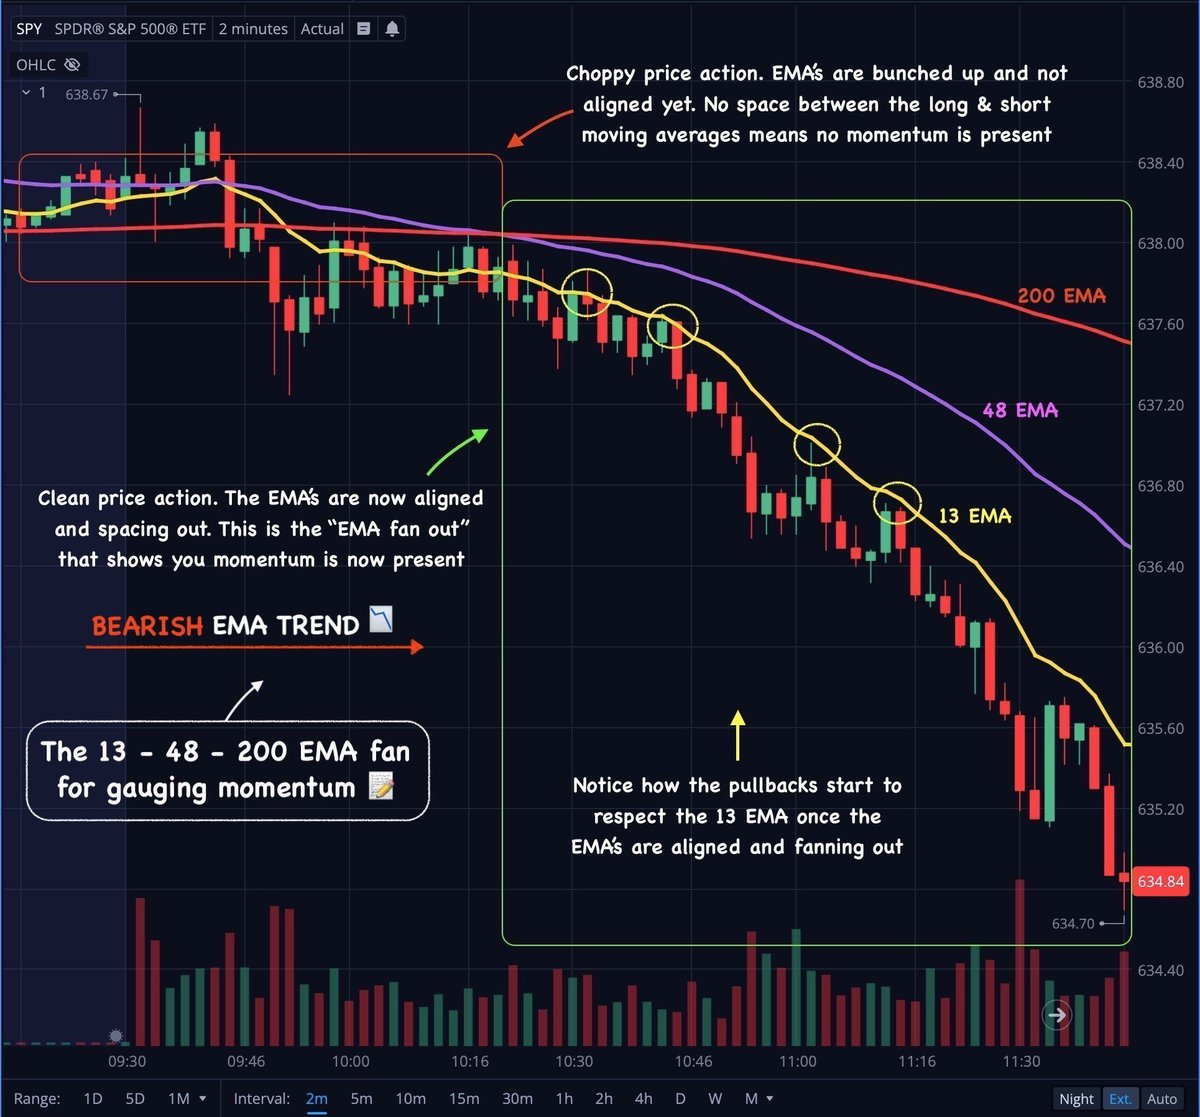
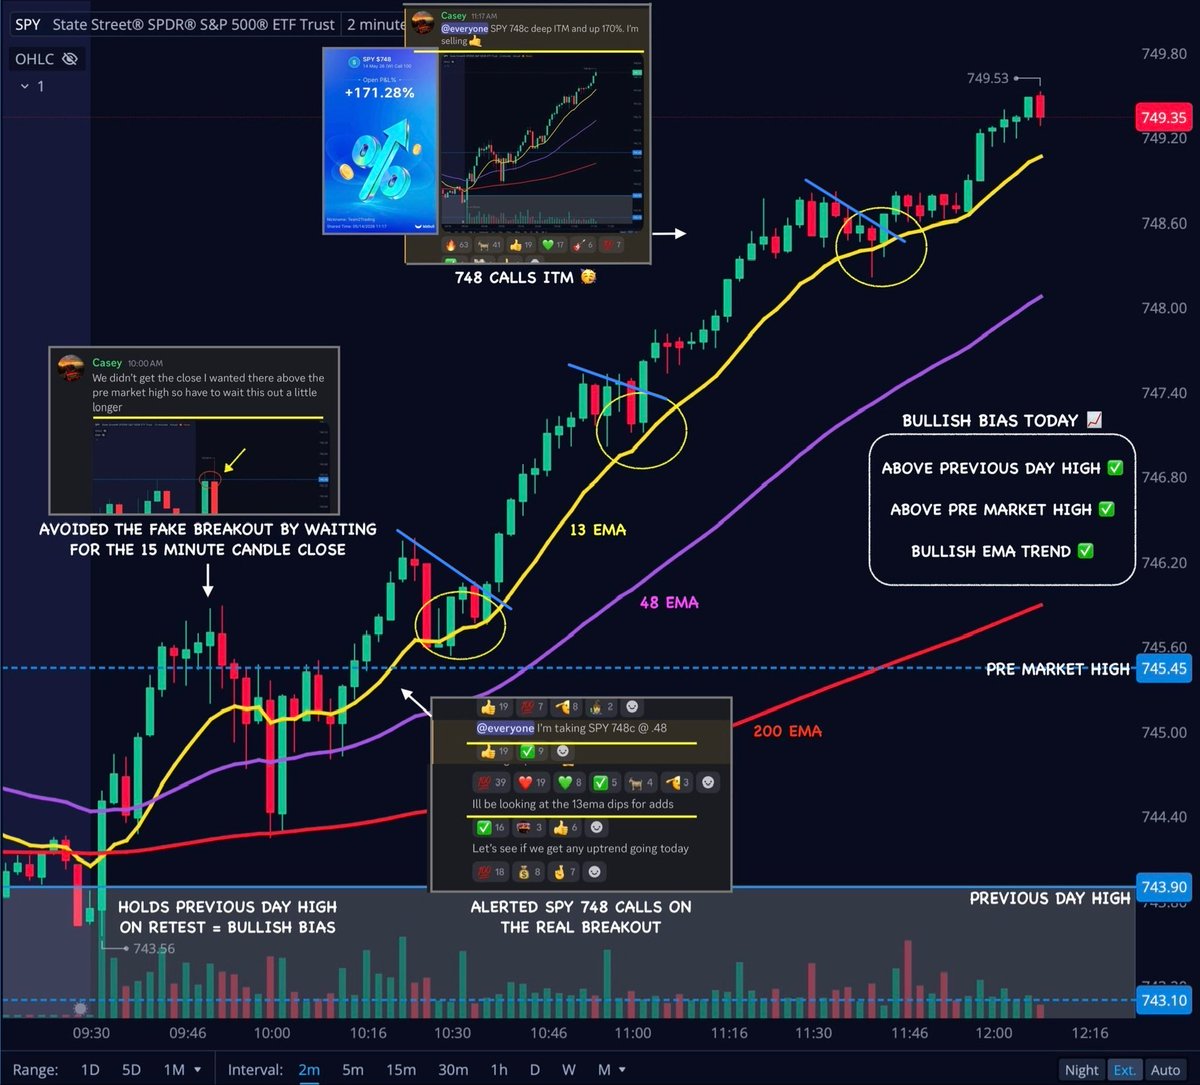
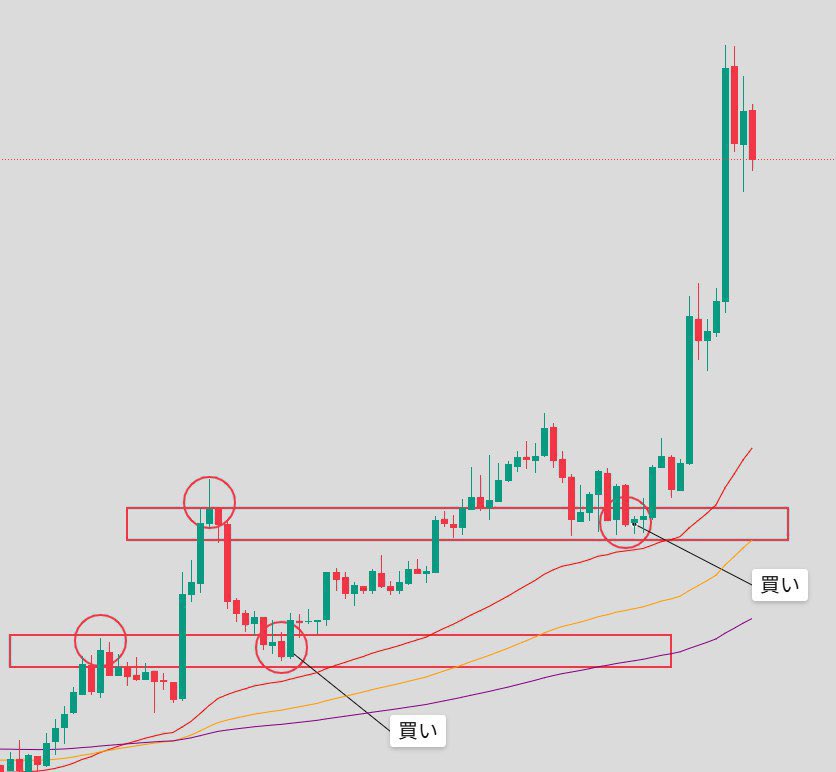
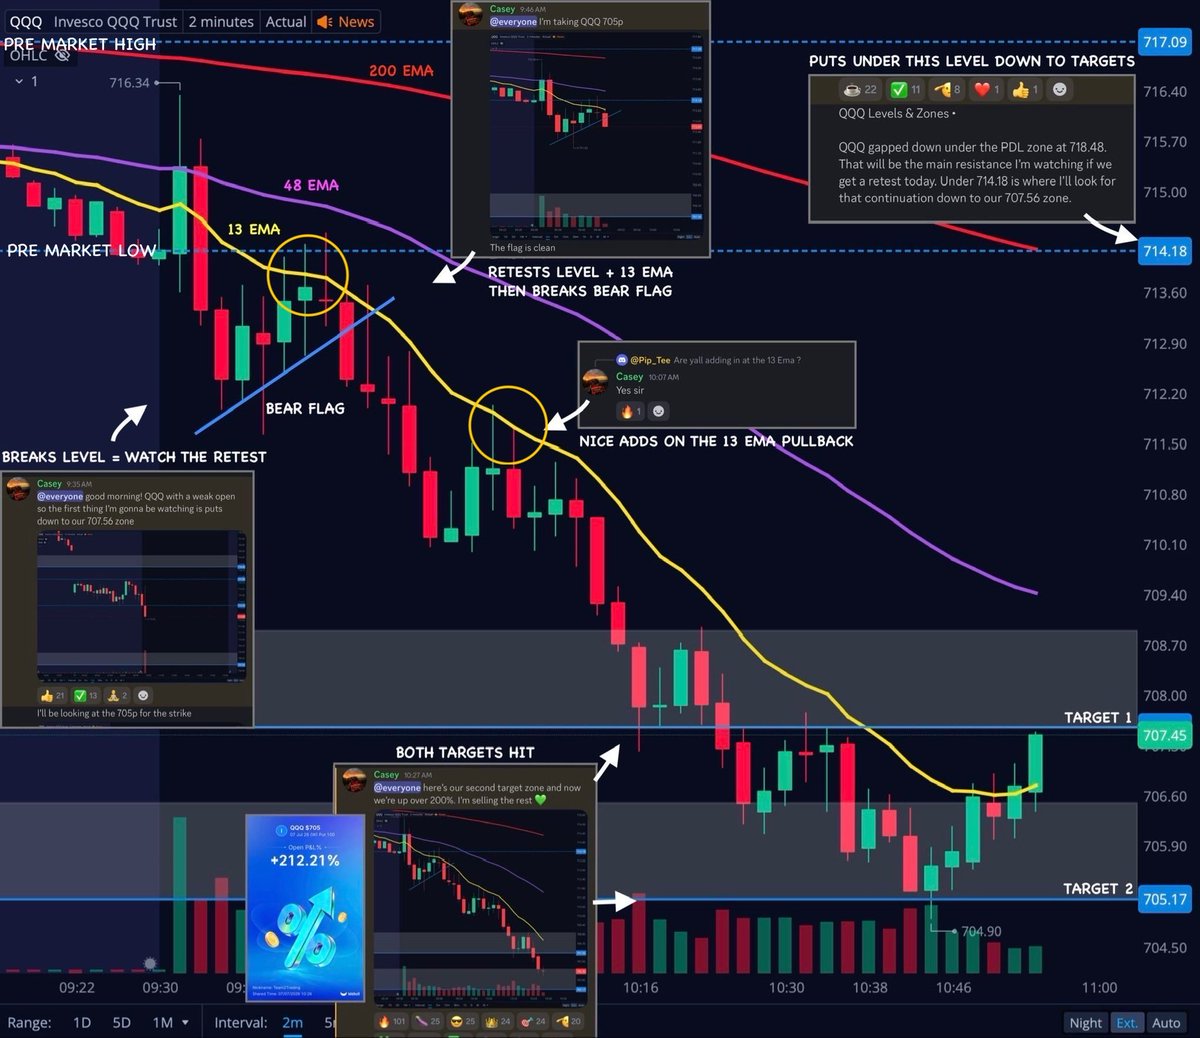
6+ years of trading, tens of thousands of charts studied, and a stupid amount of dumb mistakes... all simplified into 4 infographics I created.
How I long/short, execute & manage risk in ANY market.
This is quite literally my entire approach.
SAVE + BOOKMARK this one!!
Backtest and study the way price reacts to these 4 levels…
Previous day high ✅
Previous day low ✅
Pre market high ✅
Pre market low ✅
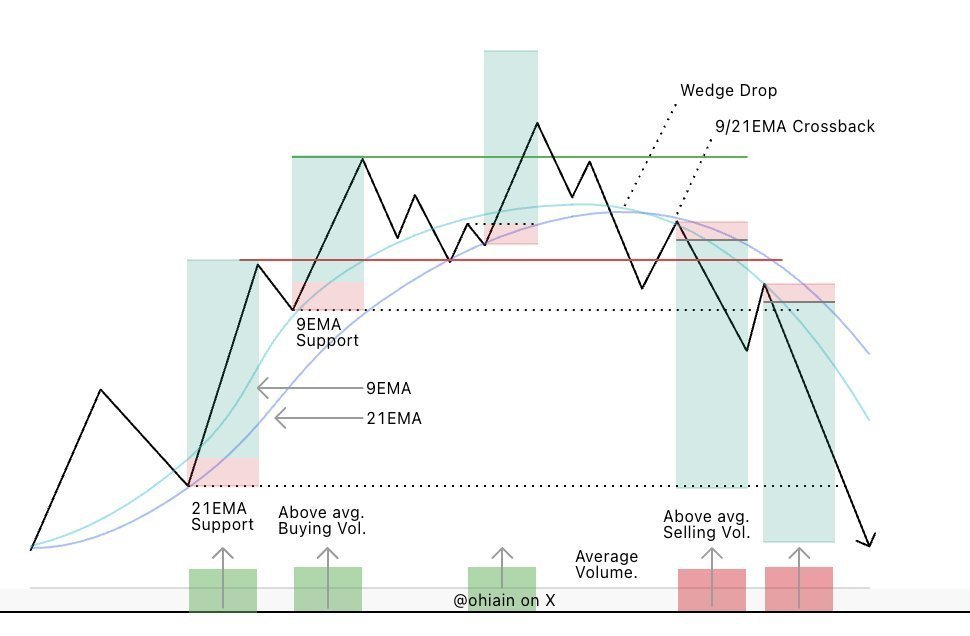
Then study the way price reacts to these EMA trends…
13 EMA 🟡
48 EMA 🟣
200 EMA 🔴
Now learn to spot these 2 simple chart patterns…
Bull Flag 📈
Bear Flag 📉
Once most people go through this process… they find out that it’s all they need as far as technical analysis goes 👊
$SPY $QQQ $IWM
Bitcoin makes more sense when you step back to the monthly chart.
MaxConfluence BTC brings trend, momentum and macro context into one view, with signals confirmed at month close.
Built to show where the models agree and where they don't.
Here’s the free link to the indicator:
https://t.co/9dyOnsqRfS
I’ve completely improved the visual design of the indicator.
Cleaner structure, better readability, less clutter and a much more refined look on the chart.
Same logic. Better presentation.
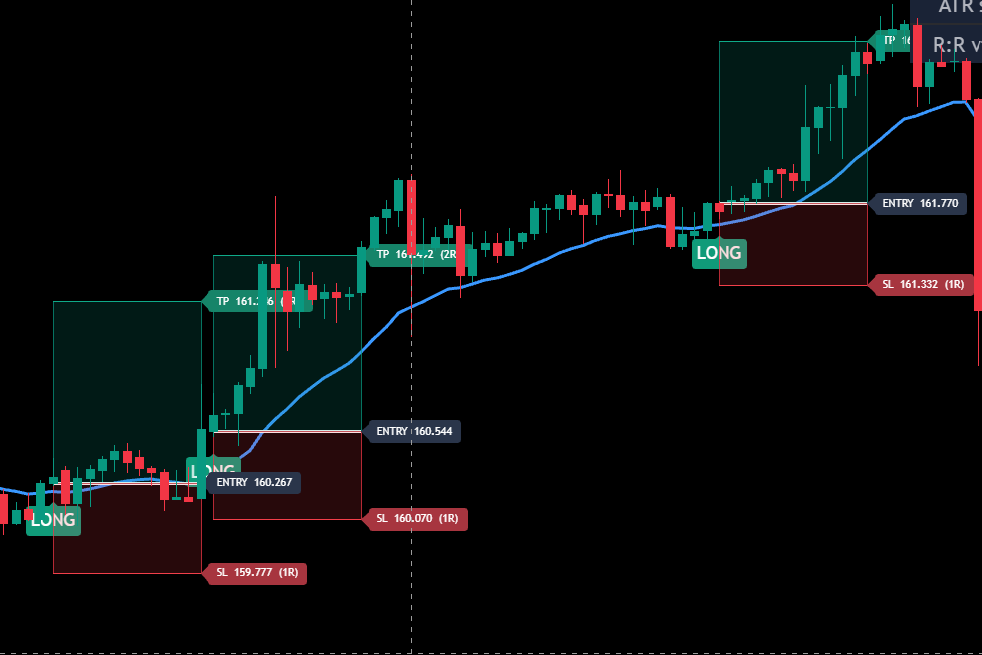
Just released a breakout strategy on @TradingView that automatically identifies and visualizes two systematic breakout setups.
Includes entry signals, stop-loss levels, and risk/reward visualization directly on the chart.
Fully rule-based, no discretionary guesswork.
The MT5 Source code and @tradingview code is also included!
Completely free.
Link below 👇