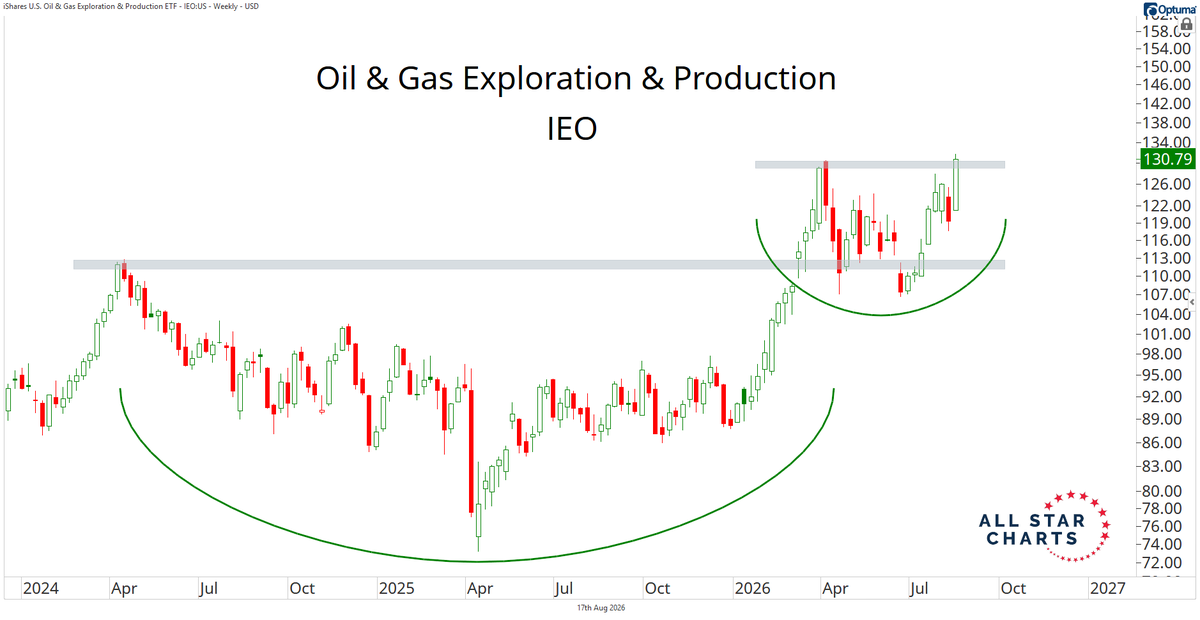
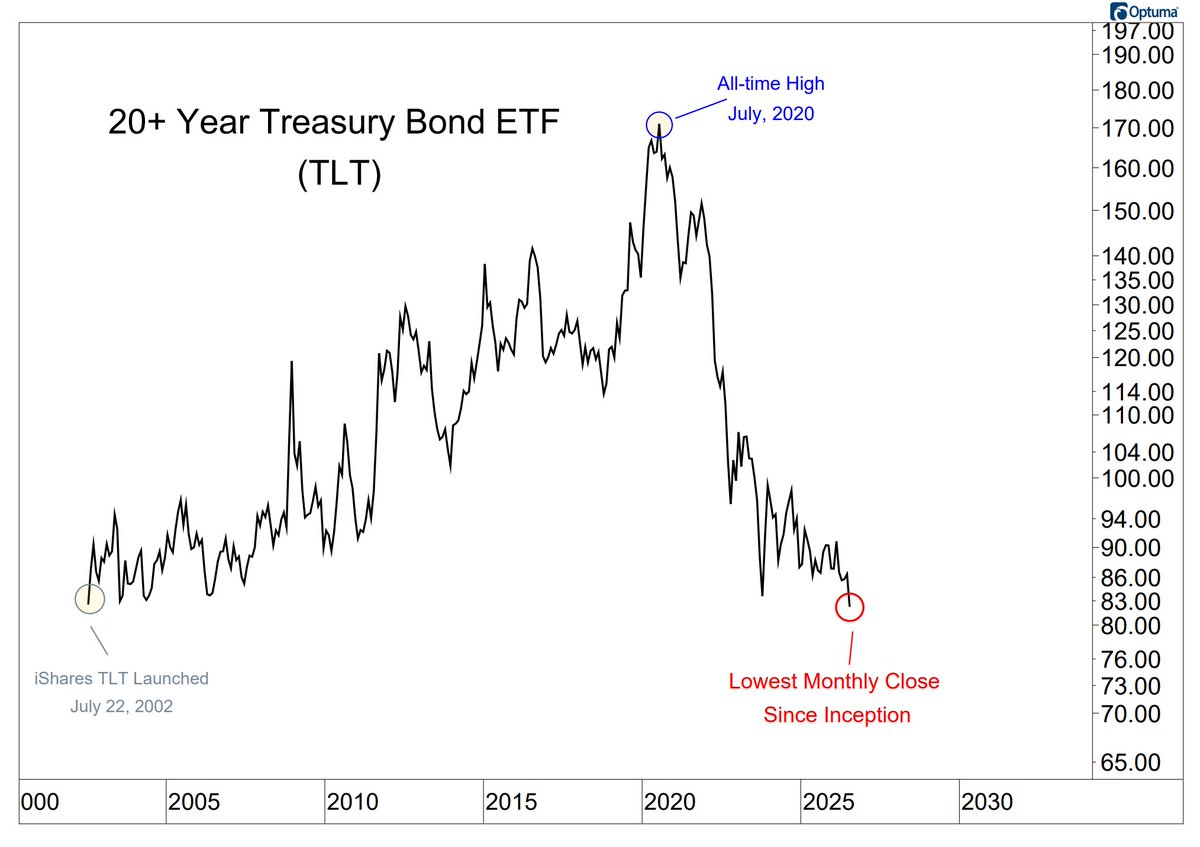
2026 has been a year of corrections, rotating one sector at a time, all under an index 3% from a high.
The strongest six months of the presidential cycle start Tuesday. The damage is already done. The question is what kind of rally shows up.
Full note: https://t.co/5FiY0mzEzS
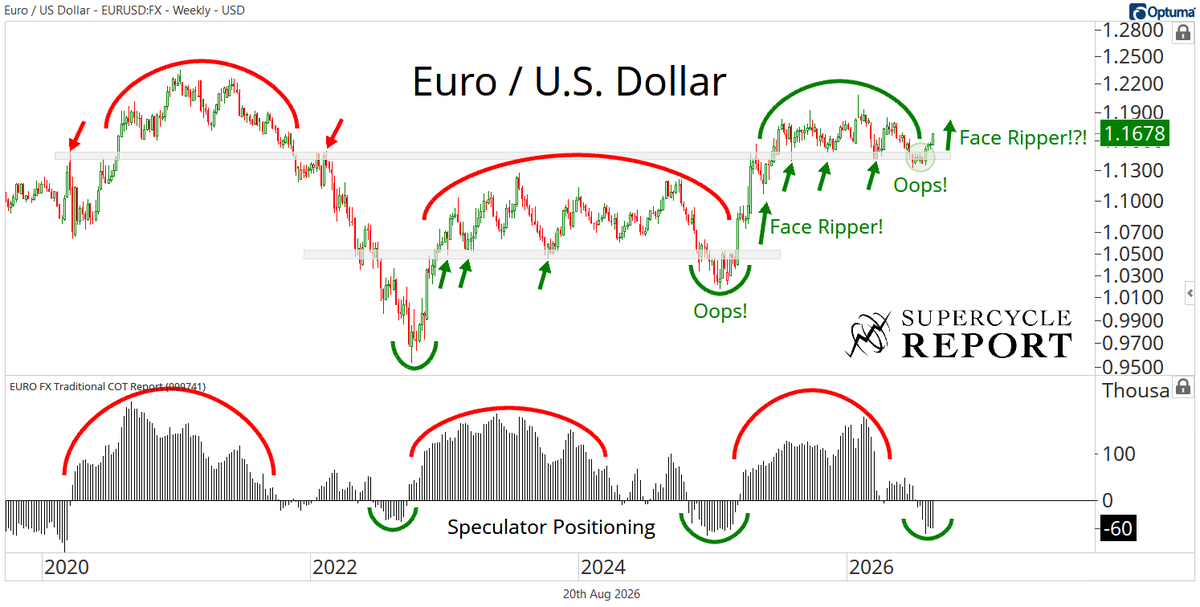
How much of the euro's swing do the rates explain?
EUR/USD (black) and Bund-Treasury spread (blue) fell together since summer (60-day correlation: 0.84). But the relationship broke down in 2025 and 2026: it accompanies, it does not guarantee.
The biggest development today wasn't Leopold and his Situational Awareness liquidation.
It was the US Dollar Index $DXY putting in a failed breakout at a key level. It's now back in its one-year range, giving dollar bears an opportunity to press a meaningful advantage.
Ex-US capital markets writ large should benefit from a falling dollar.
Here's the developed markets side of the equation: $EFA put in a nice green stick today as it presses toward fresh all-time highs.
As long as dollar weakness persists, ex-US stocks can retake the leadership baton into the back half of 2026.
Latin American currencies are getting closer to completing a classic Wyckoff-style accumulation pattern vs the US Dollar.
Today, the $DXY is moving squarely back into it's range.
So, the US Dollar Index $DXY is threatening to break out of a year-long range?
But Latin American Currencies are looking to complete a classic Wyckoff-style accumulation pattern vs the US Dollar?
One of these will be wrong.
Money has been rotating out of the semiconductor and AI infra themes, aggressively.
In that environment, these are dangerous patterns to see resolve higher if you're bullish the broader market.
Staples look dangerous vs discretionary across the market cap ladder.
Whether these patterns fail lower or resolve higher will be an indication of how defensive that rotation gets.
$XLP / $XLY $PSCC / $PSCD
Revisiting the $SPX / $VIX ratio, things still look shaky in the near term for the bulls.
The ratio keeps stalling at the same level that has capped it repeatedly this cycle.
Most prior tags lined up with a correction or a pullback in the S&P.
Implied vol won't stay down long enough for the ratio to break out.
And that is yet another failed breakout for the $SPX / $VIX ratio.
Every tag of these highs marked the start of a corrective wave, some big, some small...
It keeps paying to watch it...
Today's Chart of the Day was shared by @nullcharts
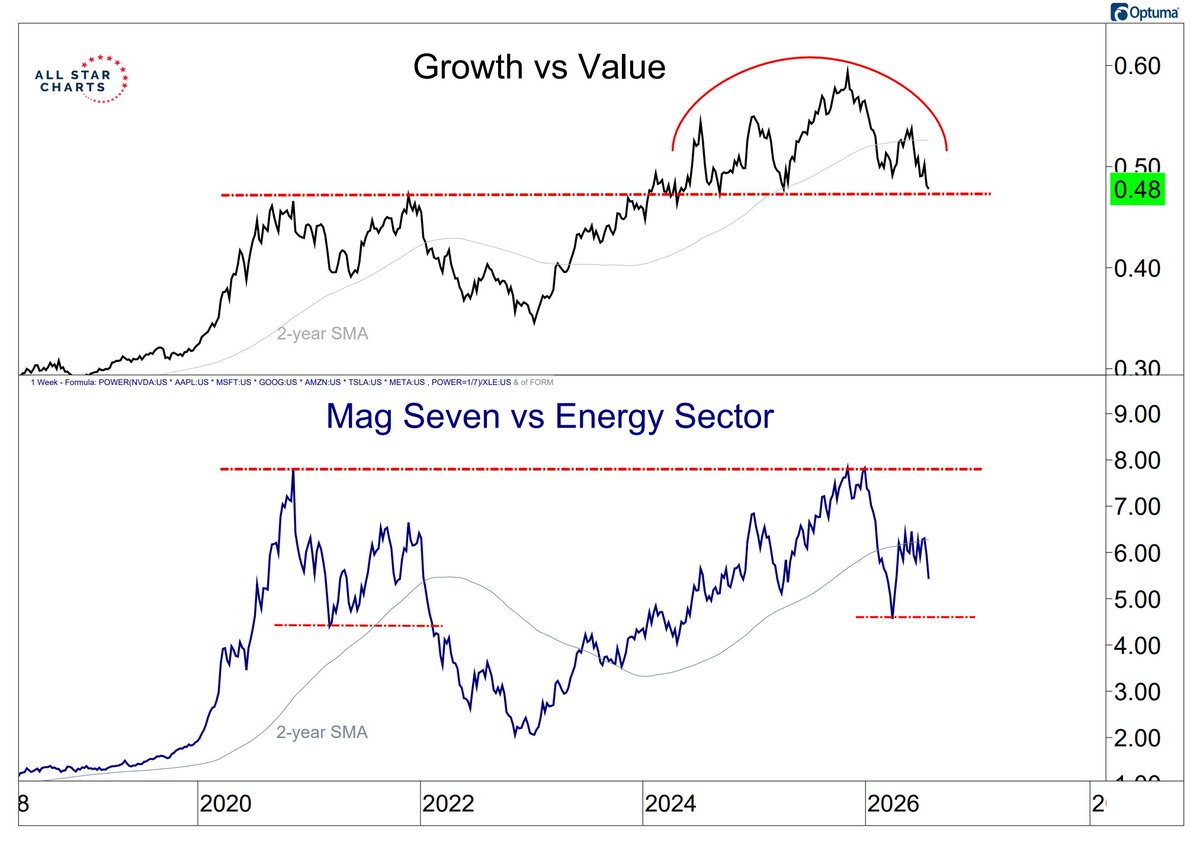
Continued deterioration in these ratios would mark a major shift away from the leadership that’s defined this bull cycle.
Get the full breakdown in today's report plus more great charts. ⬇️
https://t.co/ivRdtnRkUd