You already know how to research a company. Nobody told you it’s the same job. 🤔
Day 3 of: how to analyse a crypto token.
About the project.
This feels harder than it is. In traditional markets the business is something you can picture, and in crypto it mostly isn’t, so people assume it needs a different kind of research. It doesn’t. You’re asking what it sells, whether anyone buys it, who’s running it, and who paid for it to exist.
Where to look: the website and docs, their X account, the team’s personal accounts, and the on-chain dashboards.
What you’re working out:
1. What business is this? Strip the jargon and name the category.
2. Does it make money? Fees, revenue, users.
3. Who paid for it? Venture money, a treasury, or its own users.
4. Who is building it? Named people with a history, or nobody you can find.
5. Is the category going anywhere? A good project in a dying sector is still a problem.
6. Does the story match the data? The website will always sound good. Dashboards won’t.
Hyperliquid, for example.
🔍 Strip the words and it’s an exchange. People trade, it charges a fee. Around $88.8M in fees over the past 30 days, roughly $68.9M of it counted as revenue. No VC backing and no equity investors, with about 31% of supply going to early users instead, so there’s nobody holding cheap tokens waiting to exit.
You didn’t need to understand blockchains to follow any of that.
Watch out for: a project that can’t be explained without jargon, revenue that only exists in a roadmap, a team nobody can name, and a category that was hot two years ago.
Every answer is public. Most people just never go looking. 🙌
Most people can name the token they own. Far fewer can tell you what it actually does. 🤔
Let's fix that.
Day 2 of: how to analyse a crypto token.
Project overview.
This is the easy part, and it’s the part almost everyone skips. Before you trade something or invest in it, you need the gist of what it is, and that holds whether it’s a token, a stock, or anything else you’re putting money into.
This isn’t deep research. It’s the quick sweep that tells you whether something deserves the next hour of your time.
Here’s what you’re looking at:
What it does.
When it launched.
Tokenomics basics.
Market cap and rank.
Volume and price.
Where it’s listed.
Take Hyperliquid for example.
It’s a perpetual futures exchange running on its own chain. Market cap is around $20 billion, which puts it near the top ten. Daily volume is over $1 billion, so getting in and out isn’t a concern. It’s up roughly 100% over the past year.
Nothing alarming so far. But the same page also shows that most of the supply hasn’t reached the market yet, and that 14.2 million tokens unlock on 29 November.
That’s not good or bad. It’s just something you now know to go and look into. 🔍
Things to watch out for:
1. Thin volume, because liquidity is what lets you leave. 2. Negative news you hadn’t seen.
3. A big unlock on the calendar.
4. A Leader/founder quietly exiting.
5. And if there’s a named founder, what they built before this and how it ended.
Where to check all of it, free:
https://t.co/nSlYQQfyNs
https://t.co/MCLyLfXl8P
https://t.co/R5z4DCqtRV
https://t.co/OIRAbM27rr
Tomorrow we go a level deeper. 🙌
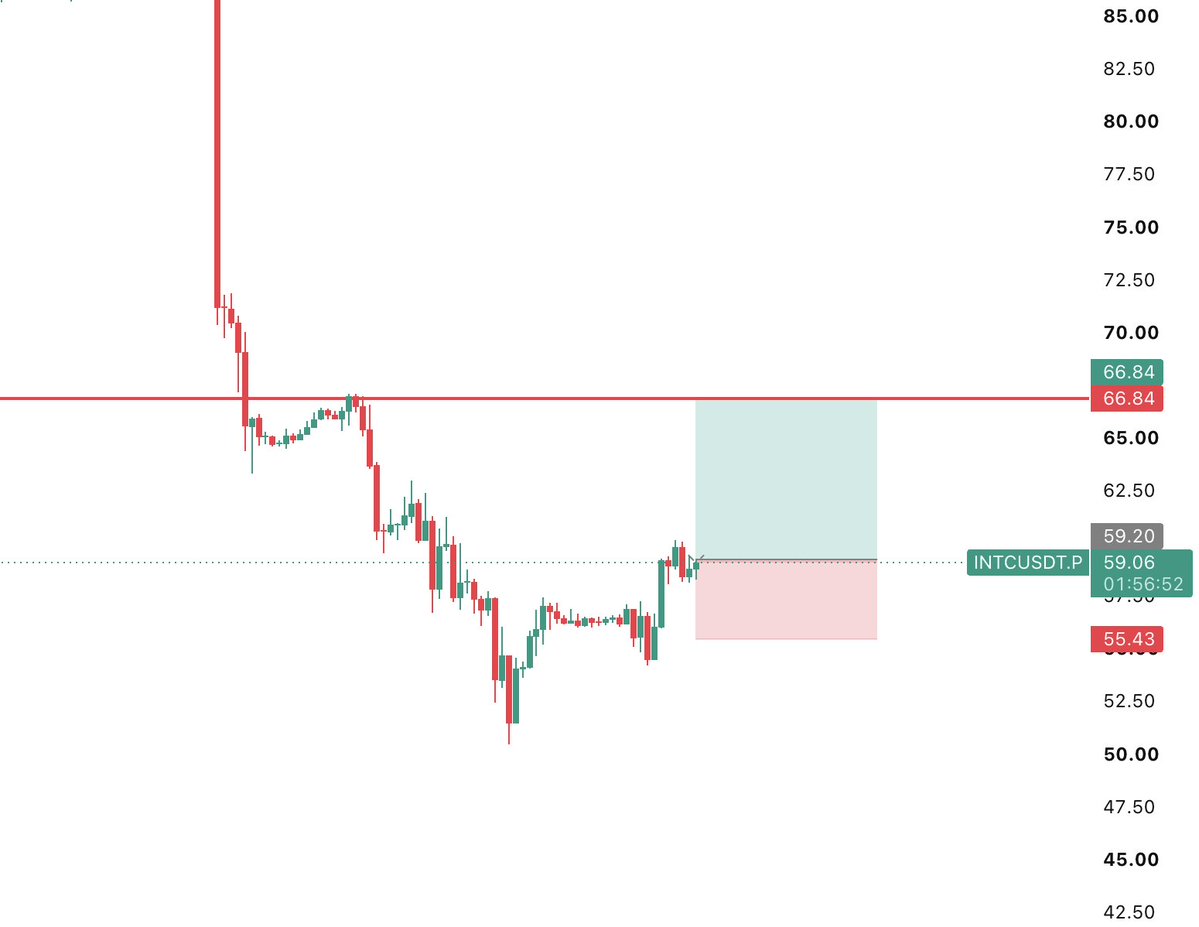
Chart of the Day: $INTC
Why this stock today?
After a sharp fall, INTC is showing early signs of a possible bottom. Lower-timeframe price action is improving, suggesting a potential bounce from current levels.
Any news or event?
On November 6, White House official Kevin Hassett said Intel’s turnaround has been encouraging, pointing to the company’s improving performance.
Technical snapshot
Trend: Potential bullish reversal
Key level: $59
Support: $54.40
Resistance: $66.84
What to watch for
Above $59 → Potential bullish continuation
Below $59 → Pullback risk
Current view
Bullish (short-term)
You can trade INTC on Mudrex Futures INR
https://t.co/it5vniRztc
For learning purposes. Not investment advice.
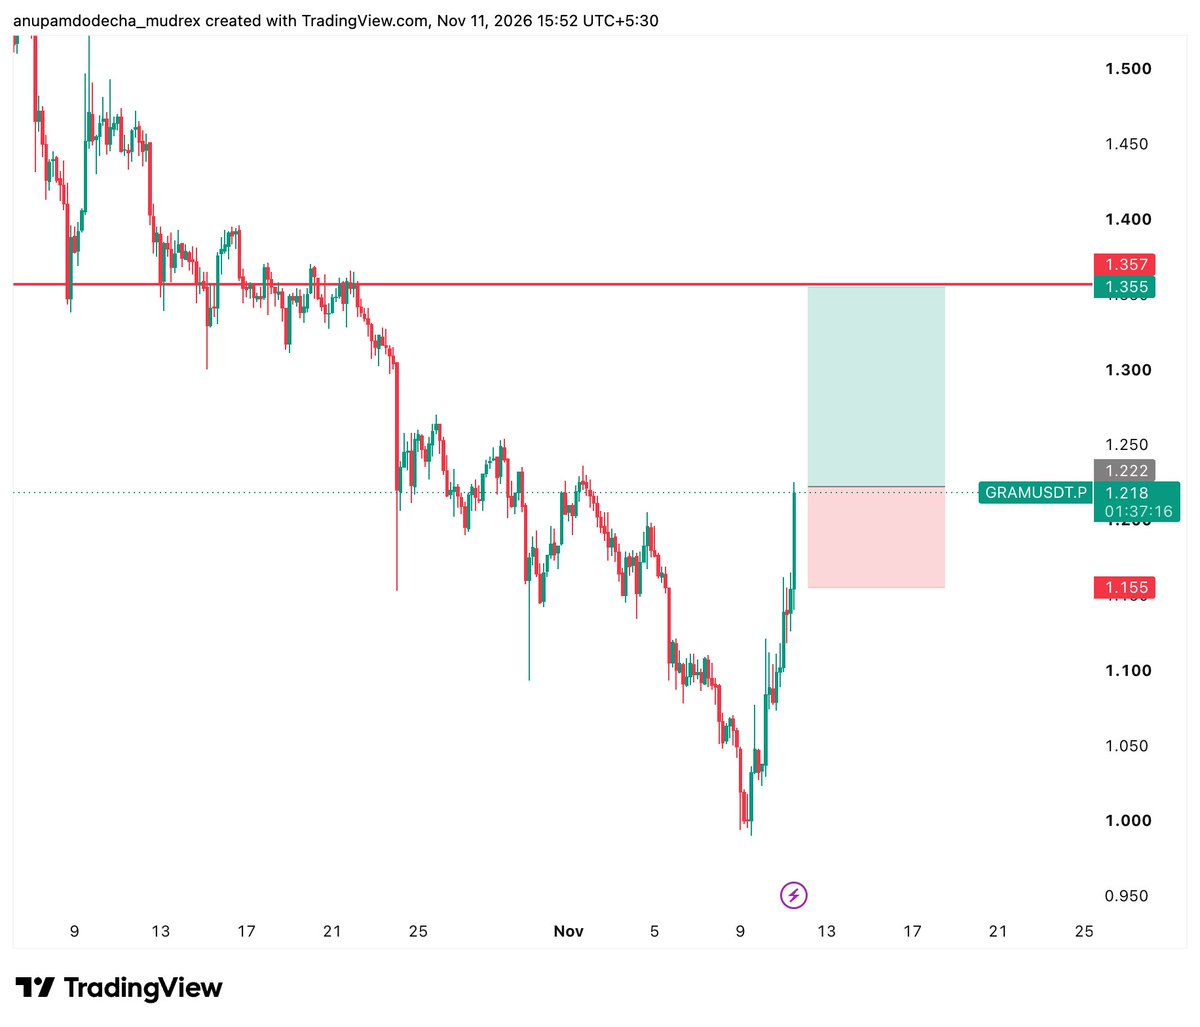
Chart of the Day: $GRAM
Why this token today?
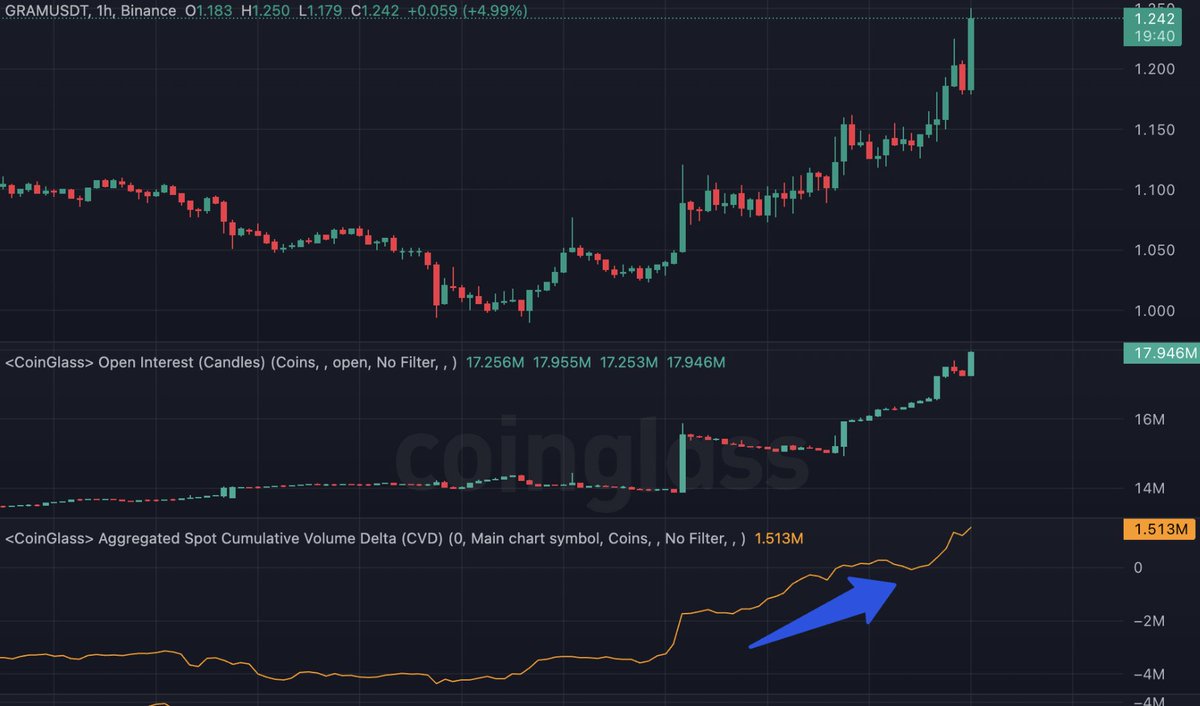
GRAM is showing signs of bottoming out. Lower-timeframe price action and rising volume point towards improving momentum, which could set the stage for a rally.
Any news or event?
Pavel Durov highlighted GRAM's strength on November 10, noting that it gained 8% while most of the crypto market was falling. He also mentioned that over 700K self-custodial Gram wallets were created on Telegram within 48 hours, pointing to growing adoption.
Technical snapshot
Trend: Bullish (short-term)
Key level: $1.225
Support: $1.146
Resistance: $1.357
What to watch for
Above $1.225 → Bullish continuation
Below $1.225 → Pullback
Current view
Bullish
You can trade GRAM on Mudrex Futures INR
https://t.co/buqGjBGdEP
For learning purposes. Not investment advice.
Chart of the Day: $GRAM
Why this token today?
GRAM is showing signs of bottoming out. Lower-timeframe price action and rising volume point towards improving momentum, which could set the stage for a rally.
Any news or event?
Pavel Durov highlighted GRAM's strength on November 10, noting that it gained 8% while most of the crypto market was falling. He also mentioned that over 700K self-custodial Gram wallets were created on Telegram within 48 hours, pointing to growing adoption.
Technical snapshot
Trend: Bullish (short-term)
Key level: $1.225
Support: $1.146
Resistance: $1.357
What to watch for
Above $1.225 → Bullish continuation
Below $1.225 → Pullback
Current view
Bullish
You can trade GRAM on Mudrex Futures INR
https://t.co/buqGjBGdEP
For learning purposes. Not investment advice.
Chart of the Day: $GRAM
Why this token today?
GRAM is showing signs of bottoming out. Lower-timeframe price action and rising volume point towards improving momentum, which could set the stage for a rally.
Any news or event?
Pavel Durov highlighted GRAM's strength on November 10, noting that it gained 8% while most of the crypto market was falling. He also mentioned that over 700K self-custodial Gram wallets were created on Telegram within 48 hours, pointing to growing adoption.
Technical snapshot
Trend: Bullish (short-term)
Key level: $1.225
Support: $1.146
Resistance: $1.357
What to watch for
Above $1.225 → Bullish continuation
Below $1.225 → Pullback
Current view
Bullish
You can trade GRAM on Mudrex Futures INR
https://t.co/buqGjBGdEP
For learning purposes. Not investment advice.
Chart of the Day: $INTC
Why this stock today?
After a sharp fall, INTC is showing early signs of a possible bottom. Lower-timeframe price action is improving, suggesting a potential bounce from current levels.
Any news or event?
On November 6, White House official Kevin Hassett said Intel’s turnaround has been encouraging, pointing to the company’s improving performance.
Technical snapshot
Trend: Potential bullish reversal
Key level: $59
Support: $54.40
Resistance: $66.84
What to watch for
Above $59 → Potential bullish continuation
Below $59 → Pullback risk
Current view
Bullish (short-term)
You can trade INTC on Mudrex Futures INR
https://t.co/it5vniRztc
For learning purposes. Not investment advice.
BREAKING: Michael Burry is betting ~$1B against AI
Palantir and Nvidia are the big ones
13F shows short exposure:
- $PLTR: ~$912M
- $NVDA: ~$187M
he called the housing crash before everyone else
made ~$100M personally and $700M+ for investors
now he’s shorting the AI trade
what does he know? 👀