@Opendoor 2026 Q1 Sneak Peek
Raw data tracked:
1,467 homes sold
$557.8M Revenue
12.29% Gross Margin.
Accounting for ~85% tracking coverage and margin offsets,
my final estimates for the Q1:
✅ Sales: 1,725 homes
✅ Revenue: ~$656M
✅Margin:10~11%
$OPEN
#Faster
@Opendoor 2026 Q1 Sneak Peek
Raw data tracked:
1,467 homes sold
$557.8M Revenue
12.29% Gross Margin.
Accounting for ~85% tracking coverage and margin offsets,
my final estimates for the Q1:
✅ Sales: 1,725 homes
✅ Revenue: ~$656M
✅Margin:10~11%
$OPEN
#Faster
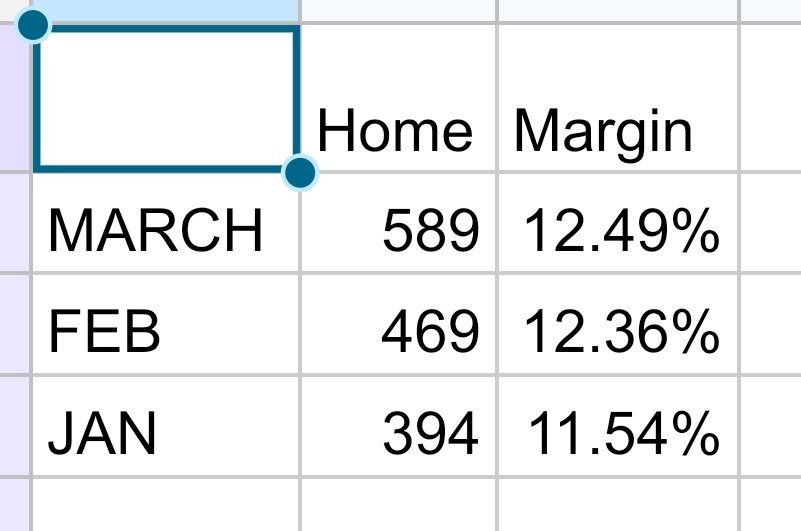
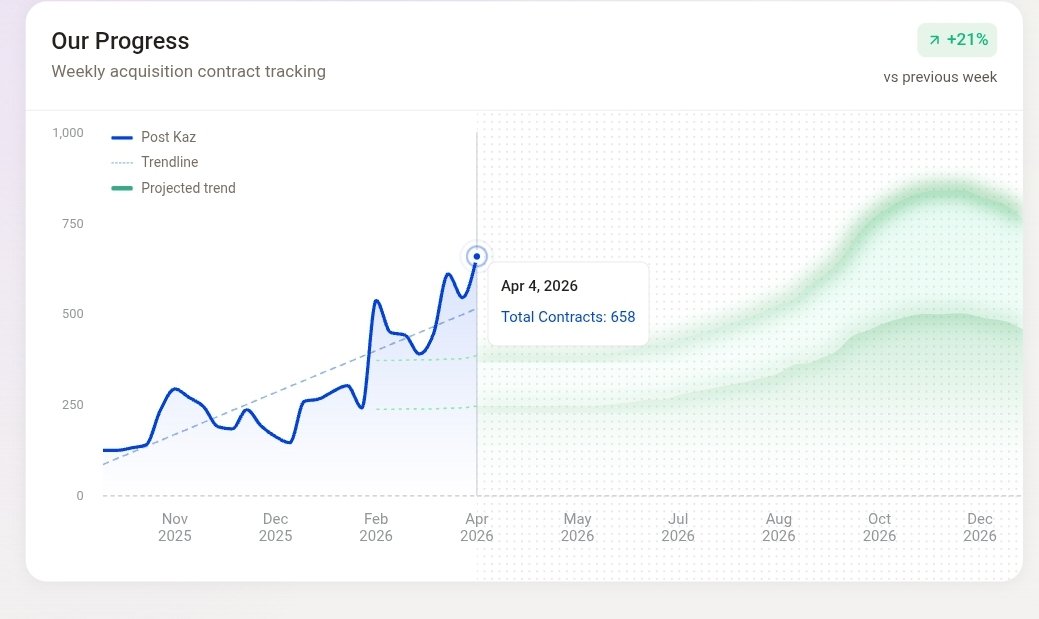
April Summary:
@Opendoor ( $OPEN )
Key Metrics & Q2 Projections 🏠📊
April was a strong month for Opendoor.
Here’s a breakdown of the latest data:
Inventory :
811 new listings in April
(New high for 2026).
Sales Activity:
581 homes sold
716 currently pending.
(1/6)
@Opendoor 2026 Q1 Sneak Peek
Raw data tracked:
1,467 homes sold
$557.8M Revenue
12.29% Gross Margin.
Accounting for ~85% tracking coverage and margin offsets,
my final estimates for the Q1:
✅ Sales: 1,725 homes
✅ Revenue: ~$656M
✅Margin:10~11%
$OPEN
#Faster
Finally, what I most want to improve is that it takes about 30 days from pending to sale.
I hope this time can be significantly shortened.
(6/6)
$OPEN
#Faster@nejatian@morganb
Total projected sales: ~1,831 (captured data).
Adjusting for data coverage (85-90%), total Q2 sales should land around 2,150 units.
Estimated Q2 Revenue: ~$810M.
(5/6)
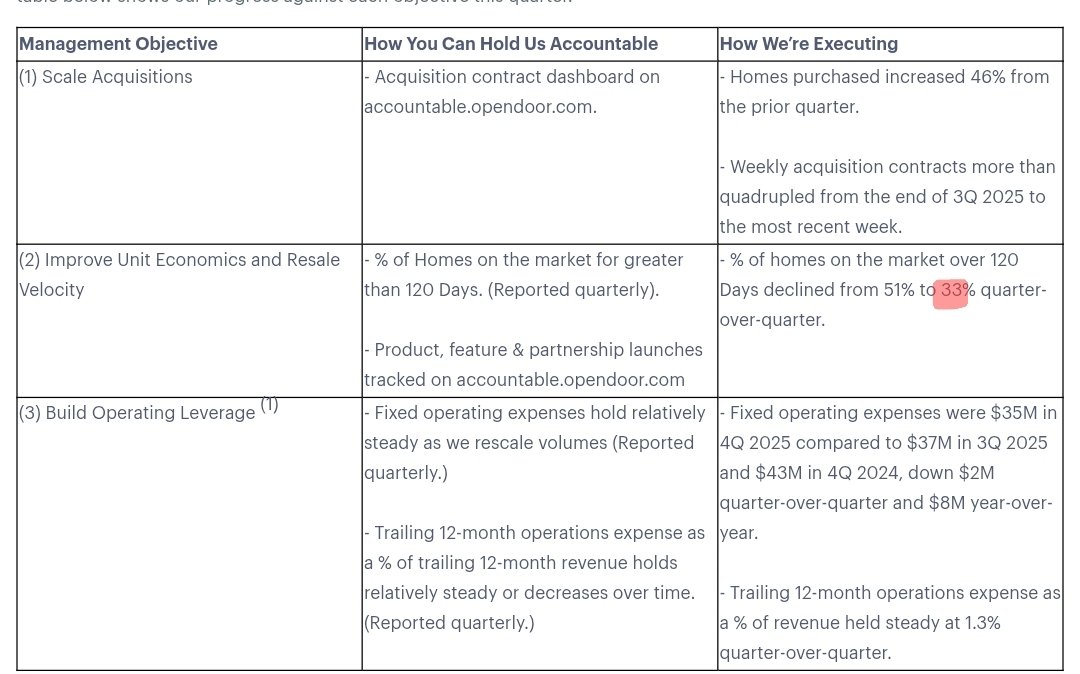
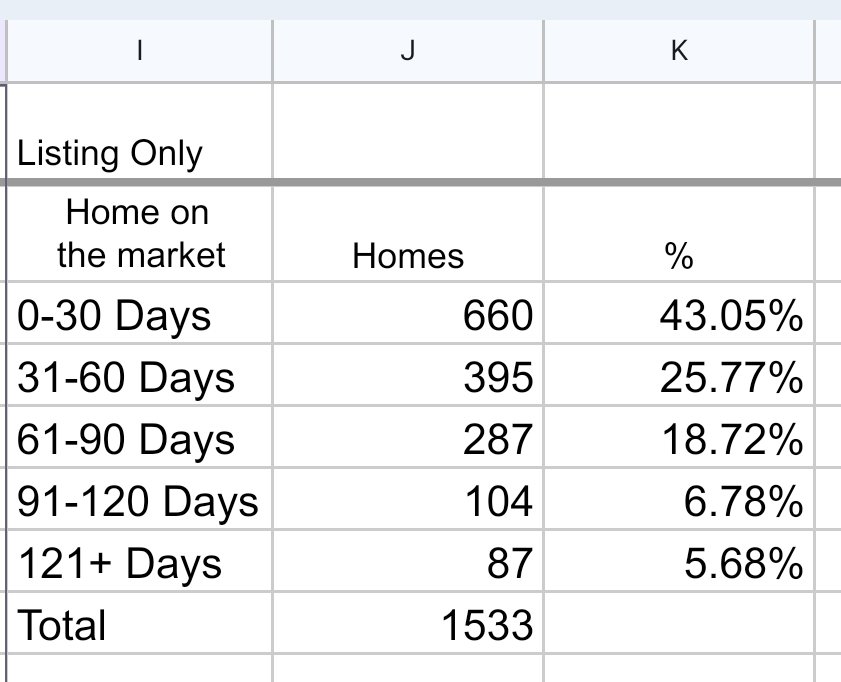
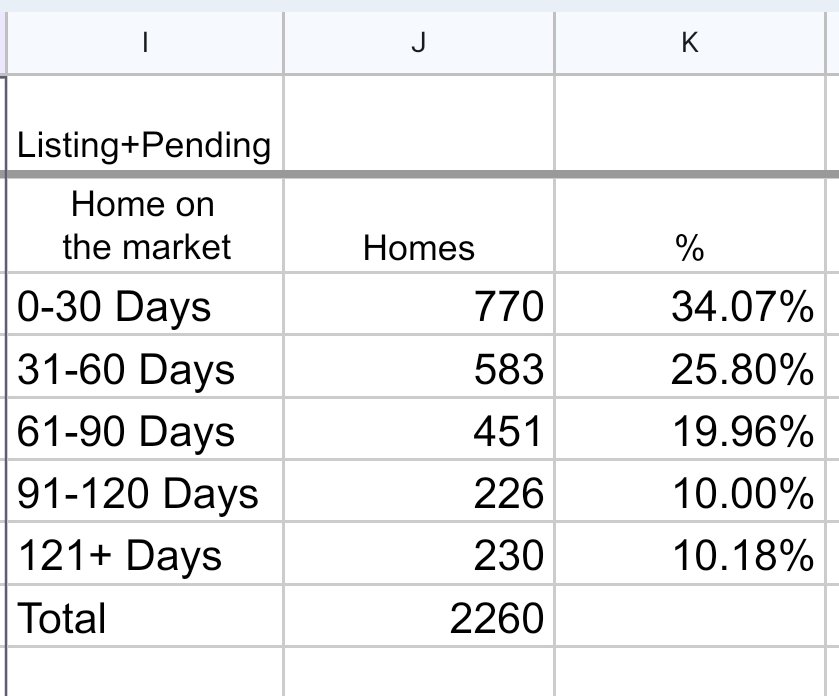
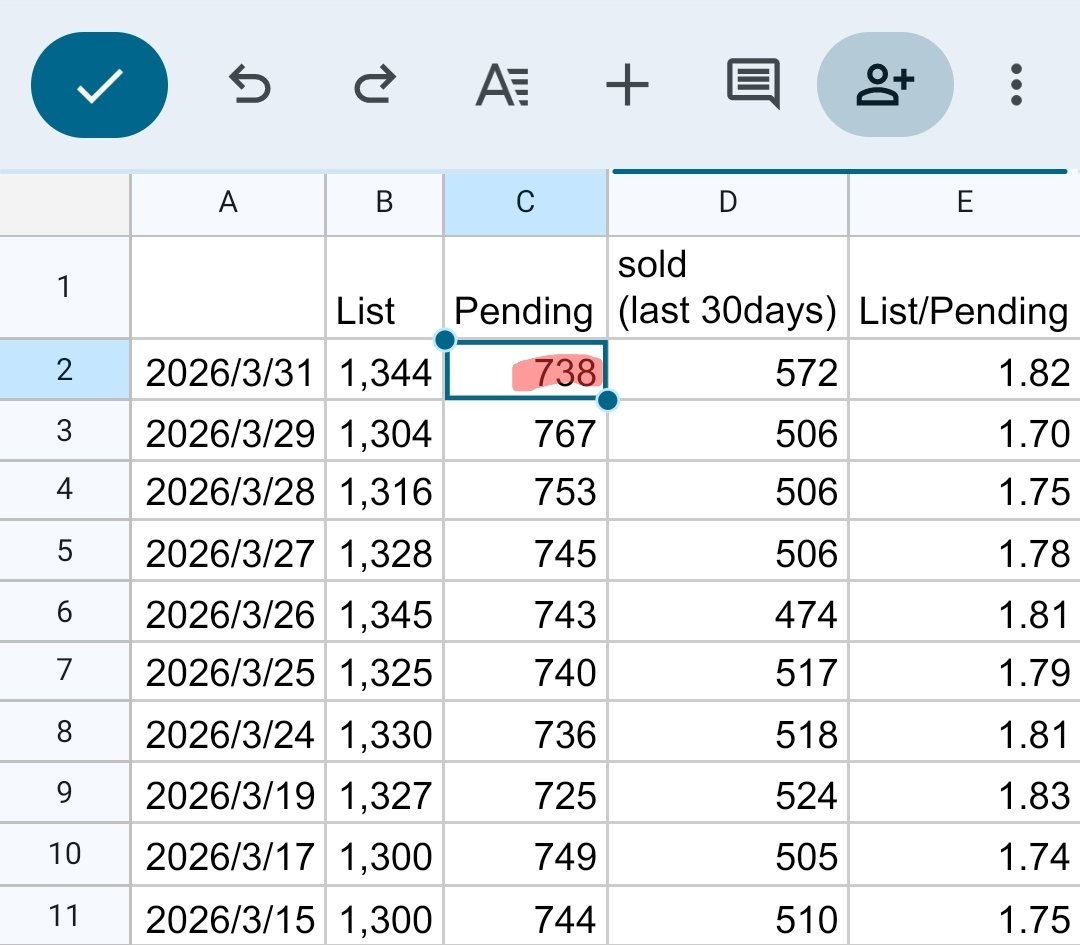
As of now, among homes listed and pending on @Opendoor, 10.18% have been listed for more than 120 days;
if only listings are considered, this figure is even lower at 5.68%.
At the end of December last year, this figure was 33%.
#FASTER
$OPEN
Since April, the number of pending and sold homes in @Opendoor listings appears to have stagnated.
With new listings reaching record highs, there is hope that this will boost future income.
$OPEN
#Faster
(1/2)
Let me explain why my estimate differs from Singularity's. Singularity considers all homes delisted from OpenDoor as sold, even though they're pending for about a month before closing. Therefore, they include the 739 pending homes in their estimate.
(2/2)
At the current average price of $400,000, that's approximately $295,000 in revenue. Subtracting $295,000 from their estimate of $950,000 gives $655,000, which is very close to my estimate.
(1/2)
Let me explain why my estimate differs from Singularity's. Singularity considers all homes delisted from OpenDoor as sold, even though they're pending for about a month before closing. Therefore, they include the 739 pending homes in their estimate.
@skysync6652@Opendoor Because he included properties pending in March in the sales revenue, but those properties won't sell until April, you can multiply his estimate by about 70% to get the actual sales revenue.
@Opendoor
In 26Q1,
I captured a total of 1,452 housing transactions.
I was able to capture approximately 85% of the data, so that translates to about 1700 transactions and an income of approximately 650 million.
$OPEN
#Faster
@Aubermark Hi Albert, have you noticed that Opendoor's acquisition volume and listing volume differ by more than half? For example, it acquired more than 1,600 listings in February, but has only listed more than 600 listings so far in March. What do you think might be the reason for this?