Cochin Shipyard OFS opened today at ₹1,400/share — 7% below prior close. Institutions subscribed the base offer 3.52x yesterday.
Greenshoe triggered. Stake sale expands to 5.04%. This is FY27's 7th divestment. Here's what a valuation-disciplined investor should actually think about this. 🧵
Feeder funds from Axis, PGIM, Franklin & Edelweiss are now closed. Your only option to invest in global markets is through LRS. I can explain more in our upcoming webinar. Comment global for the link.
Cyclical Stocks Boom in India: How to Play
Michael Burry ("The Big Short”) gave a lesson on X this weekend: "Now, Class, repeat after me. I will never buy cyclicals at low PEs and record earnings.” It’s the classic mistake retail investors make.
Burry’s Lesson
a. Retail investors in the US are going all-in on certain AI stocks that are delivering record earnings, and yet they are available at very low P/E.
An investor called out on X:
Micron Tech @ 6.49 Fwd PE
Nvidia @ 16.05 Fwd PE
These stocks have become the poster boys for US retail investors because the earnings guidance is enormous and forward P/E is mouth-watering cheap.
b. Michael Burry responded to that tweet on X: “Now, Class, repeat after me. I will never buy cyclicals at low PEs and record earnings. Say it again. I will never buy cyclicals at low PEs and record earnings.”
c. Cyclicals are companies whose revenues are heavily tied to economic cycles, resulting in massive boom-and-bust periods. Examples include steel, power, capital goods, automakers, and semiconductors (chips).
Boom Phase: Demand is super-high, supply is super-tight, prices skyrocket, and the company makes historic profits.
Bust Phase: By the time supply catches up, demand cools. Prices nosedive, and earnings evaporate.
Low PE Trap in Cyclicals
a. P/E = Price ÷ EPS. In value investing, low PE ratio means the stock is cheap. But in cyclical investing, the reverse logic applies. Low PE becomes a trap for retail investors. Here’s why:
At the peak of the boom, the cyclical stock’s earnings are huge. But stock market is forward-looking. When institutional investors (smart money) believe a downturn is coming, they stop bidding up the stock price any further.
So, the Numerator (Price) is restrained, while the Denominator (Earnings or EPS) is still massive (peak before the downturn). It means Forward PE becomes very cheap. That’s where retail investors get tempted to buy and get into a trap.
b. Burry’s Lesson: SELL cyclicals when they look cheap (low PE, record earnings – the cycle top). BUY cyclicals when they look expensive (high or negative PE, poor earnings or even losses – the bottom of the cycle).
Apply this Lesson to India
Bottom of the Cycle: EXAMPLE: Specialty chemicals and fluorochemicals sector in India went through a multi-year downcycle during 2024, 2026 and early 2026 due to global oversupply.
By mid-2026, this sector is nearing the bottom of this capital cycle. Old inventories (over-stocking) are exhausted globally; fresh demand is emerging.
For example: SRF is trading at a high PE of 45x, while earnings are heavily suppressed. According to Burry’s lesson, this is the buying point.
PE is high because earnings (denominator) are low. But smart investors are maintaining a high price (numerator) because they believe the cycle is turning.
Similarly, you can identify “cycle top” examples in the steel sector or auto sector (example: M&M), where PE looks comfortable due to high earnings
High PE & Record Earnings
a. India has a classic problem of extreme overvaluation in certain cyclical stocks, which become the “growth stories” of India’s future. That creates a dangerous setup for retail.
b. When a cyclical stock trades at near triple-digit PEs and record earnings, it means the market has completely rejected the idea that this business is cyclical. The market is pricing it as a business with permanent demand (like Coca-Cola).
c. Examples: Hitachi Energy 140x PE; CG Power 120x PE; ABB 95x PE; GE Vernova 94x PE; Siemens Energy 93x PE; and BHEL 86x PE are in dangerous territory.
Their business is booming (Hitachi’s revenue jumped 47% last quarter). But at 140x valuation, there is zero margin of safety. Even a minor change in future earnings guidance will create a major price drop.
d. Retail investors get trapped in the hype. But in the history of stock markets, no asset-heavy business has ever stayed in a continuous boom for too long.
As S. Naren (ICICI Pru Fund) recently said: “The moment AI & data center race cools down in the US, India’s energy sector boom will deflate.”
So, it is important to rationalize valuations for future risks and downcycles.
The Bottom Line
If you are an investor in the current cyclicals boom in India, keep a sharp eye on the second derivative of growth: whether the speed (intensity) of new order inflows is beginning to decelerate.
The moment revenue growth moves from geometric to linear, PE decompression will be swift. So, never forget your “Margin of Safety.” Buffett called them the three most important words in investing.
@arabicatrader
A brutal reminder from history
Taiwan was once called the “Republic of Casino” because stock market speculation became a national pastime
Index went 12x, wealth effects exploded everywhere, and then the entire dream collapsed in months
src : CLSA
Let Me Tell You Some Numbers & shocking truth 🔥
30-Year DSP Flexi Cap Fund
19% CAGR
34% Better than benchmark
122x Growth Since Inception
Over three decades, 60,000,000 investors moved in and out of it.
But only 23 people stayed invested for 30 years
Biggest variable of making wealth is time. Aur wahi humare paas nahi hai. Hum wahi nahi dete hain.
Why Do People Quit Early?
A 15% CAGR grows your money by nearly 16.4× in 20 years.
₹10 lakh invested for 20 years = ₹1.64 crore today.
Sounds like a miracle?
Maybe not.
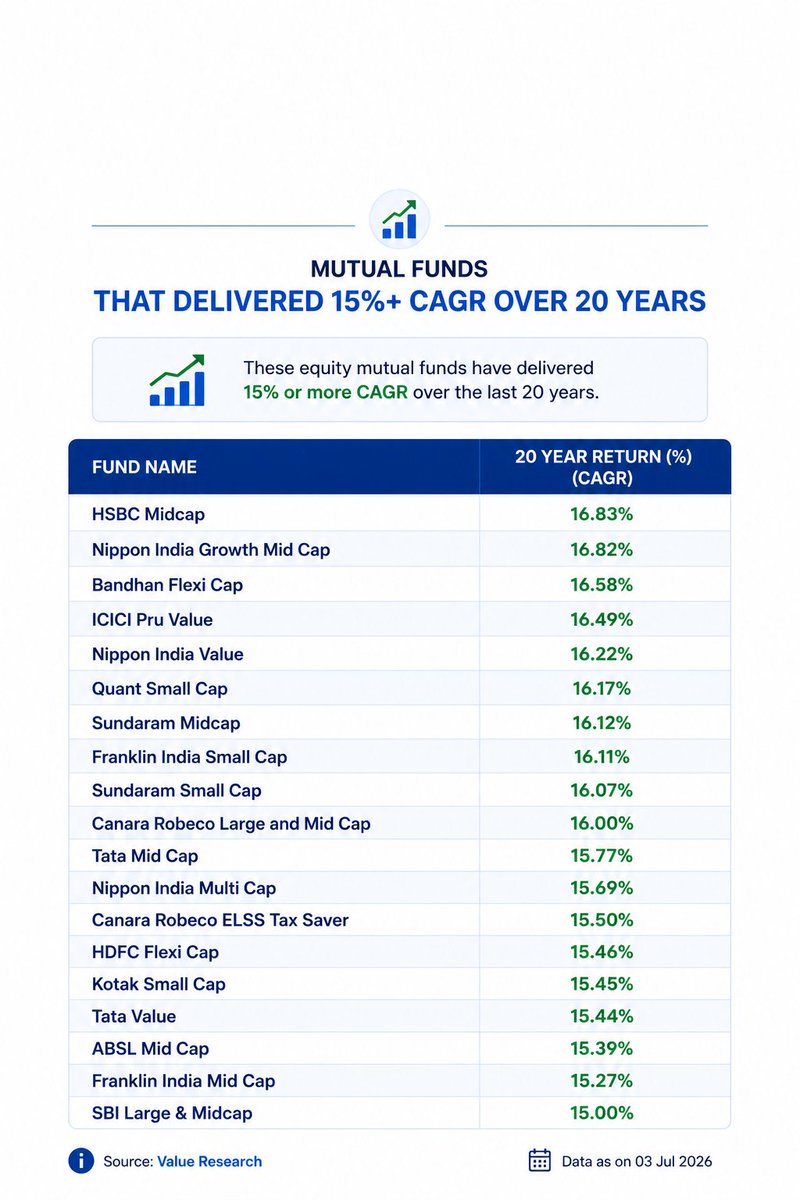
Here are mutual funds that have delivered 15%+ annualised returns over the last 20 years:👇
At 15% CAGR, a ₹10,000 monthly SIP for 20 years grows to nearly ₹1.32 crore.
Disclaimer: Not a recommendation. Past returns do not guarantee future performance.
Day 186: GDP Per Capita
🌍 A country's GDP tells you how big its economy is. GDP Per Capita tells you how prosperous its people are—on average.
GDP Per Capita is one of the most widely followed economic indicators because it measures the average economic output per person and provides insights into a country's productivity, standard of living, and long-term economic development.
📊 Formula: GDP Per Capita = Total GDP ÷ Total Population
🇮🇳 India Snapshot (FY 2025–26 Approx.)
• GDP: ₹330–350 Lakh Crore
• Population: ~145 Crore
• GDP Per Capita: ~₹2.3–2.4 Lakh per person
💡 Key Takeaway:
A rising GDP Per Capita generally reflects improving productivity and living standards but it should always be analysed alongside income distribution, inflation, employment, and other macroeconomic indicators.
An interesting interview by R Sivakumar of Axis Mutual Fund. He says:
1) India's nominal growth last year at 8% was a 20 yr low. Earnings growth also lock-step at 8%.
2) FIIs stopped paying a 20x multiple for such a low figure
3) But rate cuts & liquidity will bring back 11-12%
4) Opportunities in defence and manufacturing
5) Threat is a weak monsoon
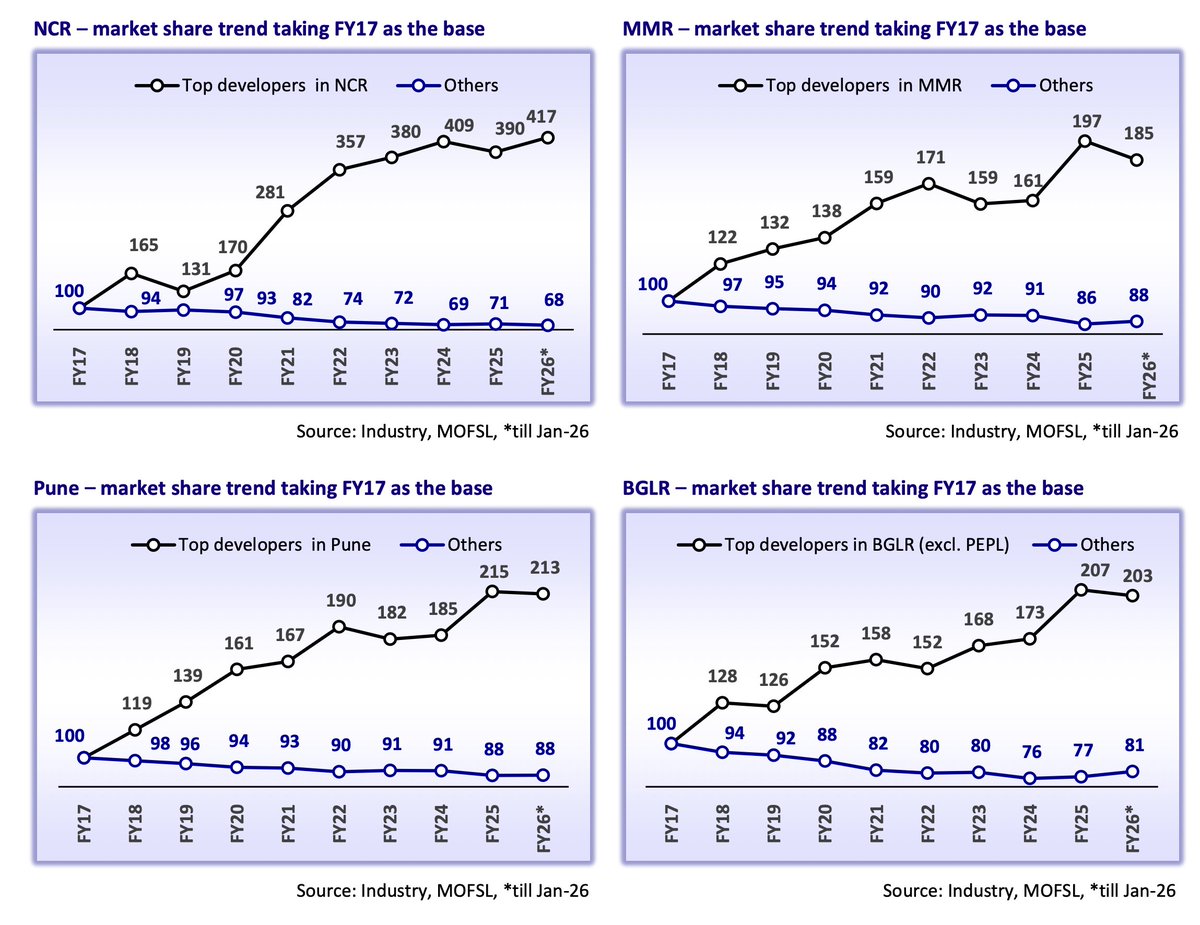
Branded developers are consistently gaining market share
This illustration says it all
Across NCR, MMR, Pune & Bengaluru branded developers have consistently gained share since FY17
Buyers are preferring branded developers because of trust, execution, timely delivery, better amenities and stronger balance sheets
src : MOFSL
A Different Perspective on Taxes and Wealth Creation
Suppose someone invested ₹1,00,000 in a Fixed Deposit that earned an average annual return of 7%. Over the years, the investment grows to approximately ₹3,86,968.
However, unlike many people assume, the interest earned on an FD is taxable every year on an accrual basis (subject to the applicable tax rules). For illustration purposes, if we compute the total tax impact over the entire period at the end, the post-tax value would be approximately ₹2,97,434.
Interestingly, very few people talk about the long-term tax impact of Fixed Deposits. Yet, when it comes to Mutual Funds, discussions often focus only on taxes while overlooking the wealth created even after paying taxes.
The real objective of investing should be maximizing post-tax wealth, not simply avoiding taxes.
This mindset is one of the reasons many middle-class investors remain in their comfort zone and miss out on the long-term wealth creation potential offered by growth-oriented investments.
This illustration is provided solely for educational purposes and should not be construed as investment or tax advice.
Fortune Investment Services (P) Ltd.
ARN: 197457
Disclaimer: Please keep in mind that mutual fund investments are exposed to market risk. Before making any investment decisions, review all scheme-related documentation thoroughly. The material of the reports is intended solely for informational purposes and should be used by the recipient. While we made significant efforts to compile the data and contents of this report, we give no promises about the logic of the assumptions or the veracity of any data. Any decisions made using this material are completely the responsibility of the recipient. We reserve the right to correct any errors or discrepancies in the reports that are discovered or brought to our attention at any time. Perform your research thoroughly before making any investments. Why? Just because it's interesting.
🚨Zerodha Life Cycle Fund-Game Changer or Hype?
Zerodha Life Cycle Funds are India’s first target-date mutual funds.
These funds come with a maturity date of 2036
These funds automatically shift from aggressive equity to safer debt/commodities as your target year approaches.
But should you actually invest? 🤔
Here is the truth: Personal finance is deeply personal.
While these funds offer a convenient, automated glide path, they use a generalized asset allocation formula.
They don't know your specific
📈risk tolerance,
📈emergency buffers, or
📈 Unique goals.
The Bottom Line:
Automated target-date funds are a fantastic tool for hands-off investors, but they cannot replace a personalized, comprehensive asset allocation strategy.
Automated products cannot entirely replace a tailored financial plan.
What are your thoughts on target-date funds for the Indian market? 👇
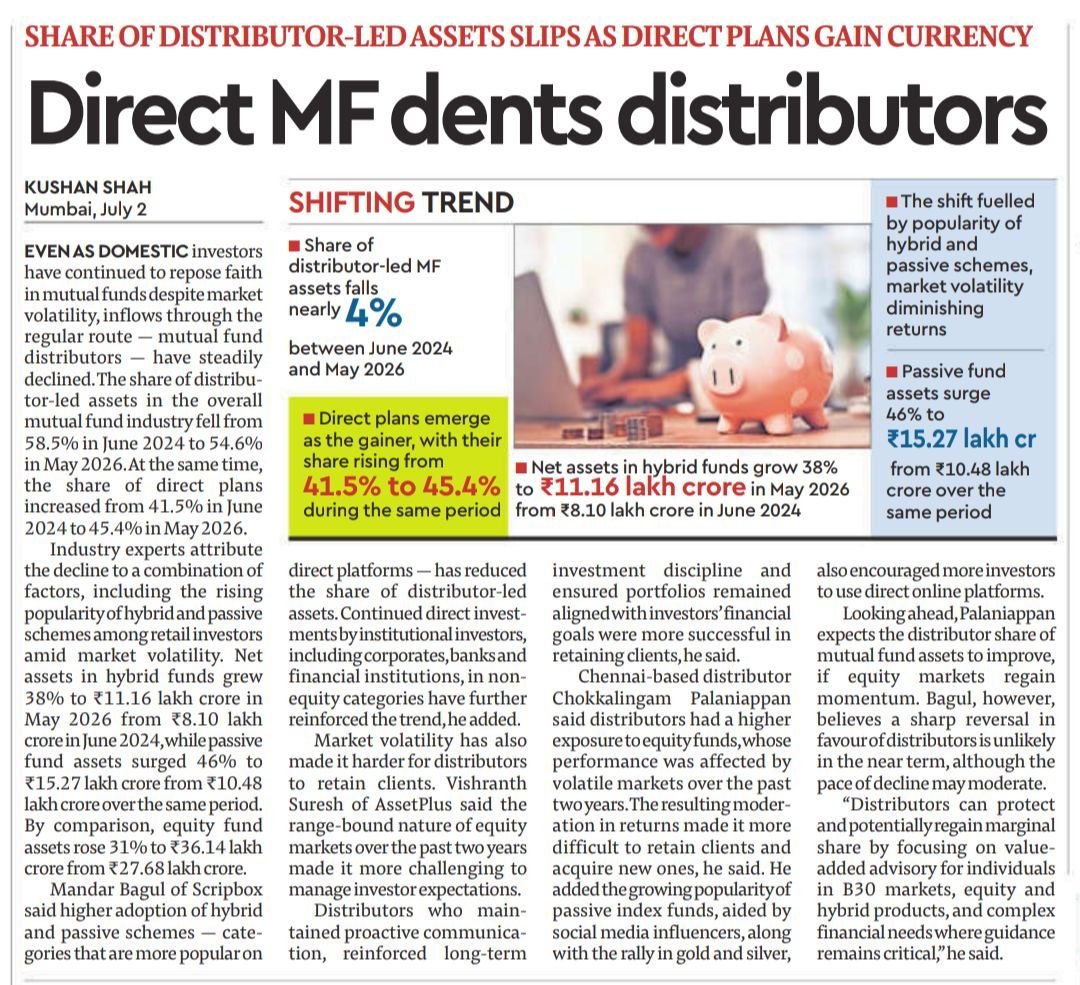
📊 India's mutual fund industry keeps evolving.
• Direct Plans: 41.5% → 45.4%
• Hybrid Fund AUM: ₹8.1L Cr → ₹11.2L Cr (+38%)
• Passive Fund AUM: ₹10.5L Cr → ₹15.3L Cr (+46%)
Indian investors are getting smarter & are gradually becoming not only more cost-conscious but more aware too.
Today @AswathDamodaran spoke truth to power. "The FUNDAMENTAL problem with the Indian market is that Indians are forced to invest in it almost at gunpoint," he said referring to the complications with investing oversees
Kudos 👏
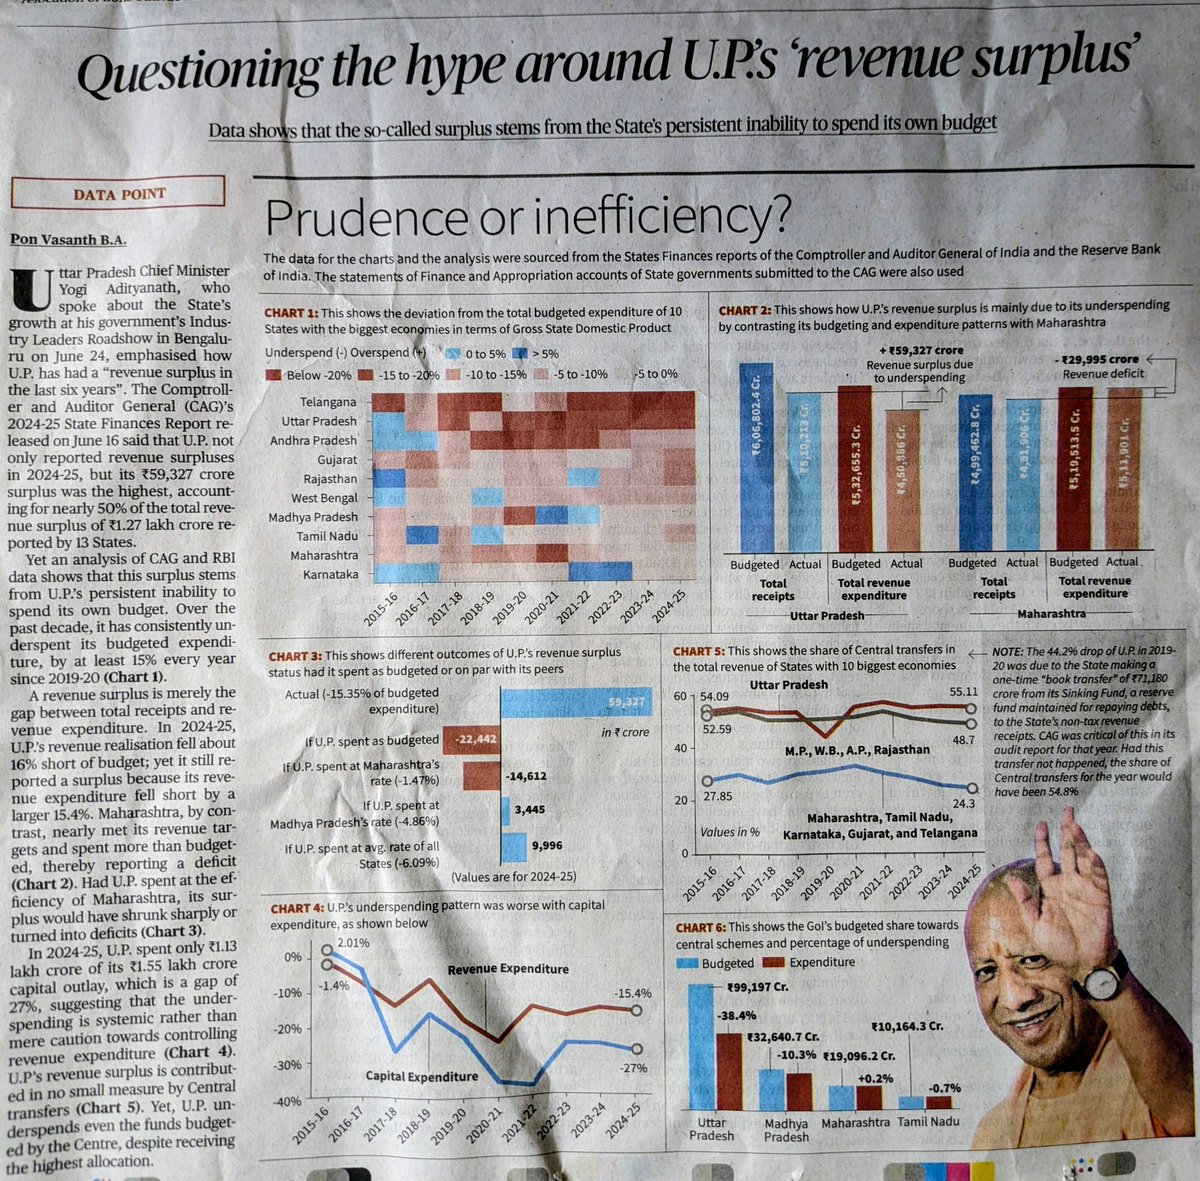
Every popular BJP handle, be it economists, businessmen, or journalists, is glorifying Uttar Pradesh for creating a revenue surplus when states like Tamil Nadu are not able to do so.
They conclude that UP excels in fiscal management.
The same is happening with GST. Despite explaining with facts and data why Tamil Nadu’s GST is relatively lower compared to its GDP, the same negative narrative continues.
Let me explain it simply using the attached article.
Imagine proudly telling your friends, "I saved ₹50,000 this month"- but the real reason was that you simply didn’t spend on bills, repairs, and important needs.
Uttar Pradesh has reported a revenue surplus of ₹59,327 crore.
According to CAG and RBI data, this mainly comes from consistently underspending its budgeted expenditure- by at least 15% every year.
Funds meant for roads, schools, and hospitals remain unutilised.
A revenue surplus driven by underspending does not necessarily mean stronger fiscal management.
Real performance is better measured by how effectively funds are spent on public services and development.
Similarly, Tamil Nadu’s GST collections appear relatively lower as a share of its large GDP. This is largely because the state produces a lot more than it consumes, with a big manufacturing and export base leading to higher input tax credits and inter-state supplies.
This structural difference is often overlooked and misconstrued as weaker tax performance when comparing states with different economies.
Data helps us understand the full picture beyond headlines.