As of today, @OptimyzeCloud is a part of @elastic :-) -- we're looking forward to integrating our tech and bringing frictionless continuous whole-system profiling to the entire Elastic ecosystem :-) - and combining it with logs, metrics, traces, and alerting!
Allright. As of today, we (as in @OptimyzeCloud) are all part of @elastic. What a crazy ride. I will take a couple days off, and then there's a mountain of work to tackle :-) -- from ARM64 support to .Net to making sure you can continuously profile on-prem and integrate ...
New blog post by @seanhn! https://t.co/1gMFaU6S0n Performance analysis of K2, an optimising compiler for eBPF, with Prodfiler.
Outcome: 1.4x-1.9x speedup via a new memory allocator, mods to allow autovectorisation, and PGO/LTO.
This talk from @rakyll provides a great overview of using eBPF for observability in microservices which I've never had to think about before but now spend a lot of time thinking about thanks to Astra DB
https://t.co/22GWWJQOH1
.@OptimyzeCloud CEO Thomas Duillen wrote this fantastic blog about delving into how kubelet was eating up CPU and IOPs. Read this, then register for #P99CONF, the free online conference where he'll be speaking. https://t.co/xeMjSRF9Lq
"what is clear is that this tool is super awesome and provides an unseen level of visibility" <- anonymous user feedback of the best kind :-)
https://t.co/sICmhaOxYU :-)
It is alive! Introducing Prodfiler, the world's first frictionless whole-fleet whole-system continuous profiler: https://t.co/kEEi3Cg2CV -- profile all your code, everywhere, all the time.
Try it today :-)
@baiwfg2@dendibakh If you have an *unstripped* version of the binary somewhere, and can upload it to the backend, then yes. Traces are symbolized in the backend after collection.
We do have some ideas on how to generate readable stack traces if you only have a *similar* unstripped version, but ...
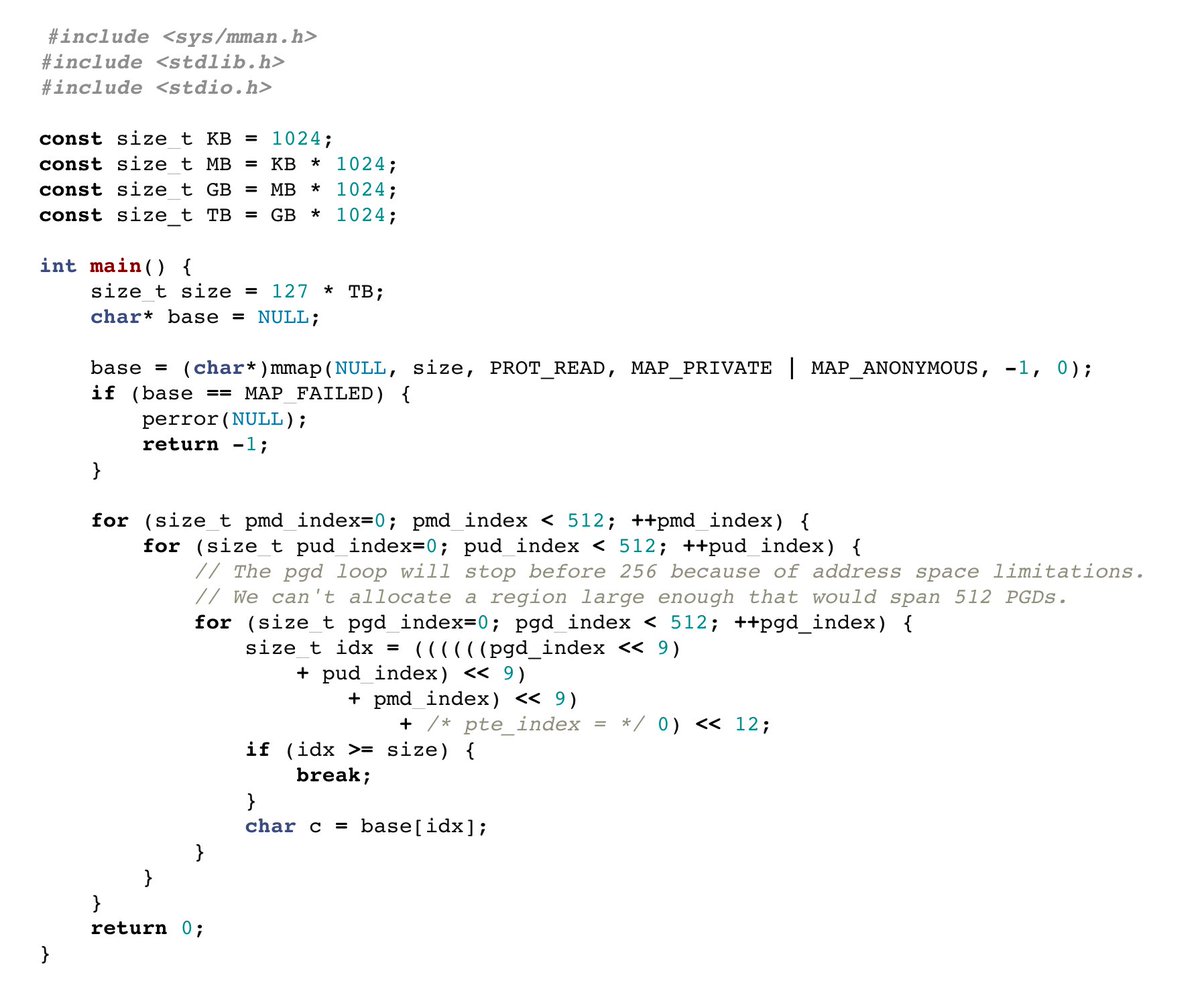
If you like kernel deep dives, you'll like this. @vic_mic_ did a followup for my demand paging piece, with a performance focus, covering a LOT that I missed.
My favorite part: the clever page-table fu that triggers pathological kernel allocation behavior via a top-down scan. 🥋
New blog post: @vic_mic_ takes Prodfiler down into the depths of the Linux memory management system ... to examine "The OOMsday device".
https://t.co/41jOMTwcJR
fun things prodfiler by @OptimyzeCloud tells me about my servers. It takes more CPU cycles to handle logging mechanism then to serve my cluster of websites :P. Also recently encountered a scenario where server was functional till ELK filebeat was started then the beat was gone
@footePGH@OptimyzeCloud FYI: we wrote a further blog post on the matter with more analysis and a neat example on fuzzer performance issues: "A stroll down fuzzer optimisation lane and why instrumentation policies matter" https://t.co/uWVxMPI8UF