Fluent Bit vs Fluentd isn’t a fight - it’s evolution.
Fluent Bit: fast, <1MB, CNCF-grad, OTLP-native, built for K8s.
Fluentd: rich plugins, great for legacy.
Right Tool. Right Place.
#FluentBit#OpenTelemetry#CloudNative#Observability
@thatoppsdev Agree, but I think even when data is technically “structured”, teams still struggle to connect it across tools in real time. During incidents, it’s not just about having the data, it’s about stitching the story fast enough to act.
Can you have too much observability?
Not too much data, but too many places to look.
One team told me they use:
🔹 3 logging tools
🔹 2 metrics platforms
🔹 A tracing system
🔹 APM dashboards
All “integrated.” Yet still a lot of tab-switching during incidents.
How much of your observability time is spent debugging… the observability stack?
Most teams say the same:
They’re fixing pipelines, not apps.
🪠 Broken parsers
🧩 Failed enrichments
⚙️ Re-indexing hell
Tools meant to help us debug need debugging.
#Observability#DevOps#SRE
“I still open 5 tabs during outages.
They just all have the same logo now.”
A report says 27% of orgs have full-stack observability.
I’d bet it’s closer to 5%
Does your “unified” platform actually unify during incidents?
Or is it just better branding?
Most “full-stack observability” is just three tools with SSO.
What you actually get:
“Here’s the log. Now click here for metrics. Now here for the trace. Now correlate it yourself.”
Someone said it perfectly:
“We consolidated vendors, not products.”
👉🏻 Real-time searchability without rehydration
👉🏻Massive reduction in compute and storage costs
👉🏻Seamless scalability and high availability
👉🏻No need to manage hot/cold index tiers
This architecture simplifies operations and future-proofs your observability stack.
Why store everything in expensive databases when you can leverage cold storage for long-term log retention?
By writing log data directly to S3-compatible cold storage and keeping only the most recent data (e.g., last 60 seconds) on disk, we can unlock:
Calling observability isn't just about handling more data; it's about ensuring the system doesn't collapse under its own weight.
👉 What's the biggest scaling pain you've seen in observability pipelines?
- Costs increase with each additional GB processed.
- Pipelines are slow due to parsing, enrichment, and fan-outs.
- Complexity grows with configurations, schemas, data loss, and delays.
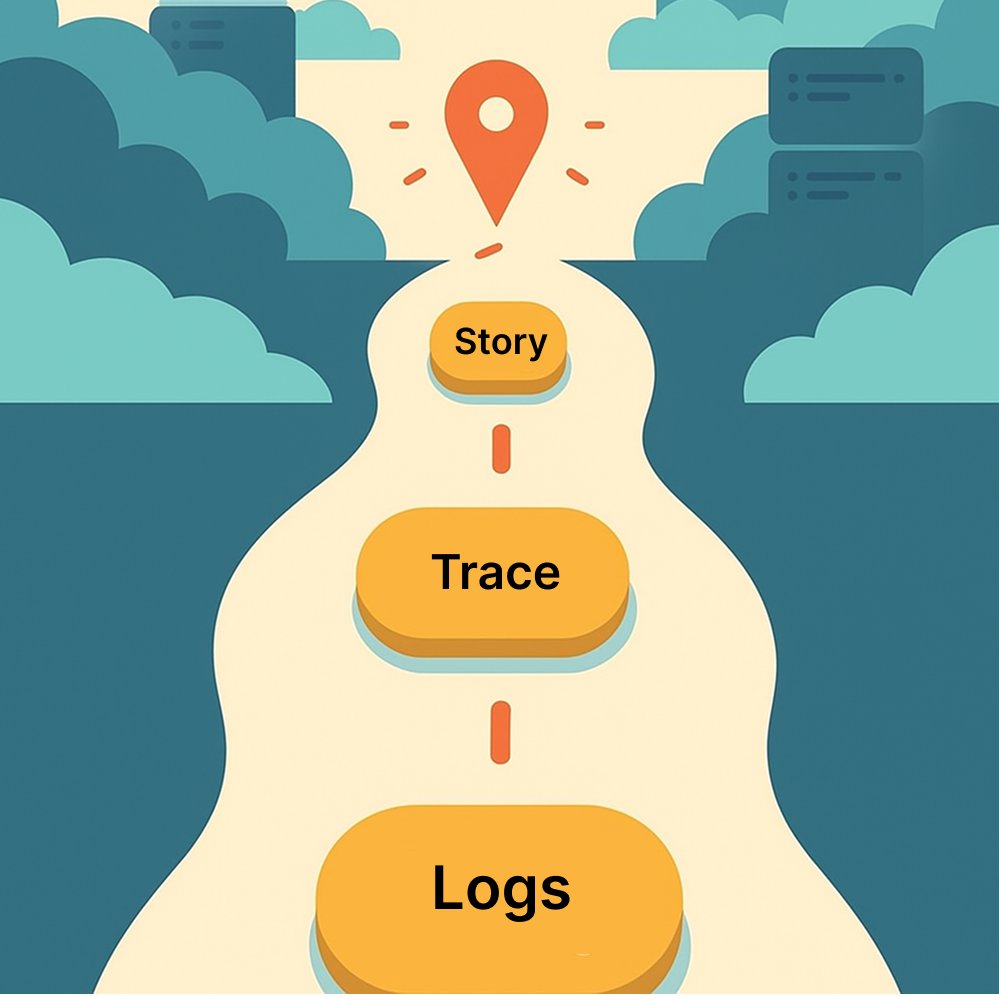
Without correlation → you’re stuck jumping between dashboards, piecing clues together.
With correlation → you get a single, connected story of the incident. And in modern distributed systems, that’s the difference between a 3-hr outage and a 30-min fix.
Logs tell you what broke.
Traces tell you where.
Together? They tell you why.
On their own:
Logs are detailed, but noisy.
Traces map flows, but miss the fine-grain events.
When you correlate logs and traces:
- You connect an error log directly to the request that caused it.
- You see exactly how that request traveled across services.
- You understand blast radius - which users, which regions, which downstream calls were hit.
1️⃣ Correlation, logs, traces, services that talk to each other.
2️⃣ Schema-less search, no surprises when data changes.
3️⃣ Storing what matters, not duplicating everything.
Funny how most observability tools are great at collecting data, but terrible at helping you act on it fast.
The goal isn’t more dashboards. It’s faster answers.
What’s one thing you wish your observability tool did better? 👀 #Observability#DevTools#LogManagement
Back after a while!
A new product. A new obsession with making observability less painful.
Hello again, X. Let’s catch up. 👋 #CloudNative#Observability