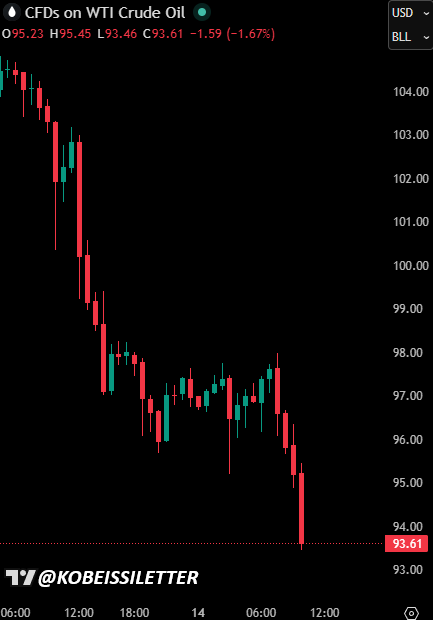
Oil prices decline as markets discount a new round of negotiations.
The fact that oil prices correct with the latest US action on the Strait of Hormuz shows that markets may be discounting that a significant part of the traffic is rerouted or offset by other exporters.
The forward curve remains in steep backwardation.
via Bloomberg
@DrJStrategy Chokepoints like Hormuz and Malacca highlight how geopolitics can disrupt trade and energy flows simultaneously. Even if some regions benefit strategically, markets tend to price the immediate effect: higher risk premia, tighter liquidity, and slower global growth.
INVESTORS SEE OIL FALLING, GROWTH OUTLOOK WEAKENS
A Bank of America survey shows most investors expect Brent oil to ease to $80–$90 by year-end, down from near $100.
Sentiment is the most bearish in 10 months, though few predict a recession. Forecasts are mixed, with most seeing oil between $70 and $100 and only 6% above $100.
A net 36% expect a weaker global economy, but 52% still anticipate a soft landing. Equity exposure has dropped sharply, while most investors expect Fed rate cuts and ECB hikes over the next year.
Lower oil expectations alongside reduced equity exposure suggests positioning is turning cautious, not outright bearish. If growth stabilizes, that setup can create room for re-risking. The key is whether expectations prove too pessimistic.
INVESTORS SEE OIL FALLING, GROWTH OUTLOOK WEAKENS
A Bank of America survey shows most investors expect Brent oil to ease to $80–$90 by year-end, down from near $100.
Sentiment is the most bearish in 10 months, though few predict a recession. Forecasts are mixed, with most seeing oil between $70 and $100 and only 6% above $100.
A net 36% expect a weaker global economy, but 52% still anticipate a soft landing. Equity exposure has dropped sharply, while most investors expect Fed rate cuts and ECB hikes over the next year.
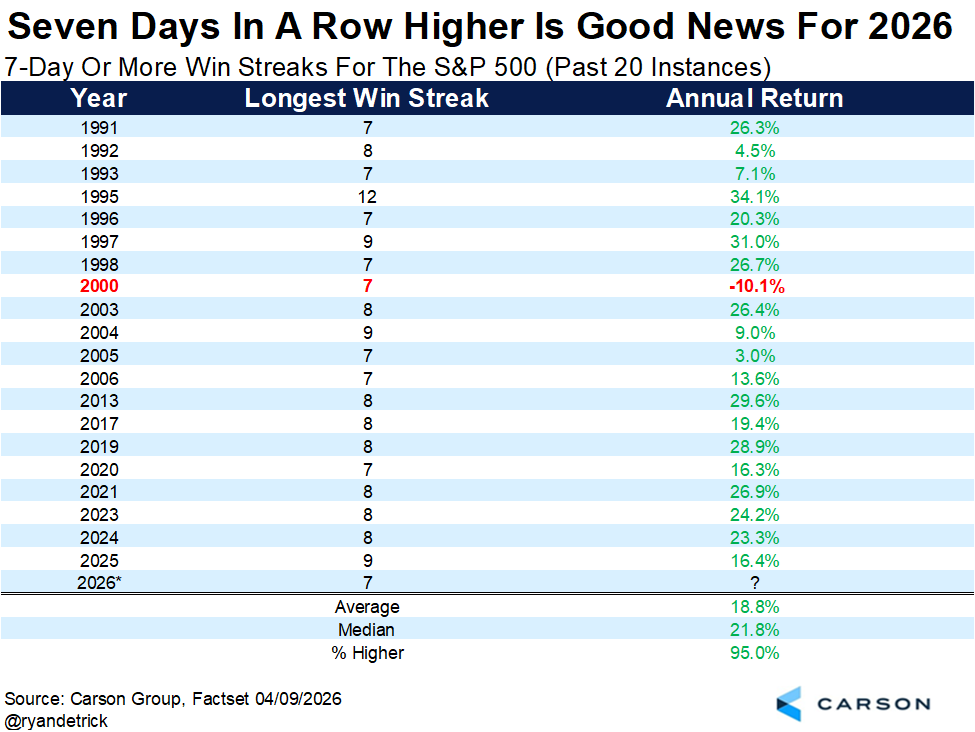
Still amazes me that years that had a 7-day win streak have been higher 19 of the past 20 years.
Yes, any one piece of data like this is random, but stacked on top of the many other bullish developments, this does little to change our opinion that 2026 will still be a good one for investors.
BREAKING: US oil prices extend losses to nearly -6% on the day and drop below $94/barrel.
Oil prices are now down -11% since the US Military's "blockade" of the Strait of Hormuz began 24 hours ago.
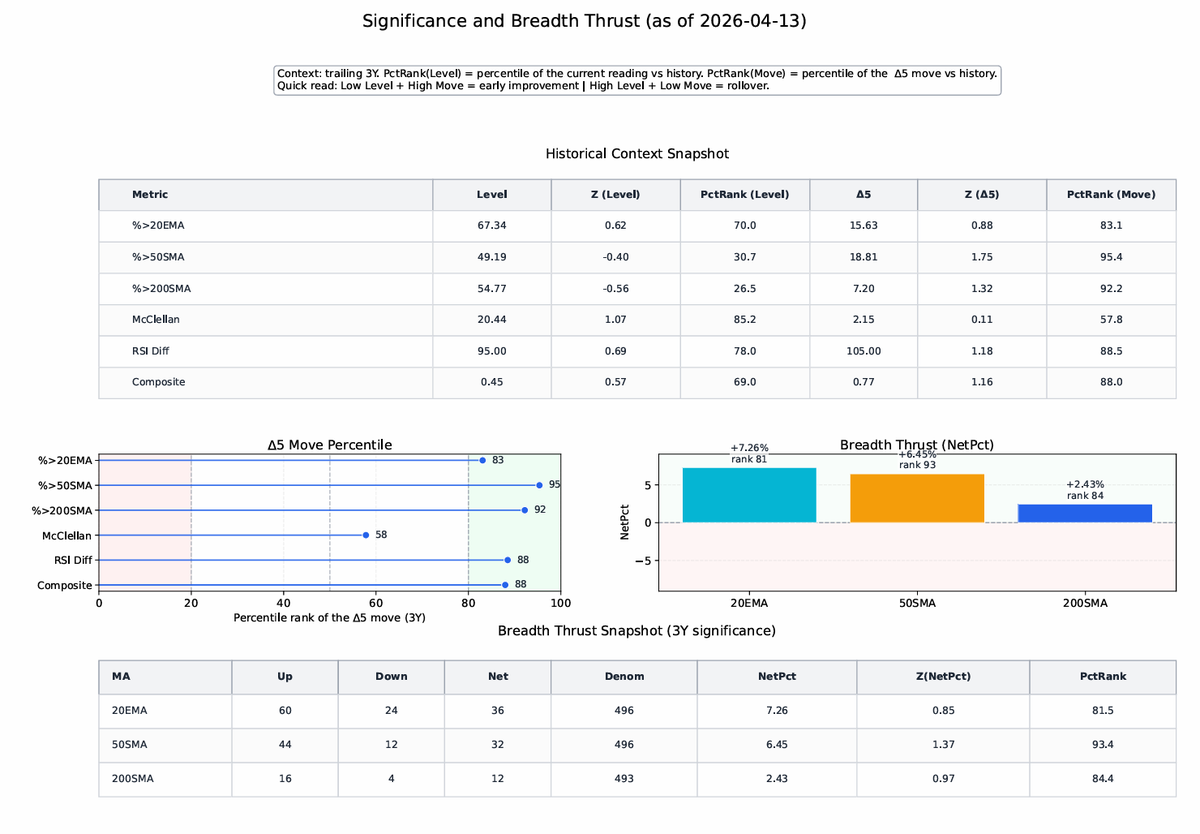
Breadth:
We’ve seen a strong positive breadth thrust off the lows, which has helped establish the near-term bottom. With SPX up roughly 9% and many stocks moving out of bearish momentum phases, it’s time to begin adjusting the books as forward return profiles are no longer as favorable as they were at the lows.
Reducing leverage is prudent, while maintaining core positions and growth names acquired during the selloff remains the preferred approach. Breadth suggests indices have moved far enough that adding here offers poor forward returns, but not enough to warrant selling at this time.
Per @ICI (Investment Company Institute), 4Q25 U.S. retirement assets increased to $49.1T, up $1T from 3Q25…largest share of assets were in IRAs followed by defined-contribution (DC) plans and government defined-benefit (DB) plans
@DataArbor
@EricBalchunas Markets often climb despite skepticism when positioning is cautious. If investors stay underexposed, flows can support the move. The key isn’t sentiment alone, but whether liquidity and exposure continue to rebuild underneath.
@DrJStrategy Narratives often follow price, not lead it. When positioning resets at extremes, moves can unfold before consensus adjusts. The focus is less on commentary and more on how flows and rates shifts drive the cycle.
@KobeissiLetter Backwardation signals tight near-term supply even if prices pull back. When storage is penalized, it discourages inventory builds. That keeps the market sensitive to disruptions, even as headline prices suggest easing inflation pressure.
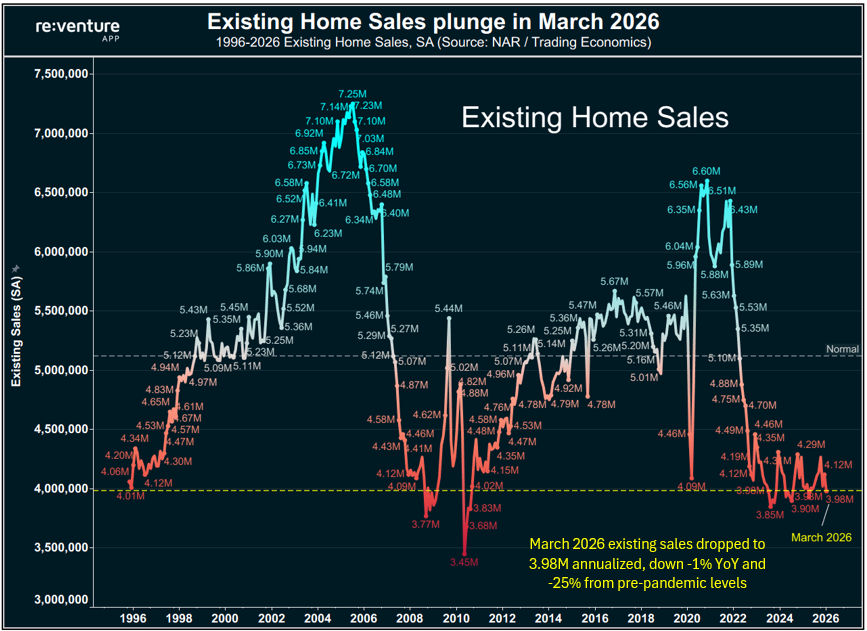
The U.S. Housing Market is in a full-fledged depression.
Existing sales in March just hit their 2nd lowest level ever for the month, behind only 2009.
Not only that - sales volumes are down 25% from pre-pandemic norms and continue to drop YoY.
Why is this happening? Simple: sky-high prices.
Even though values are starting to drop in many markets, overall price levels remain disconnected from what buyers can pay.
So they're not buying. A concerning signal for the Spring/Summer housing market. Sellers better get ready to cut the price.
To track sales for your city, download Reventure and hit Home Sales Surplus/Deficit: https://t.co/50vYuH88dW
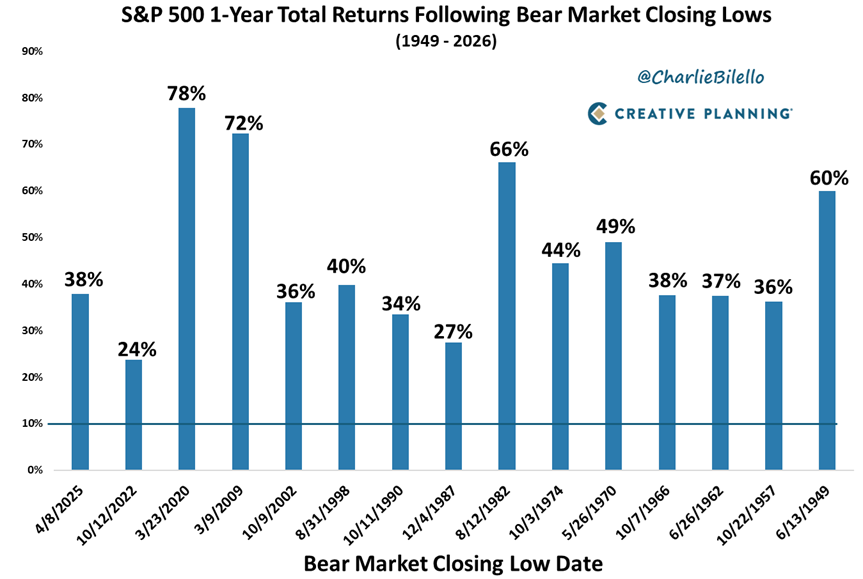
Every time the market feels the worst, it’s the beginning of something better.
Since 1949, the S&P 500 has returned +38% on average in the year after bear market lows.
The hardest time to invest is when the biggest opportunities appear.
This will come as a relief to many, including the Federal Reserve:
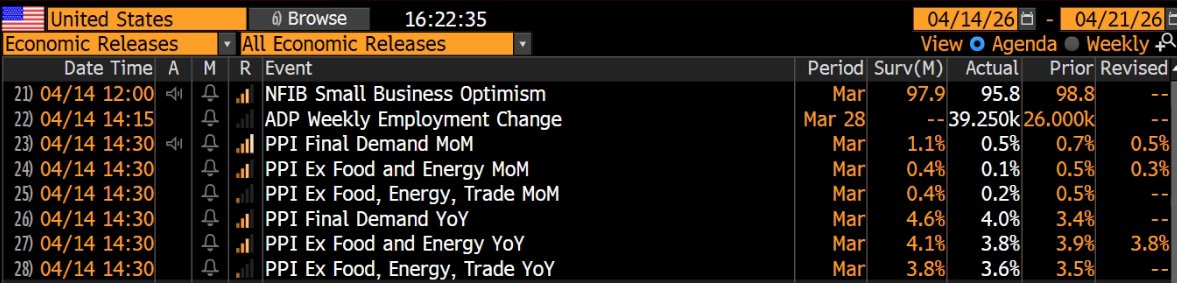
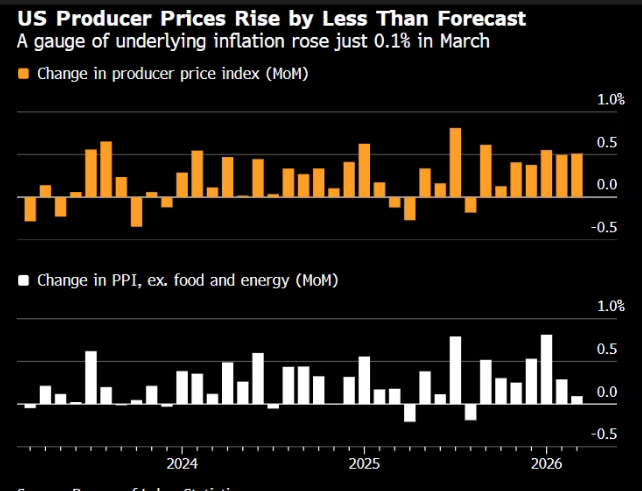
Monthly US PPI inflation was 0.5% in March, less than half the consensus forecast.
America's diversified economy and its energy security are again distinguishing its economic performance from much of the rest of the world.
#economy
US🇺🇸 producer prices came in better than consensus expected, despite energy pricing pressures.
PPI is up 0.5% m/m and 4.0% y/y in March, with core at 0.2% m/m and 3.6% y/y, while ADP shows positive private job gains (+62k) and pay growth at 4.5% y/y, a mix of better-than-feared inflation and decent employment that should keep the Fed rate cut path and growth estimates at +2.2-2.3%.
Markets are holding up even with yields still elevated. That kind of resilience often comes from positioning resetting after recent caution. With liquidity not meaningfully improving, today’s strength looks more flow-driven than a shift in the macro backdrop.
Another day where the macro backdrop did the anchoring. Yields held firm and liquidity stayed selective, keeping financial conditions tight. Risk assets are moving, but still within the limits set by the cost of capital.
BREAKING: The US personal savings rate dropped -0.5 percentage points in February, to 4.0%, the 2nd-lowest since November 2022.
Excluding 2022, savings rates are now at their lowest levels since the 2008 Financial Crisis.
In 2022, elevated inflation eroded purchasing power, forcing American households to spend more on essentials.
The savings rate has declined -1.5 percentage points since April 2025.
Furthermore, real disposable income growth has weakened, limiting the ability of consumers to rebuild savings.
By comparison, the last 5-year's average was 6.5%, while the 5-year pre-pandemic average stood at 6.0%.
Households are struggling to save money.
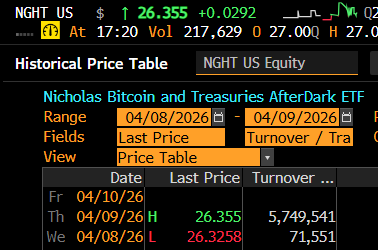
Lost in all the fanfare of $MSBT launching was that The Bitcoin After Dark ETF $NGHT also launched Wed. And it was meh volume first day but big jump on Day Two. Will be fun to compare these two, Day vs Night over the months and years. Our research via @psarofagis has found night did much better, but a) if you hold MSBT you get the day + night returns anyway so it doesn't matter for long term holder of etfs b) by the time they launch an ETF based on some unusual premium it sometimes goes away.. they tried NightShares with S&P and no one cared. Prob if $NGHT crushes flows will come, if not, oblivion. $MSBT will be a hit regardless bc of distro