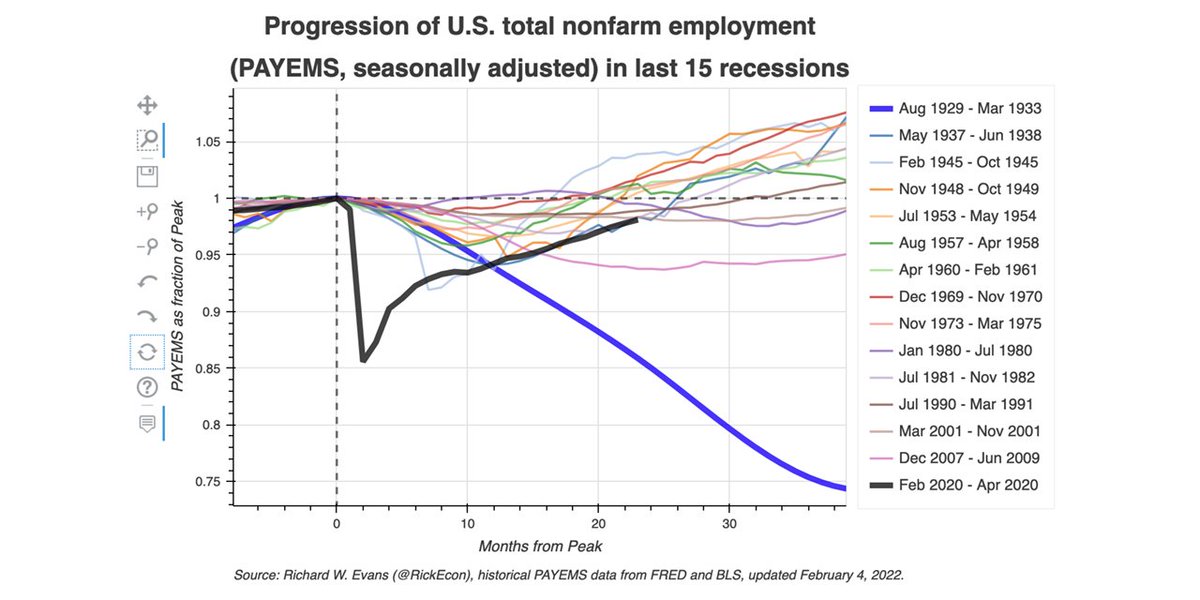
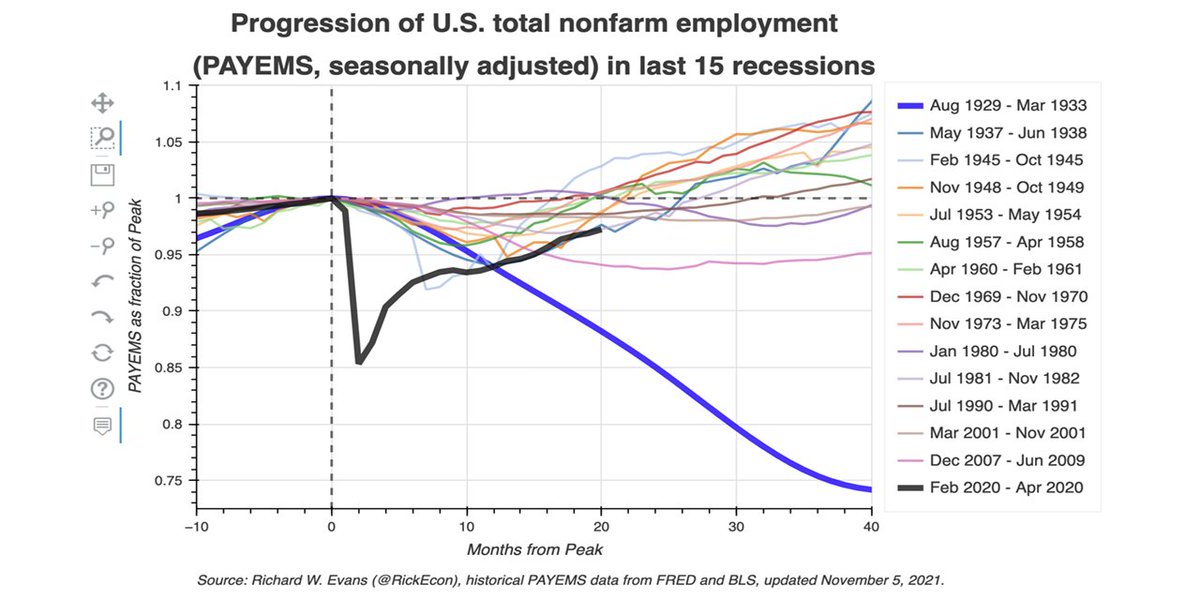
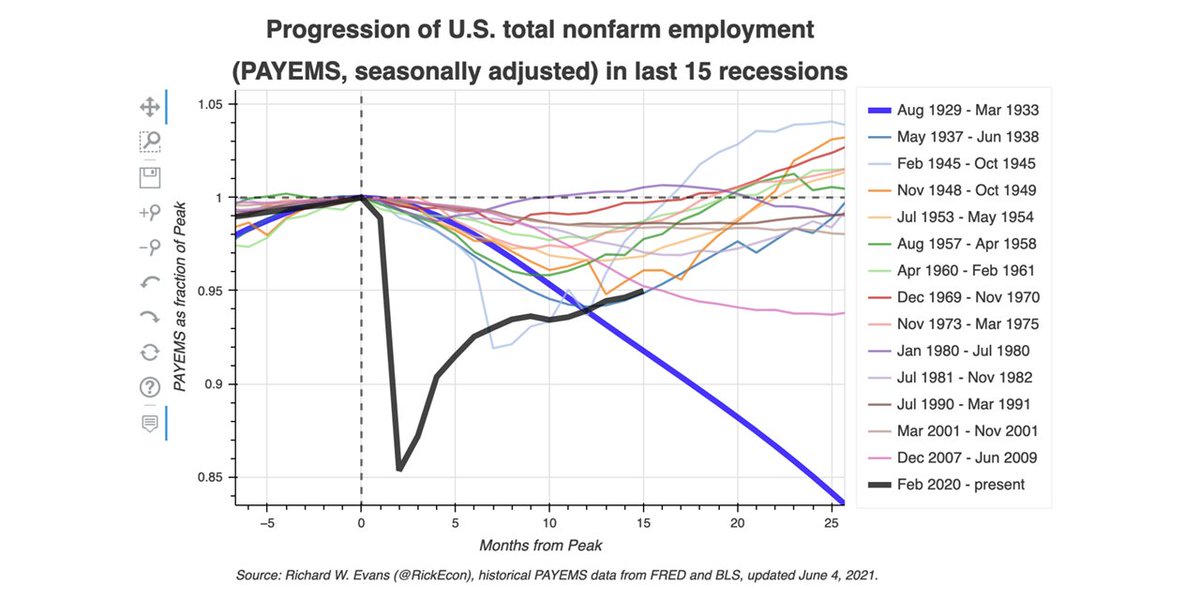
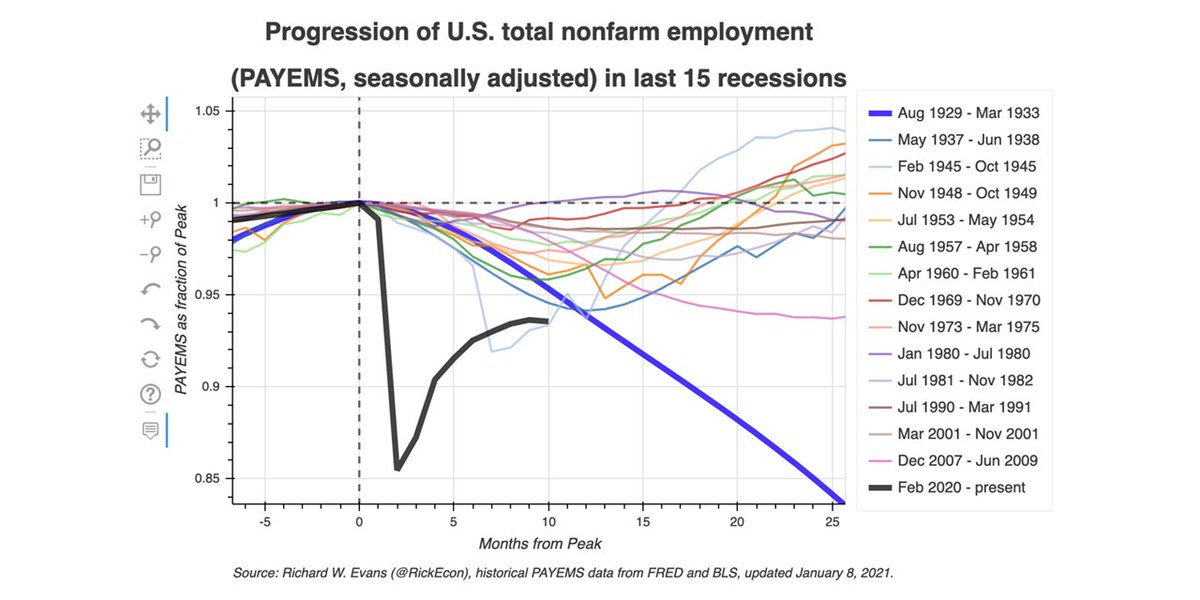
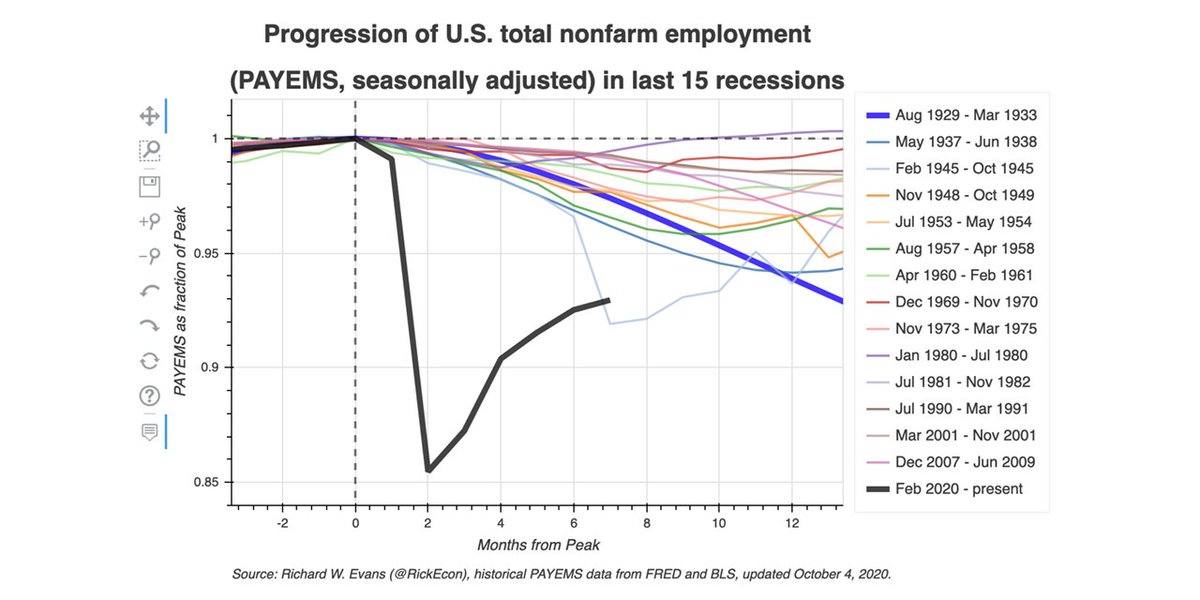
Today's jobs report wasn't great, but not that bad. But the recovery since Feb 2020 (bold black) has been the slowest of all 15 recessions of last 100 years, except for the #GreatDepression (bold blue) and #GreatRecession (light pink).
Dynamic dataviz:
https://t.co/WL2z4V8aqm
The steady but slow recovery of the U.S. labor market from the Feb. 2020 #COVID#recession. Current labor market (bold black) is better at this point of the recovery than the Great Depression (bold blue) and the Great Recession (pink), but still behind the other 12 recoveries.
Very much looking forward to presenting "Global Uncertainty Quantification in a Stochastic Climate-Economy Model" (joint work with @FelixKubler @alexa_malova and Takafumi Usui) @HCM_Bonn -- exciting workshop on "High Dimensionality and Data Analysis” by @LenaJanys @domliebl
The Timber Moose Lodge is where I want to hold my next conference. Would be great for macro modeling of fiscal policy, open source policy modeling. @Baker_CPF @OpenRG@OSE_Lab@cgousu
Watch “Flythru video of America's Biggest Log Cabin” on #Vimeo https://t.co/Fju3wCA8q7
Still pretty anemic U.S. jobs recovery (bold black line), still down 5% from Feb. 2020 peak, and still worse than 12 of the last 14 recessions (back to 1929) at this point in the recovery.
https://t.co/WL2z4V8aqm
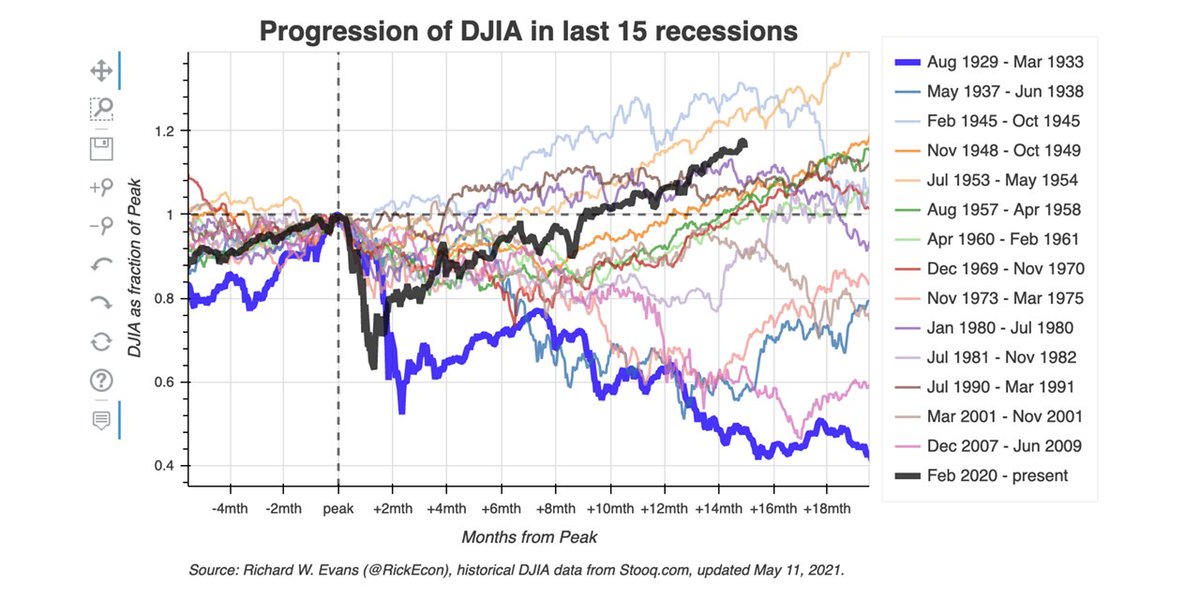
Amazing that U.S. stock prices in the current recession (bold black line, #DJIA) fell faster than any of the previous 14 recessions, incl. the Great Depression (bold blue line), and recovered faster than all but two (1945, 1953) of the last 14 recessions.
https://t.co/LbHcBGBtMx
An updated dynamic #dataviz with Apr. 2021 data comparing U.S. nonfarm employment in most recent 15 recessions--from current COVID recession (bold black line) back to Great Depression (bold blue).
https://t.co/WL2z4V8aqm
New Quantitative Note, "Revenue and Distributional Impacts of the American Rescue Plan Act" by @jasondebacker, @RickEcon, @MaxGhenis, Cody Kallen. Deep dive into distributional effects of #ARPA using @PSLmodels Tax-Calculator open-source microsim model.
https://t.co/ObDT1hi9Y2
Today's U.S. employment report showing job growth of +379k jobs in Feb is best described as "not bad", taken literally. 12 months out from Feb 2020 empl peak, and jobs are still down 6.2%, on par with Great Depression (1929), 1937 and 1945 recessions.
https://t.co/WL2z4V8aqm
🚨Paper alert 🚨
New working paper entitled: Deep Structural Estimation: With an Application to Option Pricing (https://t.co/IHraeLtiuY), joint work with Hui Chen (MIT), @AntoineDidishe1 (HEC Lausanne)
January 2021 U.S. employment numbers are out. This dynamic #dataviz shows that the current #COVID19#recession at 11 months (bold black) is worse than any of the previous 14 recessions after 11 months, including the Great Depression (bold blue).
https://t.co/WL2z4V8aqm
I spend the first 3 min 45 sec of my @PSLmodels OG-USA demo video soapboxing the importance of policy models being #opensource, especially in the current U.S. environment of political polarization. Open source models are fundamentally apolitical.
https://t.co/OwJt6i9ZXG
My Jan. 11 @PSLmodels Demo Day presentation on using the #opensource OG-USA macroeconomic model from is up on the PSL Youtube channel (I recommend playback speed of 1.25 or 1.5). Always happy to answer any questions about the OG-USA model.
https://t.co/h3xoWPfl5X
Updated dynamic #dataviz by @RickEcon of U.S. employment across the last 15 recessions, from current #COVID19#recession (bold black) to Great Depression (bold blue). New Dec. 2020 data show first decline in 7 months.
https://t.co/UVeq53NK46
Updated dynamic #dataviz@OSE_Lab gallery of U.S. emplymt growth comparisons over the last 15 recessions--current #COVID#recession (bold black line) back to #GreatDepression (bold blue line). Will be long time before we return to Feb. 2020 peak numbers.
https://t.co/tlYy4Uqjr0
All source code for the DJIA plot is available in this GitHub repository. Running the code will go download the most recent DJIA closing data and update the plot, by default.
https://t.co/v99TNhwZJQ
The @OSE_Lab visualizations gallery has a new (posted June 2020) dynamic #dataviz showing performance of the @DowJones Industrial Average stock index in the last 15 recessions, from #GreatDepression (1929) to current #COVID19#recession.
https://t.co/z1Mll2CdQ5