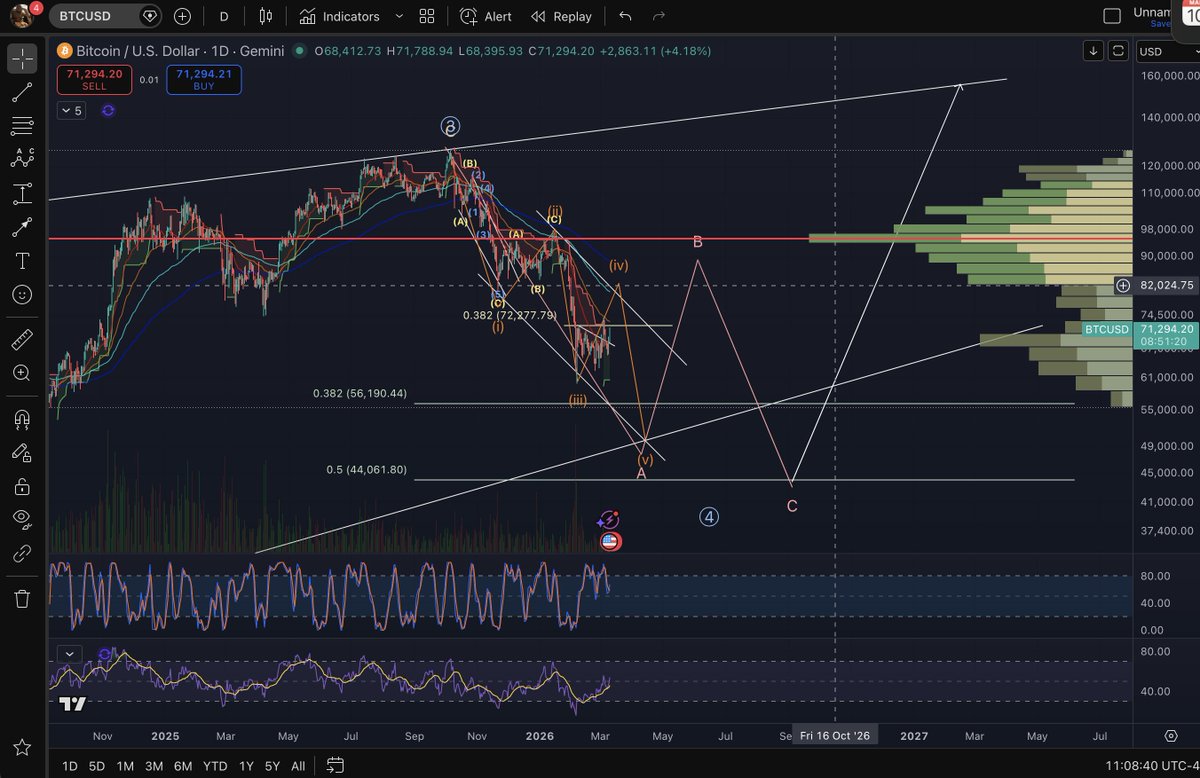
$BTC 16 for 16 🤝
TP 1 on longs form marginal low if taken on BTC is my bias here - TP2 being 83k, SL at BE.
The marginally higher low here was from advanced fractal time and price geometry theory (self discovered)
I'm still looking to exit TP2 on the 62.5k BTC entries at 83k (if given).
Playing alts should give higher RR on any upside
Especially given the altseason ideal time cycle low has hit right on schedule early 5-9 Feb 2026 - as I publicly shared, preplanned since September 2025. (TOTAL3ES/TOTAL chart)
On a drop on BTC into May 7 ish, I could look for HTF channel Highs to be flipped to support &/or 76-77k if BTC hits 83k between now 22 April - 2-May 2026
BTC does not need to go to ATHs or even 103k for bullish moves on alts,
BTC could simply chop around and alts pop big - before correction into July & Q4 2026, where a real move on the new wave of alts begins.
Let me know if I should do an altseason breakdown on my YouTube Channel - a first public TA video (Would be out of my comfort zone for sure!)
~ #BTC#GANN ~
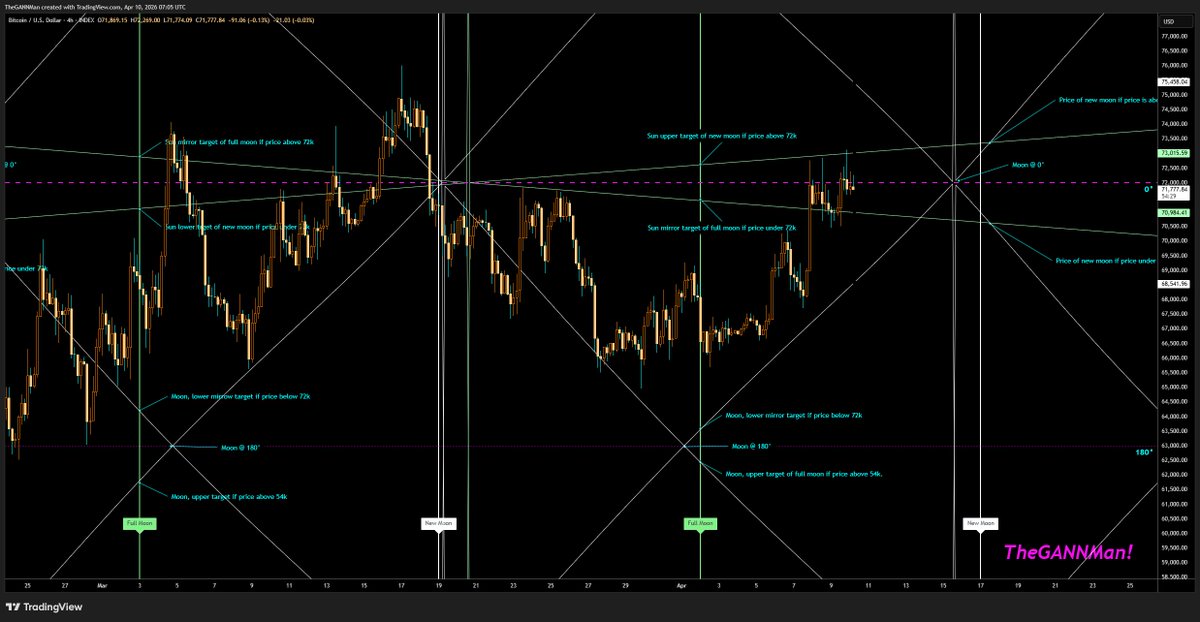
Moon Chart! 🌛🌜
Nice move up so far, but am I excited, nope.
Not until we claim and stay above 72k by the time the New Moon comes around.
15-17/4 is my date range.
If you follow me, you know the drill, time is more important than price. Failure to stay above 72k by then, and 63k remains in the game. 🔥🔥
The blue circle has already played a role this cycle. The circle provided descending support during early 2025 and the tariff liquidations bottom came at this circle.
Similarly, the circle provided descending support during the 2022 bear market and the bottom came at the circle.
The 2018 bull run bottomed at the blue circle, the Covid liquidation low hit the blue circle too.
Unlike 2022, the recent contact with the circle comes past the mid-point. Which means the circle should now provide ascending support (similar to 2018 and at the start of the 2017 bull run).
Another noteworthy observation is that, should $BTC lose level 4 and start to trade in the box lower, I will be forced to draw a fib circle for the first time that will be lower than the previous one, creating the first red box on the chart.
~ #BTC#GANN ~
#BTC has closed 2 consecutive months under the 50% level of the entire Bull Market range.
This puts it in a weak position according to W.D.Gann!
The chart below is what everyone is bullish about. Whilst bounces always happen, we are anything but Bullish. Dont talk Bullish until we at min claim 98k.
For me, the way I see the market.
Bulls need to reclaim 72k as a start before I will accept any possible higher prices to follow.
Bears, need to claim 63k with a weekly close in order to see lower prices. 🔥🔥
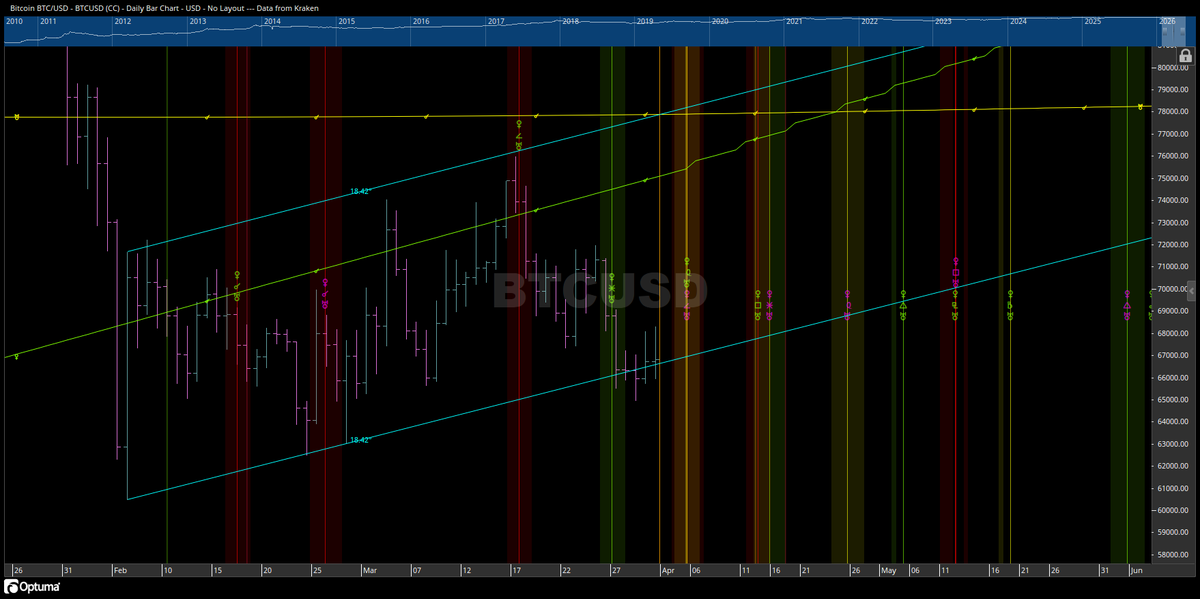
No bull. No bear. Just geometry breathing. Next week around April 7th is in focus. We sit near the Value Area Low
The structure is clear: Sweep the lows. Reclaim the level. Then long.
We can dance inside this range for many months. Macro remains bearish… yet the chart still pays those who read the geometry correctly. Trade the range. Make money in any environment.
The architecture never lies. 📐👁️
What are you seeing in the structure? Drop your sign or your plan below.
#FinancialAstrology #BTC #MarketGeometry $BTC
Uranus enters Gemini — April 25th ♅♊
The planet of revolution awakens. Bitcoin has always danced to Uranus’ lightning.
Around those days, strong natal Venus aspects kiss the chart.
If the alignment holds… a sharp rally may unfold toward a June top, followed by the descent into the September–October bottom.
The geometry is whispering.
What do you feel? Drop your sign or your vision below 👁️
#FinancialAstrology #UranusInGemini #BTC #MarketGeometry $BTC
Chart Powered by @gann_trader
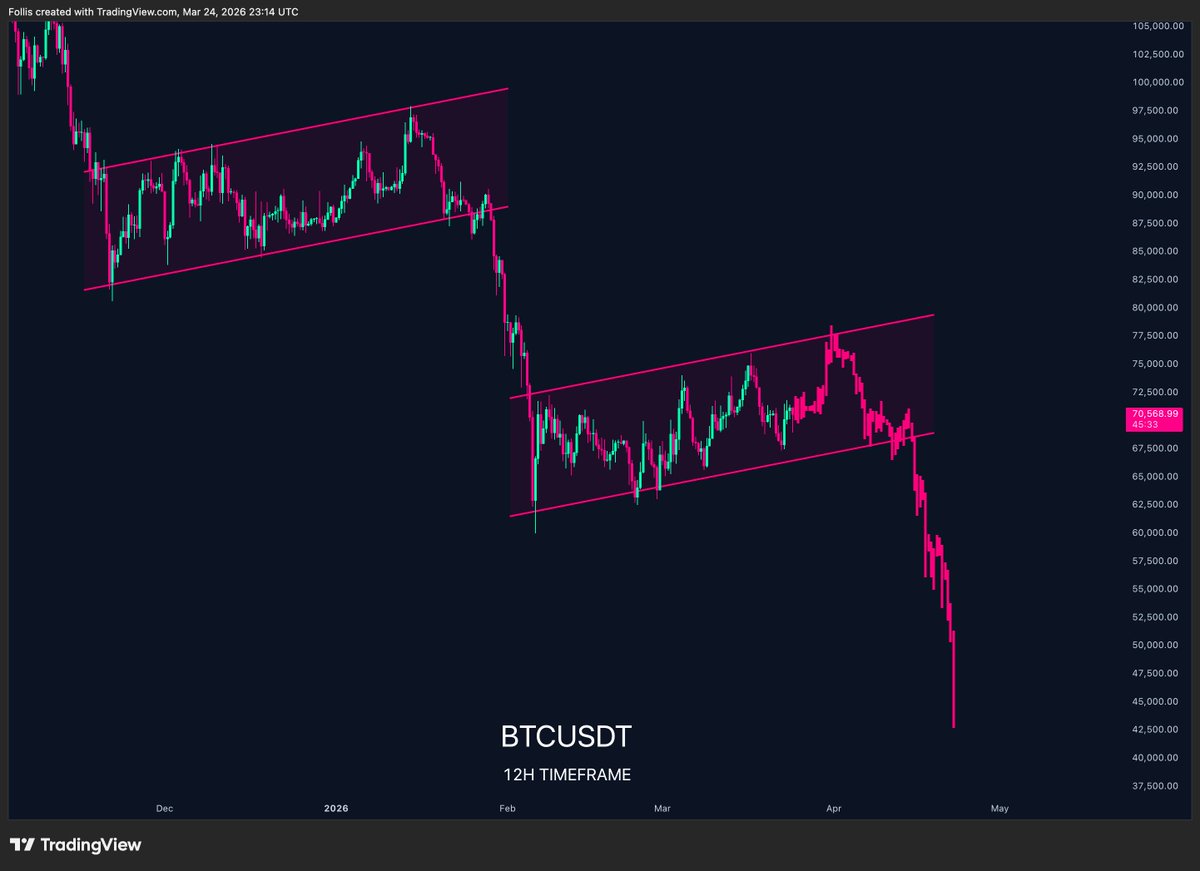
#BTC is now in his very unfavorable "Sade Sati" period in VedIc / Jyotish astrology with Saturn on his Moon
Considered a very heavy serious Karmic period of obstacles and challenges
This will hit exact around March 15-25
LOWER