This is one of my simplest trading secrets that has made me thousands of dollars:
Only buy pullbacks with low volume
Finding the right pullbacks is one of the most important parts of trading. If I want to ride bullish momentum, I need to buy on a good pullback. If I want to trade a bullish setup, most entries are going to revolve around pullbacks
Pullbacks with low volume are indicating that the move is simply paused & isn't facing significant pushback
Pullbacks with high volume are indicating that the move is facing significant pushback
Why would I want to enter when my setup/trend is facing a tough battle?
That's why I only buy pullbacks with low volume
Build a Trading System: Step-by-Step 👇
If you're serious about trading long-term,
this thread will save you YEARS of struggle:
7 steps to build a profitable trading system 🧵
Here are income ETFs for every investing goal:
Monthly income from the S&P 500:
$JEPI JPMorgan Equity Premium Income ETF
$SPYI NEOS S&P 500 High Income ETF
$XYLD Global X S&P 500 Covered Call ETF
$TSPY TappAlpha SPY Growth & Daily Income ETF
Monthly income from the Nasdaq-100:
$JEPQ JPMorgan Nasdaq Equity Premium Income ETF
$QQQI NEOS Nasdaq-100 High Income ETF
$QYLD Global X NASDAQ 100 Covered Call ETF
$TDAQ TappAlpha Innovation 100 Growth & Daily Income ETF
Targeted 15% annual income:
$OMAH VistaShares Target 15 Berkshire Select Income ETF
$SIOO VistaShares Target 15 S&P 100 Distribution ETF
$DRKY VistaShares Target 15 DRUKMacro Distribution ETF
$TPRY VistaShares Target 15 TEPRTantrum Contrarian Distribution ETF
Dividend growth:
$SCHD Schwab US Dividend Equity ETF
$VIG Vanguard Dividend Appreciation ETF
$DGRO iShares Core Dividend Growth ETF
$NOBL ProShares S&P 500 Dividend Aristocrats ETF
High dividend yield:
$VYM Vanguard High Dividend Yield ETF
$HDV iShares Core High Dividend ETF
$DVY iShares Select Dividend ETF
$SPYD State Street SPDR Portfolio S&P 500 High Dividend ETF
International dividends:
$VYMI Vanguard International High Dividend Yield ETF
$IDV iShares International Select Dividend ETF
$SCHY Schwab International Dividend Equity ETF
$FIDI Fidelity International High Dividend ETF
Cash and Treasuries:
$SGOV iShares 0-3 Month Treasury Bond ETF
$BIL State Street SPDR Bloomberg 1-3 Month T-Bill ETF
$SHV iShares Short Treasury Bond ETF
$USFR WisdomTree Floating Rate Treasury Fund
Bonds:
$BND Vanguard Total Bond Market ETF
$AGG iShares Core US Aggregate Bond ETF
$VCIT Vanguard Intermediate-Term Corporate Bond ETF
$LQD iShares iBoxx Investment Grade Corporate Bond ETF
Tax-free income:
$MUB iShares National Muni Bond ETF
$VTEB Vanguard Tax-Exempt Bond ETF
$SUB iShares Short-Term National Muni Bond ETF
$HYD VanEck High Yield Muni ETF
Real estate income:
$VNQ Vanguard Real Estate ETF
$XLRE State Street Real Estate Select Sector SPDR ETF
$SCHH Schwab US REIT ETF
$IYR iShares US Real Estate ETF
Crypto, gold and silver income:
$BTCI NEOS Bitcoin High Income ETF
$IAUI NEOS Gold High Income ETF
$SLVI NEOS Silver High Income ETF
$YBTC Roundhill Bitcoin Covered Call Strategy ETF
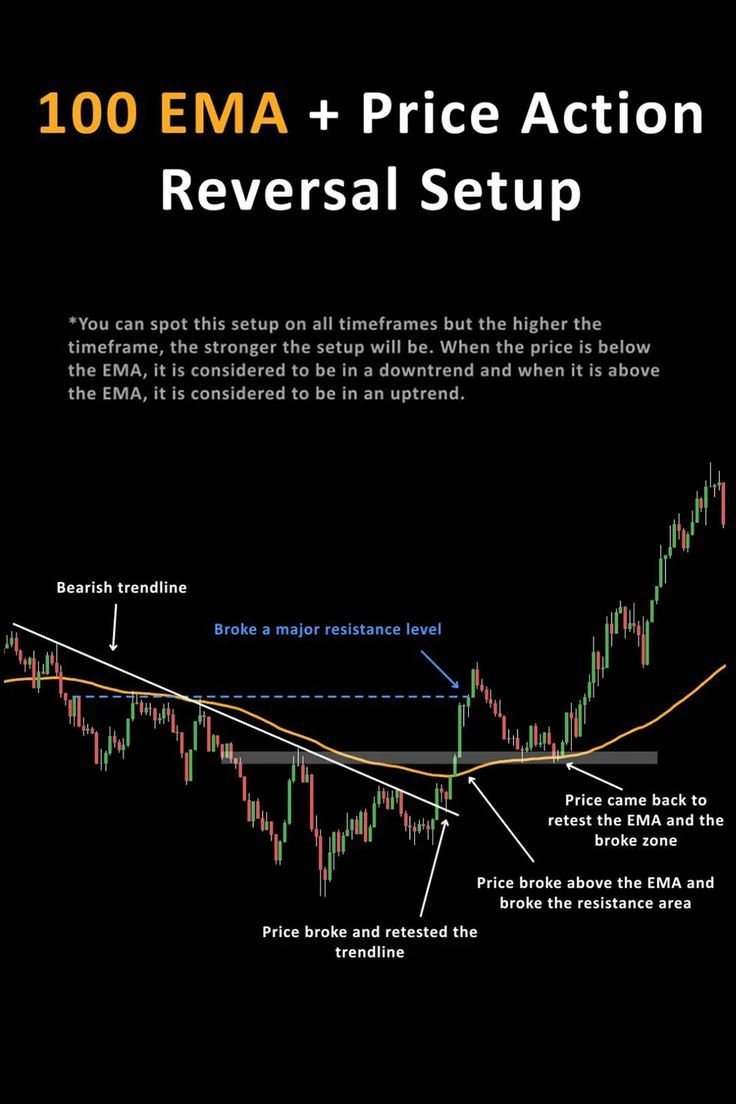
Moving Averages charts & why I like Them:
1:5 EMA--Closely follows the short-term trend and shows some of the strongest momentum
2: 10 EMA--The best swing trades often hold the 10ema
3: 21 EMA--The best intermediate -term trades will hold 21 EMA.
✓ Most of the best swing trades also start by consolidating along and then bouncing from the 21 EMA.
4: 50 EMA:--This often serves as the line in the sand for intermediate -term traders.
✓ Many of the stocks with the biggest moves historically have held Their 50 SMA for the duration of the trade.
5:100 EMA: Many stocks that slice through their 50 SMA in a meaningful way that are not through with their up moves will find support near the 100 EMA, the halfway point the 50 and 200 SMA( not literally but close enough)
6:200 SMA: This is often the line of last resort ⛵.
One indicator shows you the average price.
Three confirmations help you identify a potential trading opportunity. 📈
One of the biggest mistakes intraday traders make is taking entries based only on EMA crossovers.
Professional traders combine VWAP + EMA 9/21 + Volume Spike to identify momentum-backed opportunities.
🟢 VWAP → Identifies intraday price bias
🟢 EMA 9/21 → Confirms short-term momentum
🟢 Volume Spike → Reveals increased market participation
When all three align, you get a clearer picture of a potential intraday move.
My framework before every intraday trade:
✅ Price above VWAP for bullish bias
✅ EMA 9 above EMA 21
✅ Volume spike confirms buying interest
✅ Candle closes above the breakout level
✅ Price holds above VWAP after a pullback
✅ Stop-loss and risk-to-reward defined before entry
🚫 Avoid forcing trades when:
❌ Price repeatedly crosses VWAP
❌ EMA 9 and EMA 21 keep crossing in a sideways market
❌ Breakouts occur without volume confirmation
❌ Price rises but buying participation remains weak
❌ Entry comes too far away from VWAP, creating excessive risk
📌 Remember:
VWAP gives you the intraday reference.
EMA 9/21 shows you the momentum.
Volume spike helps validate participation behind the move.
Don't chase every breakout. Wait for alignment.
That's where disciplined intraday trading begins.
💬 Question for traders:
Which confirmation do you trust the most for intraday trading?
1️⃣ VWAP
2️⃣ EMA 9/21
3️⃣ Volume Spike
4️⃣ I use all three
Drop your answer below. 👇
❤️ Like • 🔁 Repost • 🔖 Bookmark this for your next chart review.
Educational purposes only | Not investment advice.
SEBI RA INH000025151
Follow @TradesByAnand for daily trading notes, price action education, and practical intraday trading strategies.
#StockMarketIndia #Nifty50 #TechnicalAnalysis #IntradayTrading #ShareMarket
Day traders listen to me:
Higher timeframe gives the direction.
Lower timeframe gives the entry.
My simple rule:
4H bullish ✅
1H bullish ✅
15M bullish pullback ✅
Then I look for entry
after reaction from support.
Don’t chase candles.
Wait for alignment.
Wait for pullback.
Wait for confirmation.
This one filter can save you thousands.
GM Class
"In quant, the real edge isn’t predicting the future, it’s measuring how wrong you can afford to be."
Today the next lesson is coming.
Stay tuned.
COMPLETE SWING TRADING STRATEGY (BEGINNER → PRO)
Timeframe: 4H (4 Hour)
Tickers: $CORT $KO $MA $MET
INDICATORS USED
•200 EMA – Main trend direction
•20 EMA – Pullback & entry timing
•RSI (14) – Momentum confirmation
TREND IDENTIFICATION
•Uptrend: Price above 200 EMA
•Downtrend: Price below 200 EMA
•No Trade Zone: Price moving sideways around 200 EMA
RULES FOR BUY ENTRY
1.Price must be ABOVE 200 EMA (uptrend confirmed)
2.Wait for a pullback to 20 EMA
3.Look for a bullish rejection candle at 20 EMA:
•Pin Bar
•Bullish Engulfing
4.RSI must be ABOVE 50
5.Entry on candle close after confirmation
RULES FOR SELL ENTRY
1.Price must be BELOW 200 EMA (downtrend confirmed)
2.Wait for a pullback to 20 EMA
3.Look for a bearish rejection candle at 20 EMA:
•Pin Bar
•Bearish Engulfing
4.RSI must be BELOW 50
5.Entry on candle close after confirmation
STOP LOSS & TAKE PROFIT
BUY TRADE
•Stop Loss: Below the pullback low
•Take Profit:
•TP1 = 1:2 Risk–Reward
•TP2 = Previous high / resistance
SELL TRADE
•Stop Loss: Above the pullback high
•Take Profit:
•TP1 = 1:2 Risk–Reward
•TP2 = Previous low / support
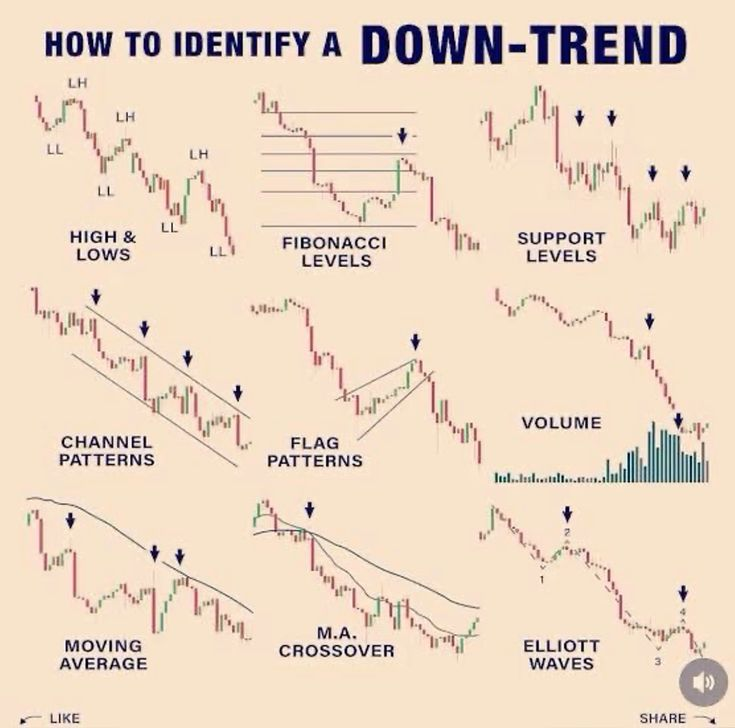
1. Market Structure
•Buy only Higher Highs & Higher Lows
•Sell only Lower Highs & Lower Lows
2. Avoid These Conditions
•❌ Trading during major news (NFP, CPI, FOMC)
•❌ Trading when price is too far from 20 EMA
•❌ Overtrading (max 1–2 trades per day)
3. Volume Confirmation (Optional but Powerful)
•Rising volume on rejection candle = strong entry
•Weak volume = skip the trade
4. Risk Management
•Risk 1–2% per trade
•Never move stop loss emotionally
•Consistency > Big wins
TRADER MINDSET
•Trading is waiting, not chasing
•No setup = no trade
•Protect capital first, profits come second
How to be a better trader in 5 simple steps:
-do not trade the open
-no 1min chart
-no trades until 10am
-1-3 trades max per day
-lock in any profit over $300
It’s this simple
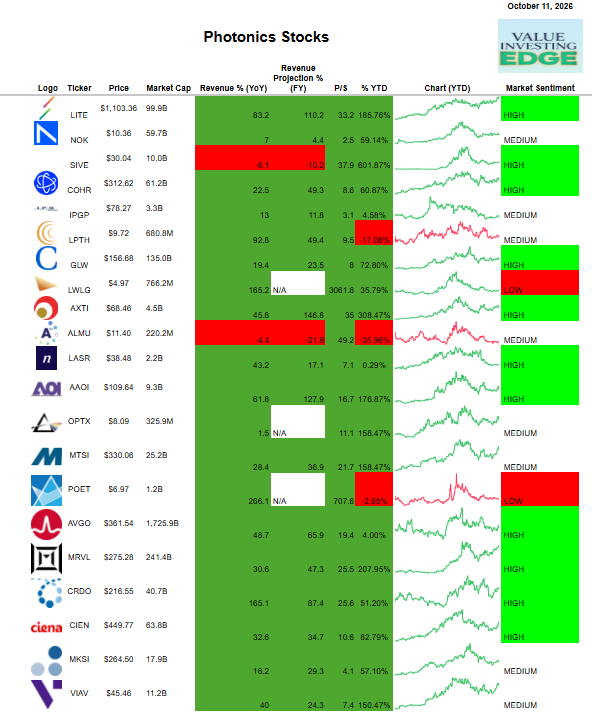
PHOTONICS STOCKS HAVE BEEN THE HOTTEST THEME IN THE ENTIRE STOCK MARKET!
Full list of photonics stocks to own, along with their earnings cycle projections:
Materials and Substrates
$GLW | Optical Fiber and Glass
$LWLG | Electro Optic Polymers
$AXTI | Indium Phosphide Substrates
Lasers
$LITE | Optical Lasers
$COHR | Lasers, Optical Technology
$IPGP | High Power Fiber Lasers
$LASR | Semiconductor and Fiber Lasers
Optical Components and Transceivers
$AAOI | High Speed Optical Transceivers
Photonic Chips and High Speed Connectivity
$MTSI | Optical and RF Semiconductors
$AVGO | Optical AI Networking
$MRVL | Optical Connectivity
$CRDO | High Speed Connectivity Chips
Optical Networking
$NOK | Optical Network Infrastructure
$CIEN | High Speed Optical Networking
Testing and Manufacturing Equipment
$VIAV | Optical Network Testing
As AI infrastructure scales, optical technologies will play a critical role in overcoming bandwidth and power limitations, creating enormous growth opportunities across the photonics supply chain.
Price breaks the level.
Liquidity gets swept.
VWAP reveals the bigger picture. 📈
One of the biggest mistakes traders make is chasing every breakout without checking whether price has swept liquidity and how it behaves around VWAP.
A powerful intraday framework combines VWAP + Liquidity Sweep to identify potential reversals and avoid chasing false breakouts.
My framework before every intraday trade:
🟢 VWAP → Identifies the session's volume-weighted average price and provides intraday context
🟢 Liquidity Sweep → Watch for price moving beyond previous highs or lows and then reversing
🟢 Price Rejection → Look for a candle closing back inside the swept level
🟢 VWAP Confluence → Check whether VWAP supports the reversal or acts as resistance
🟢 Volume Confirmation → Observe participation during the sweep and subsequent reversal
🟢 Risk Management → Define the stop-loss beyond the sweep extreme and assess the potential reward
✅ My Bullish Setup Checklist:
✔️ Price sweeps a previous swing low or important support
✔️ Price quickly reclaims the swept level
✔️ A bullish confirmation candle forms
✔️ VWAP supports the recovery or becomes a potential target
✔️ Entry offers a favorable risk-to-reward ratio
✅ My Bearish Setup Checklist:
✔️ Price sweeps a previous swing high or important resistance
✔️ Price falls back below the swept level
✔️ A bearish confirmation candle forms
✔️ VWAP acts as resistance or confirms weakness
✔️ Risk is defined before entering
🚫 **Avoid forcing trades when:**
❌ Price breaks a level and continues strongly without rejection
❌ You assume every stop sweep must lead to a reversal
❌ VWAP provides no clear context
❌ There is no confirmation after the liquidity sweep
📌 Remember:
Liquidity levels show where stop orders may be concentrated.
The sweep reveals how price behaves around those levels.
VWAP provides intraday context.
Price confirmation helps you time the entry.
Don't chase the sweep. Wait for the reaction. Trade the confirmation, not the assumption.
💬 Question for intraday traders:
Where do you prefer to trade a liquidity sweep?
1️⃣ Above the previous day's high
2️⃣ Below the previous day's low
3️⃣ Around VWAP
4️⃣ I combine liquidity sweeps with VWAP and price action
Drop your answer below. 👇
❤️ Like • 🔁 Repost • 🔖 Bookmark this for your next trading session.
Educational purposes only | Not a buy/sell recommendation
SEBI RA INH000025151
Follow @TradesByAnand for daily trading notes, price action education, and practical intraday trading strategies.
#StockMarketIndia #Nifty50 #TechnicalAnalysis #IntradayTrading #shareMarket
How I grade stocks:
A+ : Above the 5/10/20/50/200 day moving averages.
B. : Above the 10/20/50/200 day moving averages.
C : Above the 20/50/200 day moving averages.
D : Above the 50/200 day moving averages.
E : Above the 200 day moving average.
F : Below the 200 day moving average.
The trend is your friend until the end when it bends.” — Ed Seykota
I don't give a FUCK — the receipts speak for themselves:
Leopold Aschenbrenner called $IREN at $6 (2000% gains) and $BE at $20 (1600% gains).
He's now betting on these 10x stocks:
1) $IREN