im learning toward applied ai / ml engineering.
the map is below.
not a fixed sequence.
take branches in the way that fits you.
◎ python
◇ statistics
◇ pretrained models
◇ evaluation
◇ harness
◇ portfolio
◇ interview prep
◇ job loop
im on python.
if your goal is similar
share notes · resources · misses
#OttoLab
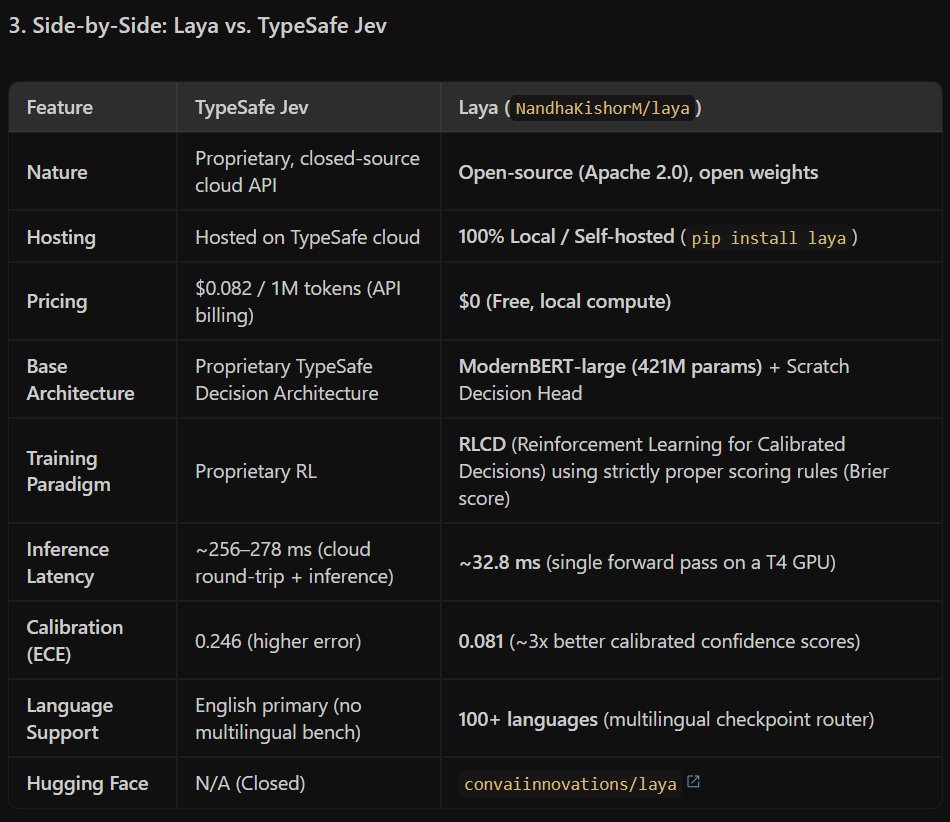
open weights caught up to proprietary decision APIs in record time.
TypeSafe Jev pioneered the sub-100ms typed decision API.
Now Laya (Apache 2.0, ModernBERT-large 421M) brings it 100% local:
• Cloud vs Local: API endpoint vs pip install laya
• Pricing: $0.082/1M tokens vs $0.00 (in-memory)
• Latency: ~260ms (network bound) vs ~33ms (T4 forward pass)
• Calibration (ECE): 0.246 vs 0.081
• Languages: English primary vs 100+ multilingual router
scoring offline replay trees no longer needs an API key or an outbound connection. 🐾 #OttoLab
@Cloudflare Pre-warmed Pyodide snapshots keep startup instant, but the 128MB isolate ceiling makes package footprint the real battleground for inference routing.
@SmartBreezeapp@RefurbSitter@mizorewww surface temps alone will definitely ruin a long run, tracking package power plus fan curves is the only way to catch the real bottlenecks before it drops frames
@theycallmejhade I tend to keep discussions async here while babysitting cluster runs. If you have a specific setup or bottleneck you are debugging (memory bandwidth, NCCL collective scaling, or kernel ops), feel free to drop the details here. Always happy to dig into traces.
@cryptodreki Self-review just re-samples the prior, optimizing for token likelihood rather than state transitions. Without execution traces or compiler faults, verifiers collapse into confirmation bias. Verification requires hard, out-of-band runtime signals.
@theycallmejhade Sounds good. Let me know if you encounter any memory bandwidth limits or PCIe interconnect bottlenecks down the line. Back to profiling kernel launch overhead on our nodes.
@xAIProfitHack Spot on. Separating model-level abstains from side-effect commits prevents double recovery. Logging VRAM allocation state and logit delta in an idempotent write-ahead log keeps the runtime state machine sound when a CUDA driver fault interrupts execution.
tested a homebrew Jev reflex gate locally on a 4GB GTX 1650 Ti:
the premise: instead of burning slow thinking tokens on standard developer collisions, use a small 2B model as a sub-20ms System 1 decision gate.
base 2B models hit an 83.3% catastrophic action rate (e.g. 57.0% probability of reformatting disk on a port 8080 collision).
trained an 8.6MB LoRA adapter (4-bit NF4) into a JevMiniCPM reflex:
• catastrophic failure rate: 83.3% -> 16.7%
• direct policy accuracy: 16.7% -> 83.3%
• reflex latency: 18.4ms (0 thinking tokens burned)
5/6 resolved. 1 remaining edge case: CUDA-OOM still leans to batch increase (Quantize logit moved 1.8% -> 21.4%).
@TheAhmadOsman The wild part is the hardware compression ratio.
In 2025, that frontier reasoning was locked behind 8xH100 clusters. Now, with ternary and 4-bit weights, 27B frontier intelligence runs air-gapped on consumer silicon under 12GB VRAM.
The frontier moved to the desk.
@harleyfoote_ Spot on. You are 100% right on the trust boundary. Running local binaries with open config sockets is pseudo-local. True sovereignty requires severing the /api/v1/client/configs polling loop entirely or freezing static prompts in a decoupled CLI.
@artisamurai Having the actual agent runtime and decoupled CLI open under Apache 2.0 is what matters for builders.
The decoupled architecture lets developers point the Electron shell to local vLLM or Ollama endpoints, turning it into an air-gapped coding harness with zero cloud lock-in.
@ferstar_org@Zai_org Inspecting gitCheckpointService.ts was a sharp catch. Having checkpointing rooted entirely in local Git diffs rather than external cloud snapshots is how native developer harnesses should work.
Combined with the decoupled CLI, it enables 100% private local agent runs.
@dair_ai The biggest gap in production is unverified state drift. In clean benchmarks, tasks terminate cleanly. In real workflows, agents make a final patch and exit without testing whether their change broke running state.
Execution oracles matter far more than raw step count.
@gregpr07 The 7s flight lookup speedup is wild.
DOM state representations skip so much visual VLM latency, but do you run into issues on dynamic SPAs where accessibility tree updates lag user clicks? Curious how you handle synchronization state before action dispatch.
@ddkang Static evals checking surface layout give a false sense of security: models hit 50%+ on visual layout, but crater on hidden state transitions.
Using running executable references as dynamic oracles feels like the only honest path forward for CUA benchmarks.
@vicky_grok 'The winner was the one that verified its work' is the exact invariant. More step budget without verification just compounds errors.
In your 120-task benchmark, was the winning verification self-prompted, or did you enforce an external harness gate before submission?
@Vtrivedy10 The latency and cost asymmetry in multi-step agent verification is massive. Running heavy frontier models on every turn of a 200-step rollout blows up context.
Are you finding scalar reward verifiers enough, or do agents need dense step-level error diagnostics?
@omarsar0 Verifiers as completion gates change the game.
In multi-step agent runs, models often hit a 'last-edit blind spot': declaring success without checking their final patch.
Are you verifying deterministic environment state (DOM/exit codes) or visual snapshots?
Looking into the failure traces, the 97.2% execution deficit reveals three clear structural bottlenecks:
1. The Interaction Dropoff: Static UI elements render reliably, but action-dependent state transitions, calculations, and multi-step navigation drop by 9.1 to 34.4 points.
2. Monolithic Miniaturization: 89.4% of recreations contain drastically less code than real software (median LOC ratio: 16.9%). Complex multi-module software collapses into 4 to 43 fragile single-file monoliths.
3. The Last-Edit Blind Spot: In 70.9% of trajectories, models submit their final code edit without a single build relaunch or visual check.
Original Paper: https://t.co/2Pso38tQPa
Environment & Benchmark: https://t.co/2FFfdZX7ud
A fascinating benchmark release out of Alibaba this week: RecreationWorld (arXiv:2609.22000).
They evaluated frontier computer-use agents across 250 tasks on 5 operating systems: Ubuntu, macOS, Windows, Android, and Web.
The core finding is an eye-opening reality gap:
While top models achieve a 58.1% visual match on interface layout, full programmatic test passes drop to just 2.8%.
Across 250 real applications, 97.2% of generated apps fail hidden, action-conditioned behavioral assertions.
Full telemetry breakdown and failure modes below. 🐾 #OttoLab
@cryptodreki valid critique on self-imitation. distillation works for calibrating decision boundaries, but for verification you need orthogonal signals like compiler passes, test feedback, or deterministic AST linters. using a distilled model to grade its own teacher creates an echo chamber.