1. AI-Driven Electricity Renaissance: Much discussion around AI-driven energy consumption, and how it will require significant investments in fresh electricity-generating capacity. Even Barron's this weekend is pushing the utility sector, so you know something must be up: https://t.co/jJluRlnj7v.
When we look at the basic math of what 'AI equipment' needs versus traditional DC equipment, we understand the core argument. However, we've been tracking electrical equipment spending for a while (it was a relevant part of our day job for >20 years) and there are a lot of unanswered questions in this area. We thought it worth pointing some of this out, to inform the debate.
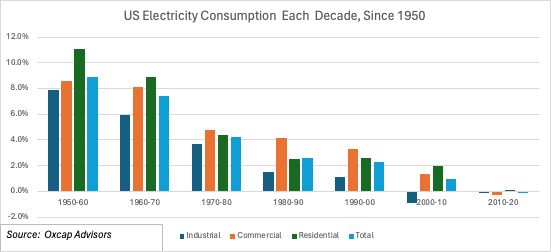
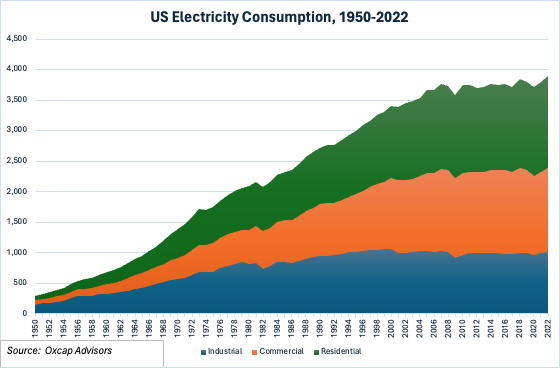
2. Previous Technology Transitions -- Zero Effect: Our first chart below shows the evolution of electricity consumption in the US since 1950, by decade. In the 1950's, electricity consumption was growing at 8.5% p.a. This growth rate has fallen every decade since, from 7.4% in 1960-70 through to -0.1% in 2010-20. In absolute terms, electricity consumption did not increase from 2007's ~3.8 trn TWh through 2021, ie. fourteen years of stagnation. Thanks to a recent post by @TechFundies for highlighting an important curiosity in this data. Given historic buildout of fixed then wireless infrastructure in the 1990's and 2000's (the 2G-3G transition, anyone remember peak Cisco?), why did electricity consumption DECREASE from 3.0% in 1980-1990 to 2.4% in 1990-2000 and 0.8% in 2000-2010? What was the true relationship between demand for internet access and services, an explosion of personal devices, with electricity consumption itself?
@BillAckman@ZohranKMamdani Sir — I share your thoughts and concerns over Mr. Mamdani. However, respectfully, you should do your homework on Manchester and on Andy Burnham. Given recent events, I understand why you might post that tweet as clickbait. However, it’s an unhelpful misperception. Poor analysis.
@rich_toad A lot of insight in there. I’ve been a sell-sider since 1989 and have zero regrets. Yes, I have ‘trained’ young analysts who have gone on to become hedge fund owners and multi-millionaires. But I’ve also seen the human costs — stress, divorce, heart attacks and sadly suicide.
We had highlighted risks to US manufacturing in 4Q22, due to excess ordering and inventory. We also showed that in 6 inflation cycles since 1956, the ISM stays below 50 for ~13 months and troughs at ~35. We called this The Great Unwind. We never expected it to last two years. In last week’s The Cycle, we updated our views:
https://t.co/BczqKv54bE
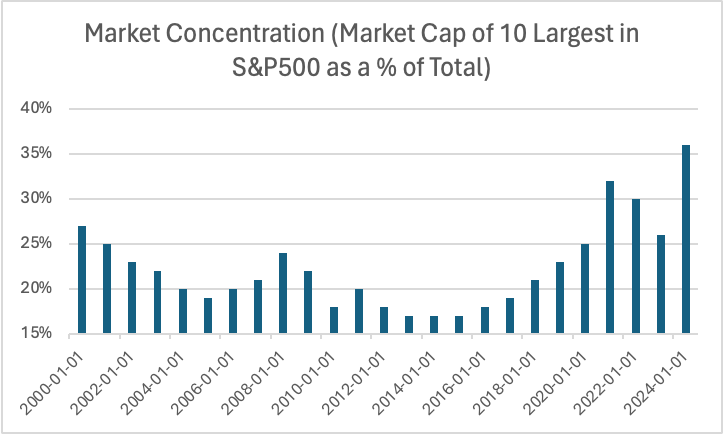
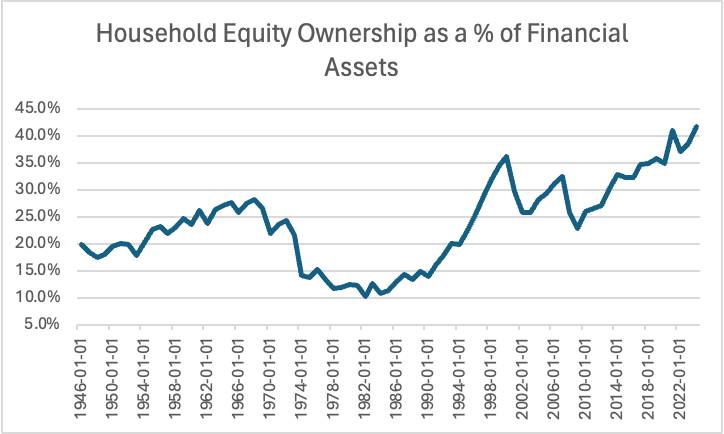
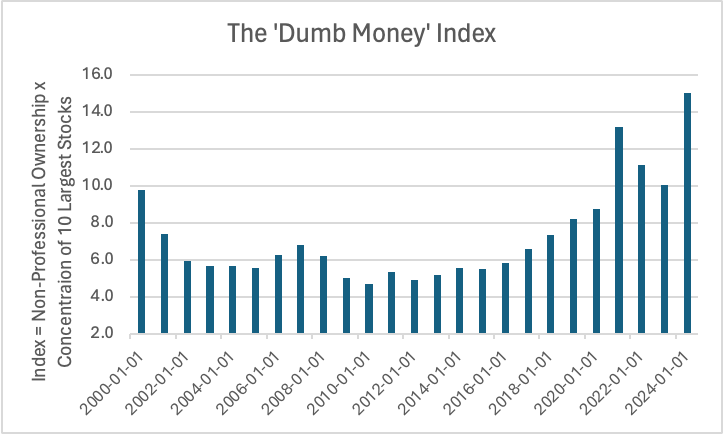
1. Dumb Money: Part of our goal at Oxcap as a newly-liberated independent research provider is to provide slightly different perspectives and make points that we might not have been able to at a major Wall Street bank. Accordingly, in today’s Chart of the Day (see below) we have created a so-called ‘Dumb Money’ index. This is not supposed to create offence to anyone, rather stand in contrast to the idea of ‘Smart Money’ that is held in such high regard. The index is the product of two variables: (1) Household Equity Ownership in the US (Federal Reserve data); (2) Market Concentration in the Top 10 stocks (Factset, Compustat, GS public data as republished on X). We have simply multiplied one by the other, it’s nothing more complicated than that.
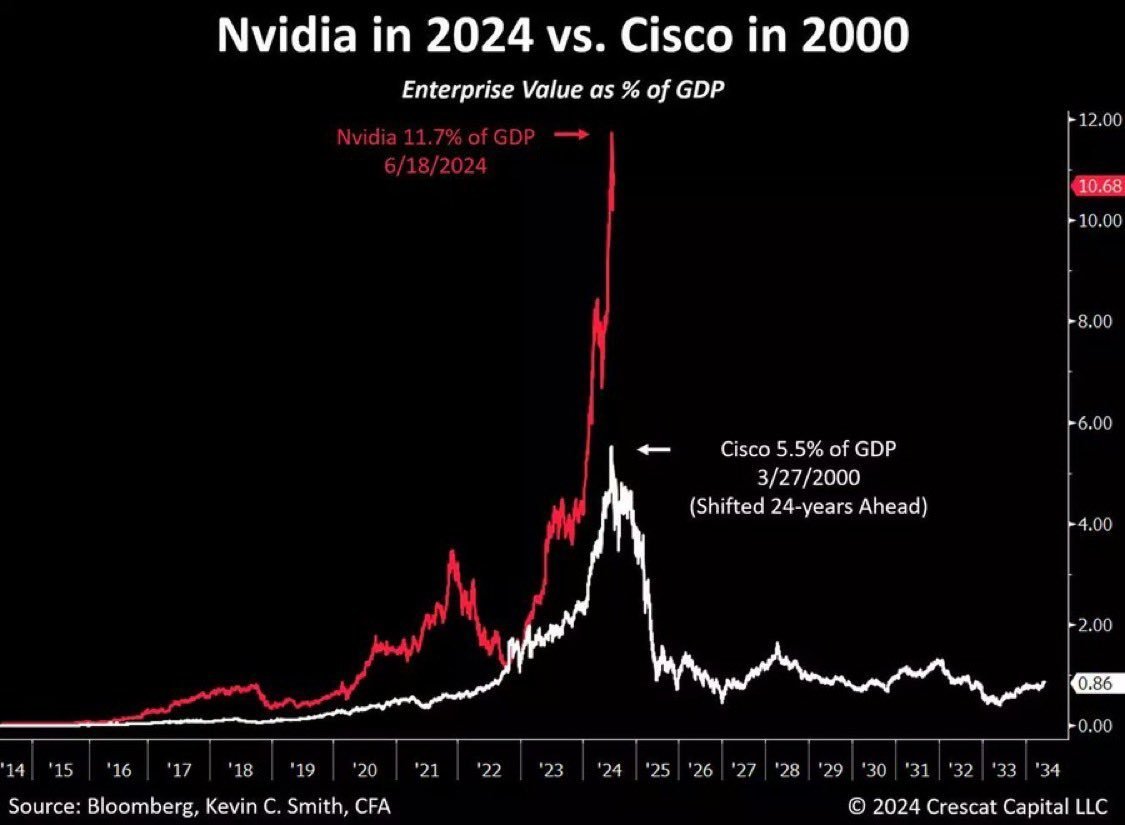
2. It's ~50% Worse than Dotcom: We see that non-professional ownership of US equities has never been higher, the latest reading of 41.8% surpassing the 36.3% reached at the height of the Dotcom bubble. Although we were young and naïve back then, we do remember wondering whether the merger of Time Warner and AOL really made sense, whether Worldcom should be a megacap and if Cisco really was going to provide the picks and shovels that would build the Information Superhighway. Here we are, twenty years on and NVIDIA is the poster child for another febrile liquidity bubble: its current valuation is the equivalent at ~11.7% of US GDP compared with Cisco’s ~5.5% of GDP at its brief Dotcom peak. Our second variable, Market Concentration of the Top 10 S&P500 stocks was ~27% when bad stuff began to happen in 1Q2000; it has blown through that prior peak since Covid toward ~36%. What this means is that our Dumb Money index has spiked to ~15.1x versus ~9.8x in 2000 – ie. things are arguably >50% ‘dumber’ than back then. They are also ~2.4x the pre-Covid LT average of 6.3.
3. New Paradigms (Again): Oxcap believes that companies are better today, there are fewer examples of real excess (anyone else remember Dennis Kozlowski's shower curtain or Jack Welch's retirement package, including breakfast at Jean Georges?), and that the potential of AI is very real. That's not the point. It is a question of degree, ie. what you're paying for future cashflow, as opposed to second-guessing what the guy sitting next to you might do next. We are in a classic market situation where old timers point out downside risk and move to cash (ie. prudence), the crowd is simply playing the game (ie. risk on) – and to Peter Lynch’s point, more money is often lost waiting for corrections than saved by it. Fair enough. Still, our job is to help inform your investment decisions – you are the money maker and decision-maker, not us. Hopefully as we enter another crazy week of bottom-up earnings, an interesting bit of macro overlay helps. Valuation never matters until it does (and it always does).
– Have a great week, Team Oxcap.
Feel free to visit us at https://t.co/FEJQRUZXaP or sign up for free updates on LinkedIn: https://t.co/fS4nrdLXO3
I don’t wish to inflame Twitter sentiment but this misses the point. The fact that there even is a ‘Mag 7’ shows you that there is a clear problem. Markets move on LIQUIDITY. If that liquidity is in MSFT, Cisco, IBM, Railroads or Tulips doesn’t matter. It’s telling you something important. If the Mag 7 starts to normalise, do we really think 493 other stocks go higher? Look at Eaton at 2.8% FCF yield and 10-year at 4.0%, just one example outside Mag 7. You’ve got guys on Wall Street writing about industrial supercycles despite the fact that anyone in the industry is talking recession. The reality is that this is one of the biggest bubbles in history! Yet people want to believe that this time it’s different. It isn’t.
The End of Revenge Capex: We read a lot of macro stuff about consumers engaging in ‘revenge spending’ since Covid ended. Looking at the charts below, we wonder if the same thing has been going on, on the corporate side. We took a look at the capex spend and intentions of ~72 companies in seven different industries since the GFC. We found that between 2010 and 2019, capex was growing at a boring ~2.7% CAGR. However, between 2019 and 2024, the combined capex has absolutely BOOMED from ~$392bn to ~$606bn, a stunning +55% gain. Sure, we get why Pharma and Semis are going up – but we’ve also been reading some fairly comical explanations about unprecedented demand for pet food and pork chops. Anyway, we’ve included recent company quotes which show that this phase of corporate excess may be ending. Automotive is bordering on a crisis (which is widely understood from Detroit to Wolfsburg), but we’d pay greater attention to below-the-radar statements like those from Moderna, Nestle, Pepsi. Even the tone in Semis has shifted. It’s funny to think that just a year or so ago, we were all in an new "Industrial Super-cycle". As of yesterday, we’ve seen ~23 months of contractionary ISM! Oxcap was in China last week. In >20 years we have never seen the situation this bad, a total collapse of confidence. So governments can just keep on stimulating and Wall Street can just keep on buying…just keep it going, please! Makes sense.
"One Company's Capex is Another Company's Sales" Figure 1: Recent Capex Commentary
1. Volkswagen (Autos) “Capex is currently at an elevated level with the high upfront investments in battery and software, as well as execution of our regional strategies…..it's our clear ambition to reduce investment in R&D and Capex to well below €170 billion between 2025 and 2029” (3Q24)
2. Ford (Autos) “Today’s electric vehicle consumers are more cost-conscious than early adopters. This, coupled with scores of new electric vehicle choices hitting the market over the next 12 months and rising compliance requirements, has amplified pricing pressures. With pricing and margin compression, we’ve made the decision to adjust our product and technology roadmap and industrial footprint”. (August 2024)
3. Stellantis (Autos) “We were in a dynamic of R&D/Capex and M&A expenses that proved to be too high, and we are now fixing that. As we move forward you're going to see us spend almost 60% on purely future-focused items: multi-energy platforms, software etc.” (June 2024 Investor Day)
4. NIO (Batteries) "We're making prudent control under management of the pace of our investment and expenses. We have already started by postponing certain projects or even cancelling some projects. The R&D or the Capex in the year of 2024 will be significantly lower than that in 2023." (2Q24 Call)
5. Moderna (Pharma) Capital expenditures will come down dramatically. So, this year we started with cash at $13 billion. We're going to $9 billion in cash, that's a $4 billion burn. But we're spending $900 million in capital expenditures in the year 2024. In 2025, we're spending $300 million. So, that's a $600 million reduction. (September 2024 CMD)
6. Intel (Semis) "We now expect gross Capex in 2024 to be between $25 billion and $27 billion. That is a reduction of over 20% from our plan entering the year and additionally reflects expectations for softer second half demand. For 2025, gross capital spending is targeted between $20 billion and $23 billion."
7. Nestle (Food) “Capex was temporarily elevated because we were putting in extra capacity [pet adoption a driver for Purina]. I think over time this will come down to around 5% as per the algorithm that we put forward for the year 2025.” (May 2024)
8. Pepsi (Beverage) “We've been very intentional about the [higher] levels of capital we've invested in the business. Part of that was to catch up on capacity. We're currently in the midst of big investments in IT and digitalization but over time, I think you'll see the level of Capex as a percent of sales begin to trend down” (Feb 2024)
9. AT&T (Telecom) "We may have run at a bit of higher than maybe traditional levels of capital investment in the business. It's come down from peak and it will continue to drop down.” (September 2024)
10. SMIC (Semis) “With more and more capacity building based on geopolitical considerations, coupled with the macroeconomic cycle and lagging consumption, in the short term it will be difficult for foundries to achieve high utilization.” (Feb 2024)
1. Perceptions from China Last Week: We are just back from a week in China meeting companies, both state-owned and private. We are constantly surprised how many people opine on China, from Wall Street to FinTwit, without regularly visiting the country. With a ~$4trn manufacturing economy, China is still one third the global output total and the equivalent of the US, Germany and South Korea combined. Our visit coincided with the latest stimulus announcement, so we wanted to share initial thoughts. For more details, visit our Oxcap Analytics page on LinkedIn and / or sign up for our free webcast on Wednesday 2nd October at 1pm UK / 8am EST, link here: https://t.co/v7rMHmDRWf
2. We Want to Believe: We are unashamedly pro-China, despite endless media rhetoric and fin de siecle ideological posturing. We have visited the country more than once a year for two decades, pre-Covid. We know that things often turn on a dime. The government can tamp up and tamp down on demand rapidly. Animal spirits take over quickly. Our gut feeling had been that sooner or later, China will find its floor and may be at some kind of inflection point as we approach 2025. Personally, we are invested in Chinese equities. So we wanted to come away with a heightened sense of optimism. On Tuesday and Thursday, we saw People's Bank of China and then a special meeting of the Politburo attempt to kick start that revival. Certainly, a >10% move in CSI-300 in a week suggests that financial markets also want to believe.
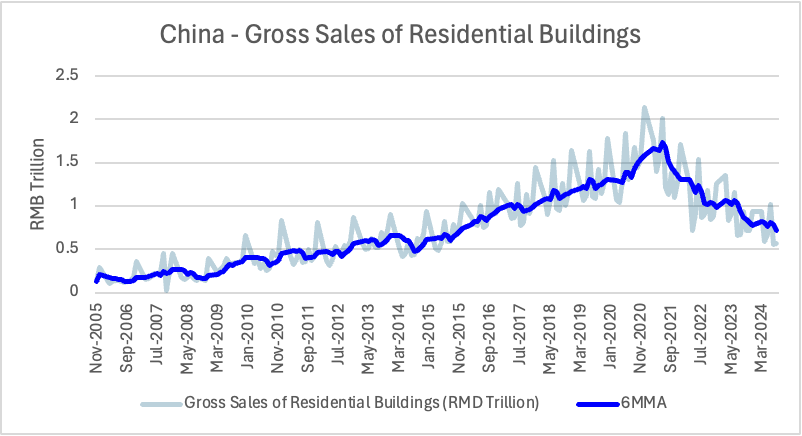
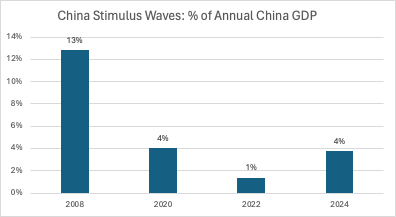
3. Stop Talking About Bazookas: Unfortunately, we come away less persuaded than before. There are different ways to think about the situation, both quantitative and qualititative. On the first, the total value of announced and rumoured measures is worth ~$695bn (~Rmb5trn), or c.4% of GDP. This is significant, bigger than the 2022 effort (~1%) but really only in line with the 2020 pandemic boost of ~4%. This is not the Big Bazooka experienced post GFC, ~13% of GDP, that lazy journalists (and some analysts) keep referring to every time a new round of stimulus comes through. Remember that in 2010 these measures were classic Keynes, targeted at Public Infrastructure and Reconstruction. They got the FAI growth machine working again quickly. Last week's initiatives are fundamentally different. They are targeted at reversing wealth effects, and are wholly insufficient.
4. Not Enough: The problem in China is not a lack of growth, it is a lack of confidence. The PBoC is implementing ~$420bn of measures (Sovereign Bonds, Additional Special Bonds) which are aimed at growth + local government support, mortgage rate cuts and a ~$110bn stock market stabilisation fund. However, a mere ~10% price reduction in the real estate sector has a negative wealth effect of ~$13trn, or c.70% of GDP. Accordingly, issuing even >$400bn of sovereign bonds is the equivalent of farting against thunder. On the stock market stabilisation, a >$100bn injection is ~1% of the value of Shanghai / Shenzhen exchanges, and about the same amount as the loss of value in one company, Alibaba, since September 2021. Sure, the quantitative amounts are helpful in showing that the government is finally getting serious (no longer fixating on 'moral hazard'), but pale in comparison to the scale of the problem. Today, fixing China is not about building roads to nowhere, it is about reversing a property crash.
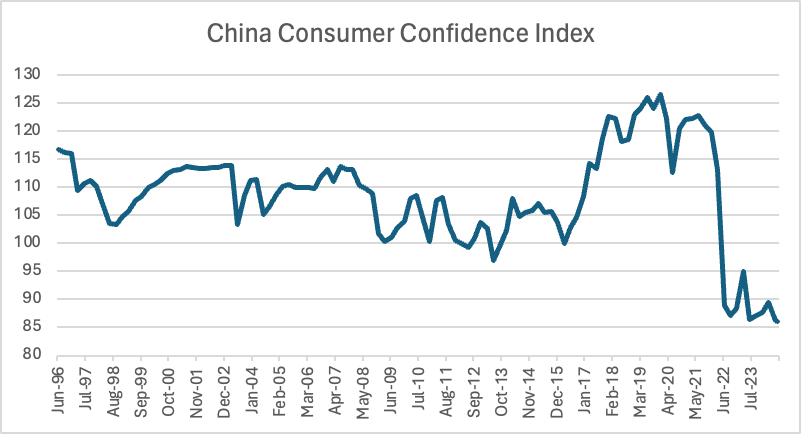
5. Confidence is Completely Shattered: It's the qualitative side that bothers us most, because we have not experienced this in China before. There is a total lack of confidence. Business owners and private individuals we met with see no obvious way out. We asked >40 companies at a trade show where they saw growth potential in 2025 and it was blank faces all round. It feels like the last year of Covid lockdown have created some kind of collective shock. Beyond a handful of new robotics companies telling us that the government would support their loss-making activities for the next few years, there was no great sense of optimism. We found it worrying that a number of manufacturers we met with are citing a recovery in Germany and the US as the main positive levers for their growth outlook in 2025! We are not going to sugar-coat it, the mood was bleak. If economic growth ultimately is about confidence, we are far from convinced that last week's package will be enough to do the trick.
Here are a handful of direct quotes from last week's meetings in China:
“Covid was the turning point in the long-term outlook for China. We are experiencing deflation for the first time. There is just no demand”.
“The real estate situation is serious and getting worse. There’s been a massive overbuild in manufacturing capacity”.
“This downturn is fundamentally different from 2016-17. This will not be just a short-term correction”.
“Factory demand in the third quarter is clearly weaker than the second quarter”.
“Manufacturing is getting worse still — it feels like we are in a downward spiral”.
“Component demand has been falling steadily, but we still don’t see a bottom. We are not yet in a stable position”.
“We are not bullish on the China outlook. In the machining area, there is a glut of second-hand machines on the market.”
“We have three end-markets — (I) Machines, (ii) Automation, (iii) New Energy. Right now, we are only optimistic about the third area”.
“Battery is our biggest market, but it will take more than two years to work off excess capacity”.
“There will be a time when the shift to solid-state batteries creates new lines and fresh demand. But right now, the technology transition cannot start because it would wreck the profitability of the existing lines”.
“There are few industries which look any better at all in 2025. There is still significant excess capacity in Battery and Solar. We expect EV to slow next year. Maybe Textiles could be an area of relative strength?”.
“Electronics could still be a growth market for us. We were involved with Foxconn in iPhone 16 and we will see more AI functionality on the next generation of phones”.
“Since 2022, there are 45 new start-ups in the Robotics industry. Many are government-sponsored and are not targeting a net profit in the next couple of years.”
“Chinese companies have been smart in approaching the market, building in small applications from the ground up. They are gaining significant share in mid and low-end from foreign players”.
“We target different industries. It would be hard to go after large foreign companies in Automotive”.
“There is a lot of change in the market, especially on the collaborative side. XYZ company has lost share and fallen outside the Top 3. However, we are surprised that the ‘Big Four’ have maintained a stable ~50% market share in Industrial Robots for several years”.
Good afternoon. We hope that all are doing well and enjoying late summer, before the madness kicks off again in a week or so. Thank you to the ~60 recent Oxcap subscribers who have kindly filled out our website questionnaire.
As promised, we are now sharing our findings broadly, because we think they are interesting and important. They say something about what institutional investors actually want from their suppliers (imagine that!).
As we approach our October launch with a combination of excitement and trepidation, we are listening carefully. That’s all that matters.
Conclusions:
§ It’s disappointing – though not surprising. The majority (~55%) of investors are not satisfied with the current state of sell-side research, either extremely so (~13%) or somewhat (~42%). Not one person has responded as ‘very satisfied’. Of course we are biased, but this is depressing stuff for an industry where we would describe the overall standard of thought leadership as excellent, not that many years ago.
§ Investors value data around developing industry datapoints and PMI trends (~43%), and single-stock investment ideas (~39%) above all else. We are surprised that these categories (>80%) are much more important than corporate access or even distribution capability. Is corporate access becoming a commodity?
§ Something we know from experience – yet big investment banks seemingly don’t. Clients pay limited attention to analyst ratings and price targets. Less than a quarter (~23%) value it to any degree at all, a remarkable statistic given how much time is spent in Canary Wharf fretting over these topics. Over ~50% of investors want deep company or industry insight. That’s hard to do with inexperienced analysts, to be frank. Superficial competence is not the same as true expertise.
§ Investors tell us they value primary datapoints, from talking to distributors, systems integrators, and industry specialists (~31%). Subject to appropriate compliance oversight and curation, they want access to experts (~31%). We know that we don’t know all that much about automation, robotics, datacenters and power – it’s time to stop pretending we do. It’s Oxcap’s mission to provide ‘Connected Research’.
§ The strongest response we got across the whole survey was about the re-invention of equity research (see the last slide), where ~73% of responders said they ‘would be happy to see completely new and differentiated ways of producing research’. Yet Wall Street keeps on working with the same narrow oligopoly of data and research template providers. These guys make sure it all looks the same and is delivered in exactly the same way – ie. beyond the analyst name and reputation, research is a guaranteed ‘visual commodity’. This has been going since we transitioned from Extel cards, handwritten notes typed up on WANG and ground-breaking spreadsheets on Lotus 1-2-3. Surely it is time to do it a bit differently.
Yes, looking at some of the other replies I think the opex definition is a little misleading. I’ve looked at manufacturing companies for some time as an analyst. While what you show here as opex is correct, within COGS there is also opex eg. replacement components, spare parts, etc. The factory requires opex daily that is part of COGS, not SG&A. The opex amounts can be a highly significant proportion of COGS.
· Sentiment Shift: For the first time in the current cycle, there has been a clear and unambiguous shift in manufacturing sentiment, as relayed by US automation supplier Rockwell on its F3Q24 earnings call. For those readers not familiar with the name, Rockwell is a very good company with FY24 ~$8.4bn annual sales and 25,000 employees worldwide. It is the largest supplier of factory control equipment in the US. If you walk into an American manufacturing plant, you’ll see Rockwell kit everywhere, running the machines. Think of it as a bit like Microsoft and PC’s in an office environment.
· Sales Hit The Wall: The company made a major adjustment to its fiscal 4Q24 (calendar 3Q24) guide, taking the sales forecast down from ~$2.3bn to ~$2.0bn for the period. Having already cut guidance, the 4Q24 revision is from -10% YoY to -20% YoY. Speaking to a few contacts, people seem to be pretty relaxed about a >10% sales cut three months before year end – “oh yeah, no big surprise”. Fine. For the record, these were the same guys who thought we were in an Industrial Supercycle in 2023, and have been expecting order troughs every quarter since.
· From Boom to Bust: Just to get a sense of the contrast inside a year, we juxtapose the F2Q23 divisional growth outcomes vs. the latest quarter. Discrete Automation sales have gone from +20% YoY to down High Single Digits. Within that, Automotive from +40% to down High Teens. Semiconductors (poster child for the Supercycle Narrative) from up Mid Teens to down High Teens. Food & Beverage goes from +40% to down Mid Teens. We’re not going to go through it all, you get the picture. The reality is that much of the secular growth being touted on Wall Street post-Covid was an inventory build, plain and simple. Sure that’s come down now in ‘The Great Unwind’ – but the next chapter is weaker demand. And still, they look for troughs...
Please see below a selection of comments made on the call. We felt that Rockwell’s management was both candid and detailed about what was creating the sales headwind. It’s the most explicit statement from any manufacturing-related company we listen to – and a view we respect. It’s up to you to figure out how temporary the adverse drivers are:
1. “We did see some additional project delays, especially affecting our solutions orders. Some manufacturing customers are taking a pause in making large capacity investments as they deal with slower consumer demand, high interest rates, and policy uncertainty around tax tariffs and stimulus incentives”.
2. “While our orders are improving sequentially, they're progressing at a more gradual pace than we anticipated. We believe this is largely tied to a pause in new capacity investments as manufacturers focus on cost control and operational efficiency, waiting for a potential reduction in interest rates and broader US Policy changes.”
3. “Rather than a one or two-quarter sharp or bounce back, we think this is going to continue to be a gradual recovery. Inventories are depleting, both at our distributors and our machine builders, but we have seen some weaker conditions in end markets, and I would characterize that in a couple of buckets. You see a couple that are affected by consumer demand, such as automotive, as consumers are going a little slower in a rush to EV. You also see it in food and beverage and home and personal care”.
4. “Then you also see some pressure based on policy uncertainty going forward I would say semiconductor and questions about dispersion of CHIPS disbursement of CHIPS and Science Act funds are weighing on semis-manufacturers, and then in energy transition. So in those broad buckets, that tempers our view.”
5. “Last quarter, we talked about some project delay delays and end-user CapEx slowdown in parts of our business, namely automotive and food and beverage. We saw project delays across a broader group of industries this quarter, which will impact our end market performance through the end of the fiscal year. Within discrete, automotive sales declined high teens versus prior year.”
6. “Brand owners are delaying more EV programs as they continue to reassess their product strategy in light of slower consumer adoption and policy uncertainty in the US Semiconductor sales were down high teens. We continue to see delays in new capacity builds and the associated tooling due in part to questions about the timing and certainty of CHIPS funding disbursements”.
7. “Moving to hybrid, sales in this industry segment were down mid-teens, driven by year-over-year declines in food and beverage and life sciences. Food and beverage sales decreased mid-teens in the quarter. Producers in certain segments of the food and beverage market, like baking and snacks, are seeing inflationary headwinds as consumers shift from high-end brands to more affordable labels. We're seeing less greenfield activity”.
8. “The Americas continue to outperform the rest of the world with North America sales flat year over year in the quarter and Latin America sales up almost 19%. EMEA sales were down 28% with continued macro economic challenges across Germany, Italy, and France impacting end-user demand. Asia-Pacific sales declined 22%. In addition to continued inventory destocking and economic challenges in China, we saw incremental headwinds from EV battery project delays in Korea this quarter.”
9. “Yes, so our visibility into distributor stock is very clear for the distributors on our DMI program, which is 100% of the distributors in North America. And it's not all the way gone, but it's the vast majority of it has dissipated there. We see continuing stubborn inventory in China, and we'll call that out. And that's going to take a little while to get to the bottom of that, because if you think about it, what paces those inventory levels has a lot to do with the end market demand. And so if that is weaker, then it's going to take longer to burn through that stock sitting on distributor shelves.”
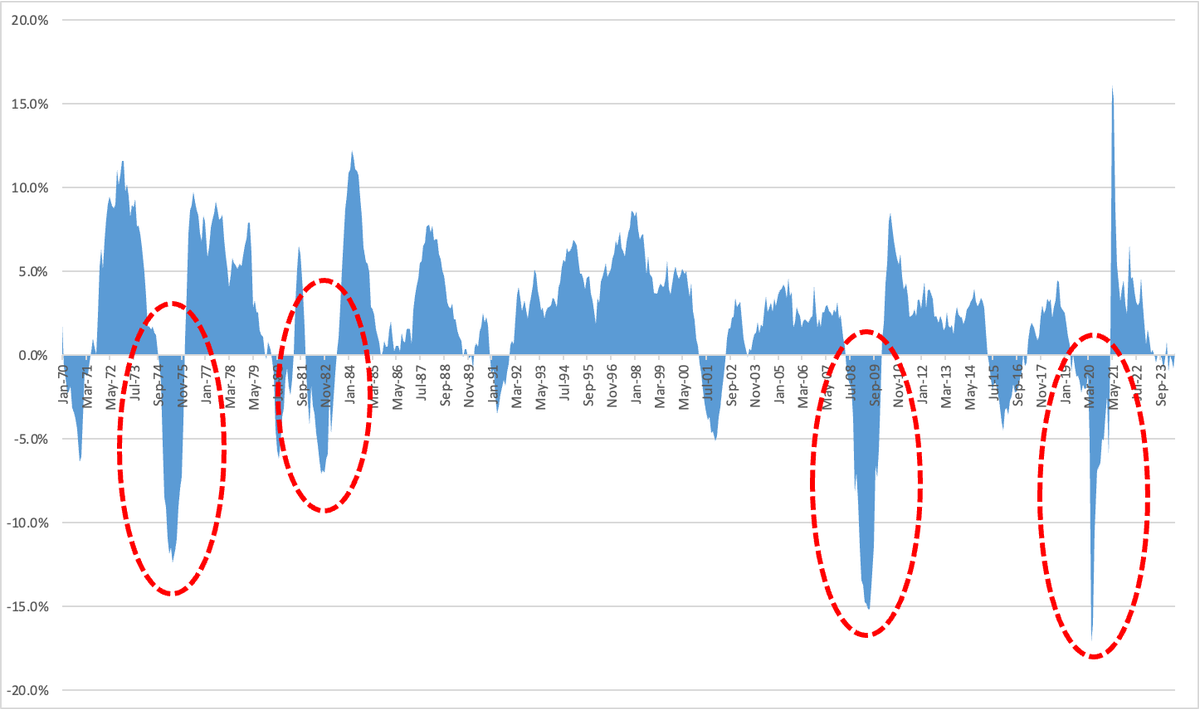
1. Rate Cuts and Recessions: As part of our PMI Playbook, my keen Associate Tom (who also happens to be my son) has taken a look at 7 US recession since 1973. We’ve tried to answer three questions simply: (1) After rates are cut for the first time, how long does it take for the recession to start? (2) From the start of the recession to the index trough, what is the average change in the S&P500 index? (3) How many months does it take, from the first rate cut, for the S&P500 to bottom? Please see the table and charts below. Feel free to e-mail him at [email protected] and we’ll share the underlying data with you.
2. The answers: (1) On average, it takes ~1.7 months for a recession to start. So if this time the Fed cuts in September, then it’s October. Note that we are using the Fed’s own definition here of when recession starts and ends. (2) The average correction in the S&P500 is ~21.4%. Note: this is from when the recession starts, NOT when the S&P500 peaks. Our view is that the best inflationary precedents are 73-74 and the 80-81 periods, resulting in S&P500 corrections of 33.8% and -10.6% / -18.2%. (3) The average time taken for the S&P500 to trough after rate cuts start is ~8.4 months, with the longest period being 16 months in the GFC.
3. So again, playing the odds – if rates are cut in September 2024, the S&P500 index bottoms in May at 4,207 (ie. ~21% lower, assuming no change in index until September – a big assumption based on today’s move). Obviously, we realize that this is a gross oversimplification and we are sure there are lots of well-paid macro guys who can explain why this time is different. However, we just like mathematical and statistical probabilities. Filtering in our own biases, we think this is more in the 1970’s / 80’s neighbourhood, ie. worse than 1990, 2001 but not as bad as GFC. The issue is the preceding inflation shock, and prevailing deficits. The other factor is that the stock market is overvalued, ie. in a thematic bubble.
4. PMIs and Inflation: We’ve also received requests today for our PMI Playbook. On the PMI side, we posted yesterday about inflationary PMI cycles being fundamentally different. They tend to be longer and deeper. This should be no surprise. To quote the great economist Jimmy Cliff, ‘The Harder They Come, the Harder They Fall’. In 8 cycles since 1951, average ISM correction is 13.6 months. Since November 2022, we are now in month 21 (ie. ‘The Greatest Unwind’). The thing that has been different this time is that in the previous inflationary corrections, ISM trough has been on average ~35.8 (big recession). This could be a future concern, because the 2020 trough on the ISM was ~42.4 – a pretty mild outcome really, under the circumstances.
ISM -- Double Dip?:
1. The ISM Chairman: “U.S. manufacturing activity entered deeper into contraction. Demand was weak again, output declined, and inputs stayed generally accommodative. Demand slowing was reflected by the (1) New Orders Index dropping further into contraction, (2) New Export Orders Index continuing in contraction, (3) Backlog of Orders Index remaining in strong contraction territory, and (4) Customers’ Inventories Index moving lower to the higher end of ‘too low’".
2. “Demand remains subdued, as companies show an unwillingness to invest in capital and inventory due to current federal monetary policy and other conditions. Production execution was down compared to June, likely adding to revenue declines, putting additional pressure on profitability".
3. Machinery Customer: “It seems that the economy is slowing down significantly. The number of sales calls received from new suppliers is increasing significantly. Our own order backlog is also diminishing. We are hoping for an increase in customer demand, or we will possibly need to make organizational changes.”
WHAT RESPONDENTS ARE SAYING
“Business is relatively flat — the same volume, but smaller orders.” [Chemical Products]
“Demand continued to soften into the second half of the year. Supply chain pipelines and inventories remain full, reducing the need for overtime. Geopolitical issues between China and Taiwan as well as the election in November remain weighing concerns.” [Transportation Equipment]
“Even though we are used to a seasonal reduction in business over the summer, consumer behavior is changing more than normal. Sales are lighter, and customer orders are coming in under forecasts. It seems consumers are starting to pull back on spending.” [Food, Beverage & Tobacco Products]
“Availability of parts is good, with small exceptions of missing materials here and there. Ordering is still well below typical levels as we continue to burn down inventory of raw goods, with ‘normal’ ordering trends expected to return sometime in the second half of 2024.” [Computer & Electronic Products]
“It seems that the economy is slowing down significantly. The number of sales calls received from new suppliers is increasing significantly. Our own order backlog is also diminishing. We are hoping for an increase in customer demand, or we will possibly need to make organizational changes.” [Machinery]
“Unfortunately, our business is experiencing the sharpest decline in order levels in a year. We were well below our budget target in June; as a result, it was the first month this year that we had negative net income.” [Fabricated Metal Products]
“Business is slowing, and we are taking cost actions.” [Electrical Equipment, Appliances & Components]
“Some markets that are usually unwavering are showing weakness. Weather is the common factor, but only so much.” [Nonmetallic Mineral Products]
“Our sales forecast for July and August are slow, but we’re making every attempt to remedy that situation. Our medical end-user customers continue to meet their forecasts, which is promising.” [Textile Mills]
“Elevated financing costs have dampened demand for residential investment. This has reduced our need for component products and inventory.” [Wood Products]
1. ISM -- The Greatest Unwind: In our PMI Playbook in late 2023, we drew a careful distinction between PMI Classic and PMI Inflation cycles. Our core argument has been that inflationary cycles take longer to normalise, because of the associated supply chain effects. This has proven to be the case. Today's ISM data now confirms the post-Covid cycle as The Greatest Unwind in 8 cycles since 1956, lasting ~21 months.
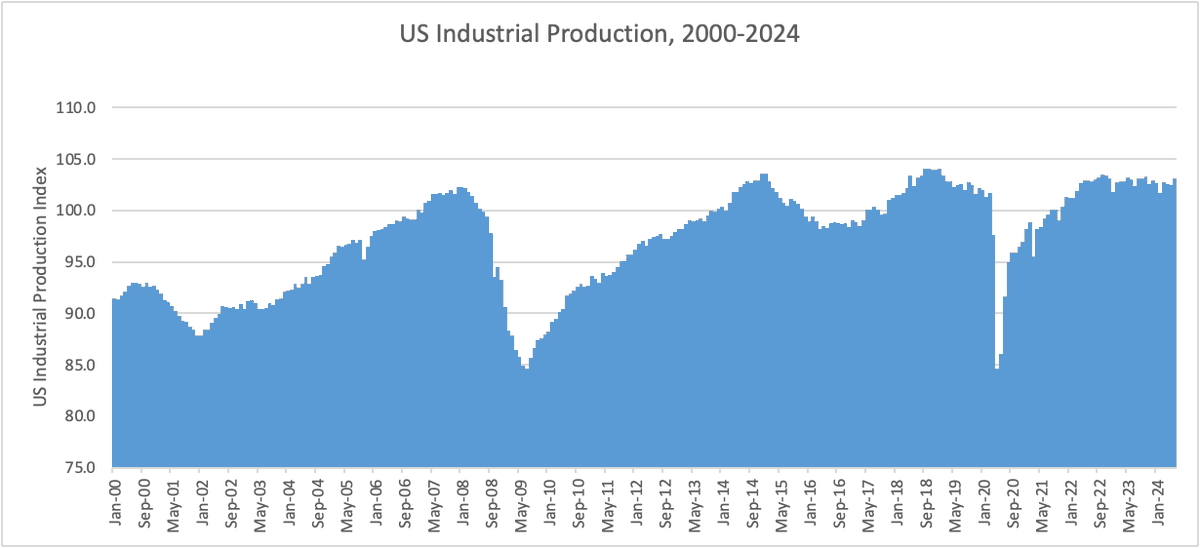
2. 2020 Not a True IP Recession: The inflation spike of 2021-22 was the third most powerful in the post-War era, albeit more moderate than 1973-74 and 1978-82. As the charts clearly show, ALL other inflationary cycles have been accompanied by a meaningful IP recession. We would think carefully about what happened in 2020: this was a voluntary production shutdown, not a demand recession provoked by higher rates.
3. Double-Dip: Although the duration of this ISM cycle has been as long as we thought, it has not been as deep. We were surprised to see an apparent ISM trough at ~41.8, whereas in the 7 precedents in our PMI Playbook, the average trough was closer to ~35. Although every cycle is different, we like to play the odds most of the time. Investors should entertain the possibility of a double-dip situation here. Election timing doesn't help.
Quanta Services (PWR) is an interesting read on the T&D sector – following the negative organic growth -1% YoY 2Q24 at Hubbell Utility Solutions, we thought we’d listen in. Overall numbers are fine. There’s a MSD revenue upgrade and stock is trading flattish. However, its distribution business (mainly underground) posted an ~11% YoY decline and EBIT margin fell from 8.6% to 7.3% YoY. This area got a lot of attention on the call, rightly so. Here’s what management said (please forgive my bad transcription):
Brief take: This is an EPC business trading at ~50x EPS. The management commentary highlights the never-ending two way between the NEED for new infrastructure (undisputed), and the PRACTICAL realities of implementing it. The average age of transformers is >40 years – we were writing that in 2003, a year when the whole US T&D system invested ~$4bn. Yes, check the EEI data. Now, we are in a >$25bn range – and transformers are still >40 years old. Investors should entertain the possibility that the grid may never be new and shiny, and working perfectly. The key question is what needs to happen on the regulatory side – the demand argument is old and boring.
1. “We run our business as a portfolio, and look at it as a portfolio. Tou see a remediation between different segments. Utility capex budgets involve, gas, renewables – they don’t always have the capex for underground distribution. Projects move back and forth. We don’t need it [underground distribution] to make the mid-point of the range”.
2. Q: “Utility capex budgets are under ~50% for the first half – do you expect to see a ramp back in distribution spend? A: When you look at both T and D, we are up ~9% for the year. There are [project] movements around different utilities. There’s some good distribution spending out West (CA) due to EV. There are ups and downs, and different regulatory impacts”.
3. “We are not concerned by the top-line. The technology sector back stops everything. CHIPS, IRA, Hyperscalers will drive the business beyond the election. Load growth continues. The country needs more transmission”.
4. “There has been public outcry around shutdowns. If you want [to fix] that, spend a trillion dollars and underground it. You cannot put [lines] on poles. It’s expensive and it costs money. We have to be out there, looking at solutions. We are in political season, so it’s fun times around. Once we’re through that, we can get the country moving.”
5. “We have had some shift in larger [project] work. Some of it has just been pushed out. It may still come back in. It’s an election year, so we’ll be prudent on how we guide. We see some movement in distribution where utilities have moved capex into other areas, eg. renewables or electric segment”.
1. Schneider: Schneider’s 1H24 results have been well-received, not surprising given moderate growth beats and another ~100bps margin expansion. Beneath the surface, a couple of things to focus on: (1) If Schneider delivered 18.6% EBITA margin in 1H24, why should that be so much lower – an implied 17.8% – in the second half? (2) We don’t especially like the massive ~15% spread between Products (+1%) and Systems (+16%) YoY growth. In a business that has been on fire, why is the core Product offering (~52%) barely growing at all? Maybe this is just the differential of what’s happening with the ongoing automation unwind – but it reminded us a lot of yesterday’s growth puzzle on Hubbell (more later). Let’s not see ghouls lurking in doorways, but Electrification businesses globally have been trading at silly multiples for a while.
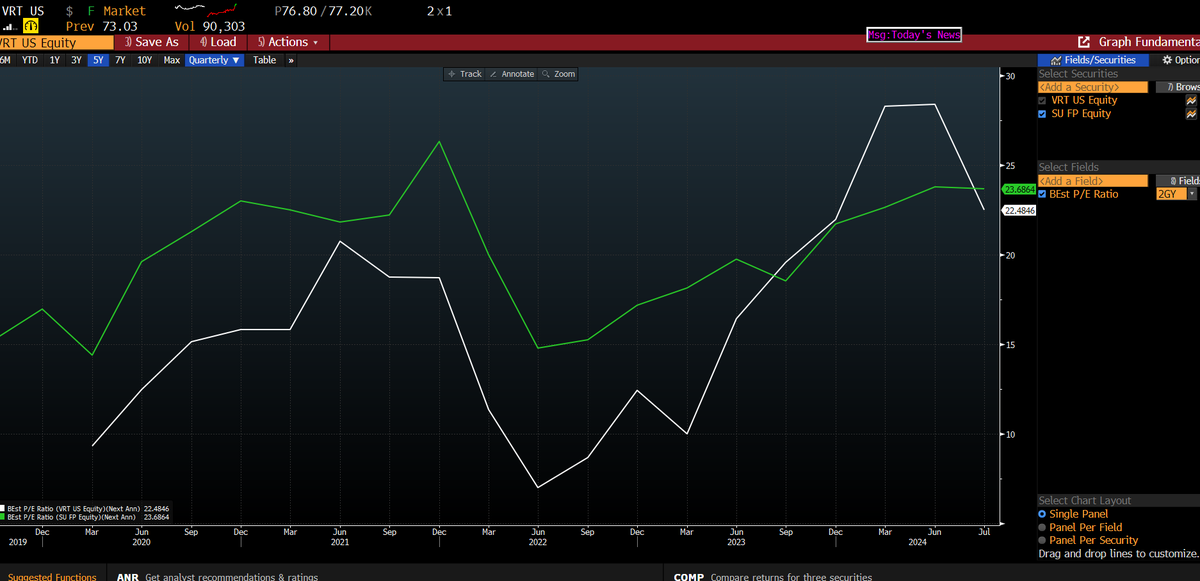
2. Vertiv: We wrote a few days ago about the apparent growth disappointment at Vertiv (see our X feed). The bear case is that 2Q24 was some kind of pull-forward on demand, and the company now hits an air pocket on orders in the second half. We disagree. Our view is that trend-line demand is just fine, as per MSFT comments last night. The sharp sell-off since VRT results is an over-reaction. Indeed, Vertiv has just crossed back below Schneider’s valuation, see chart below. Vertiv trades FY25 PE 22x, 15x EV/EBITDA and ~4.5% FCF yield. Schneider is at FY25 PE, 16x EV/EBITDA and ~3.9% FCF yield.
3. Valuation: Vertiv is a pure play in the DC sweet spot (~75%). Schneider is a best-in class business in European Large Cap. However, its financial reporting is less transparent than it used to be. A lot of folks we talk to don’t seem to know what it actually does. For the record, Schneider is a broad-based ~$41bn engineering business spanning circuit breakers, switchgear, panels, push buttons, contactors, starters, PLC and all kinds of funky components that go into Construction, Datacenter, Utilities and a variety of Process markets. It has grown more than peers, and has highest the TSR in our coverage group. However, any relative valuation comparison is a judgement call around a multitude of factors. Valuation never matters until it does. We are approaching the moment that people will care about valuation a lot.
4. Hubbell – does no-one else mind that in a ‘once-in-a-generation’ grid investment super cycle, an electrical widget company selling ~64% into Utilities isn’t growing? Nothing to see here? Utility sales are DOWN -1% YoY in 2Q24, with its core product area off ~6% YoY. And that’s after positive pricing. Operating margin in Utility Solutions declines from 25.6% to 24.0% YoY. Yes, one-time effects in Telecom (~10% of division) and Distribution still seeing an inventory unwind (who knew?). Supposedly, Transmission is double-digit robust. Doesn’t matter. If growth carries on like this, investors are not going to care much about splitting hairs in T versus D. These stocks are priced for fabulous growth, not the historic trend-line. HUBB trades FY25 16x EV/EBITDA, PE 22x.




![oxcapanalytics's tweet photo. The End of Revenge Capex: We read a lot of macro stuff about consumers engaging in ‘revenge spending’ since Covid ended. Looking at the charts below, we wonder if the same thing has been going on, on the corporate side. We took a look at the capex spend and intentions of ~72 companies in seven different industries since the GFC. We found that between 2010 and 2019, capex was growing at a boring ~2.7% CAGR. However, between 2019 and 2024, the combined capex has absolutely BOOMED from ~$392bn to ~$606bn, a stunning +55% gain. Sure, we get why Pharma and Semis are going up – but we’ve also been reading some fairly comical explanations about unprecedented demand for pet food and pork chops. Anyway, we’ve included recent company quotes which show that this phase of corporate excess may be ending. Automotive is bordering on a crisis (which is widely understood from Detroit to Wolfsburg), but we’d pay greater attention to below-the-radar statements like those from Moderna, Nestle, Pepsi. Even the tone in Semis has shifted. It’s funny to think that just a year or so ago, we were all in an new "Industrial Super-cycle". As of yesterday, we’ve seen ~23 months of contractionary ISM! Oxcap was in China last week. In >20 years we have never seen the situation this bad, a total collapse of confidence. So governments can just keep on stimulating and Wall Street can just keep on buying…just keep it going, please! Makes sense.
"One Company's Capex is Another Company's Sales" Figure 1: Recent Capex Commentary
1. Volkswagen (Autos) “Capex is currently at an elevated level with the high upfront investments in battery and software, as well as execution of our regional strategies…..it's our clear ambition to reduce investment in R&D and Capex to well below €170 billion between 2025 and 2029” (3Q24)
2. Ford (Autos) “Today’s electric vehicle consumers are more cost-conscious than early adopters. This, coupled with scores of new electric vehicle choices hitting the market over the next 12 months and rising compliance requirements, has amplified pricing pressures. With pricing and margin compression, we’ve made the decision to adjust our product and technology roadmap and industrial footprint”. (August 2024)
3. Stellantis (Autos) “We were in a dynamic of R&D/Capex and M&A expenses that proved to be too high, and we are now fixing that. As we move forward you're going to see us spend almost 60% on purely future-focused items: multi-energy platforms, software etc.” (June 2024 Investor Day)
4. NIO (Batteries) "We're making prudent control under management of the pace of our investment and expenses. We have already started by postponing certain projects or even cancelling some projects. The R&D or the Capex in the year of 2024 will be significantly lower than that in 2023." (2Q24 Call)
5. Moderna (Pharma) Capital expenditures will come down dramatically. So, this year we started with cash at $13 billion. We're going to $9 billion in cash, that's a $4 billion burn. But we're spending $900 million in capital expenditures in the year 2024. In 2025, we're spending $300 million. So, that's a $600 million reduction. (September 2024 CMD)
6. Intel (Semis) "We now expect gross Capex in 2024 to be between $25 billion and $27 billion. That is a reduction of over 20% from our plan entering the year and additionally reflects expectations for softer second half demand. For 2025, gross capital spending is targeted between $20 billion and $23 billion."
7. Nestle (Food) “Capex was temporarily elevated because we were putting in extra capacity [pet adoption a driver for Purina]. I think over time this will come down to around 5% as per the algorithm that we put forward for the year 2025.” (May 2024)
8. Pepsi (Beverage) “We've been very intentional about the [higher] levels of capital we've invested in the business. Part of that was to catch up on capacity. We're currently in the midst of big investments in IT and digitalization but over time, I think you'll see the level of Capex as a percent of sales begin to trend down” (Feb 2024)
9. AT&T (Telecom) "We may have run at a bit of higher than maybe traditional levels of capital investment in the business. It's come down from peak and it will continue to drop down.” (September 2024)
10. SMIC (Semis) “With more and more capacity building based on geopolitical considerations, coupled with the macroeconomic cycle and lagging consumption, in the short term it will be difficult for foundries to achieve high utilization.” (Feb 2024)](https://pbs.twimg.com/media/GY3uR4WXkAAJRVl.png)
![oxcapanalytics's tweet photo. The End of Revenge Capex: We read a lot of macro stuff about consumers engaging in ‘revenge spending’ since Covid ended. Looking at the charts below, we wonder if the same thing has been going on, on the corporate side. We took a look at the capex spend and intentions of ~72 companies in seven different industries since the GFC. We found that between 2010 and 2019, capex was growing at a boring ~2.7% CAGR. However, between 2019 and 2024, the combined capex has absolutely BOOMED from ~$392bn to ~$606bn, a stunning +55% gain. Sure, we get why Pharma and Semis are going up – but we’ve also been reading some fairly comical explanations about unprecedented demand for pet food and pork chops. Anyway, we’ve included recent company quotes which show that this phase of corporate excess may be ending. Automotive is bordering on a crisis (which is widely understood from Detroit to Wolfsburg), but we’d pay greater attention to below-the-radar statements like those from Moderna, Nestle, Pepsi. Even the tone in Semis has shifted. It’s funny to think that just a year or so ago, we were all in an new "Industrial Super-cycle". As of yesterday, we’ve seen ~23 months of contractionary ISM! Oxcap was in China last week. In >20 years we have never seen the situation this bad, a total collapse of confidence. So governments can just keep on stimulating and Wall Street can just keep on buying…just keep it going, please! Makes sense.
"One Company's Capex is Another Company's Sales" Figure 1: Recent Capex Commentary
1. Volkswagen (Autos) “Capex is currently at an elevated level with the high upfront investments in battery and software, as well as execution of our regional strategies…..it's our clear ambition to reduce investment in R&D and Capex to well below €170 billion between 2025 and 2029” (3Q24)
2. Ford (Autos) “Today’s electric vehicle consumers are more cost-conscious than early adopters. This, coupled with scores of new electric vehicle choices hitting the market over the next 12 months and rising compliance requirements, has amplified pricing pressures. With pricing and margin compression, we’ve made the decision to adjust our product and technology roadmap and industrial footprint”. (August 2024)
3. Stellantis (Autos) “We were in a dynamic of R&D/Capex and M&A expenses that proved to be too high, and we are now fixing that. As we move forward you're going to see us spend almost 60% on purely future-focused items: multi-energy platforms, software etc.” (June 2024 Investor Day)
4. NIO (Batteries) "We're making prudent control under management of the pace of our investment and expenses. We have already started by postponing certain projects or even cancelling some projects. The R&D or the Capex in the year of 2024 will be significantly lower than that in 2023." (2Q24 Call)
5. Moderna (Pharma) Capital expenditures will come down dramatically. So, this year we started with cash at $13 billion. We're going to $9 billion in cash, that's a $4 billion burn. But we're spending $900 million in capital expenditures in the year 2024. In 2025, we're spending $300 million. So, that's a $600 million reduction. (September 2024 CMD)
6. Intel (Semis) "We now expect gross Capex in 2024 to be between $25 billion and $27 billion. That is a reduction of over 20% from our plan entering the year and additionally reflects expectations for softer second half demand. For 2025, gross capital spending is targeted between $20 billion and $23 billion."
7. Nestle (Food) “Capex was temporarily elevated because we were putting in extra capacity [pet adoption a driver for Purina]. I think over time this will come down to around 5% as per the algorithm that we put forward for the year 2025.” (May 2024)
8. Pepsi (Beverage) “We've been very intentional about the [higher] levels of capital we've invested in the business. Part of that was to catch up on capacity. We're currently in the midst of big investments in IT and digitalization but over time, I think you'll see the level of Capex as a percent of sales begin to trend down” (Feb 2024)
9. AT&T (Telecom) "We may have run at a bit of higher than maybe traditional levels of capital investment in the business. It's come down from peak and it will continue to drop down.” (September 2024)
10. SMIC (Semis) “With more and more capacity building based on geopolitical considerations, coupled with the macroeconomic cycle and lagging consumption, in the short term it will be difficult for foundries to achieve high utilization.” (Feb 2024)](https://pbs.twimg.com/media/GY3uPB8WYAAIyuT.png)
![oxcapanalytics's tweet photo. The End of Revenge Capex: We read a lot of macro stuff about consumers engaging in ‘revenge spending’ since Covid ended. Looking at the charts below, we wonder if the same thing has been going on, on the corporate side. We took a look at the capex spend and intentions of ~72 companies in seven different industries since the GFC. We found that between 2010 and 2019, capex was growing at a boring ~2.7% CAGR. However, between 2019 and 2024, the combined capex has absolutely BOOMED from ~$392bn to ~$606bn, a stunning +55% gain. Sure, we get why Pharma and Semis are going up – but we’ve also been reading some fairly comical explanations about unprecedented demand for pet food and pork chops. Anyway, we’ve included recent company quotes which show that this phase of corporate excess may be ending. Automotive is bordering on a crisis (which is widely understood from Detroit to Wolfsburg), but we’d pay greater attention to below-the-radar statements like those from Moderna, Nestle, Pepsi. Even the tone in Semis has shifted. It’s funny to think that just a year or so ago, we were all in an new "Industrial Super-cycle". As of yesterday, we’ve seen ~23 months of contractionary ISM! Oxcap was in China last week. In >20 years we have never seen the situation this bad, a total collapse of confidence. So governments can just keep on stimulating and Wall Street can just keep on buying…just keep it going, please! Makes sense.
"One Company's Capex is Another Company's Sales" Figure 1: Recent Capex Commentary
1. Volkswagen (Autos) “Capex is currently at an elevated level with the high upfront investments in battery and software, as well as execution of our regional strategies…..it's our clear ambition to reduce investment in R&D and Capex to well below €170 billion between 2025 and 2029” (3Q24)
2. Ford (Autos) “Today’s electric vehicle consumers are more cost-conscious than early adopters. This, coupled with scores of new electric vehicle choices hitting the market over the next 12 months and rising compliance requirements, has amplified pricing pressures. With pricing and margin compression, we’ve made the decision to adjust our product and technology roadmap and industrial footprint”. (August 2024)
3. Stellantis (Autos) “We were in a dynamic of R&D/Capex and M&A expenses that proved to be too high, and we are now fixing that. As we move forward you're going to see us spend almost 60% on purely future-focused items: multi-energy platforms, software etc.” (June 2024 Investor Day)
4. NIO (Batteries) "We're making prudent control under management of the pace of our investment and expenses. We have already started by postponing certain projects or even cancelling some projects. The R&D or the Capex in the year of 2024 will be significantly lower than that in 2023." (2Q24 Call)
5. Moderna (Pharma) Capital expenditures will come down dramatically. So, this year we started with cash at $13 billion. We're going to $9 billion in cash, that's a $4 billion burn. But we're spending $900 million in capital expenditures in the year 2024. In 2025, we're spending $300 million. So, that's a $600 million reduction. (September 2024 CMD)
6. Intel (Semis) "We now expect gross Capex in 2024 to be between $25 billion and $27 billion. That is a reduction of over 20% from our plan entering the year and additionally reflects expectations for softer second half demand. For 2025, gross capital spending is targeted between $20 billion and $23 billion."
7. Nestle (Food) “Capex was temporarily elevated because we were putting in extra capacity [pet adoption a driver for Purina]. I think over time this will come down to around 5% as per the algorithm that we put forward for the year 2025.” (May 2024)
8. Pepsi (Beverage) “We've been very intentional about the [higher] levels of capital we've invested in the business. Part of that was to catch up on capacity. We're currently in the midst of big investments in IT and digitalization but over time, I think you'll see the level of Capex as a percent of sales begin to trend down” (Feb 2024)
9. AT&T (Telecom) "We may have run at a bit of higher than maybe traditional levels of capital investment in the business. It's come down from peak and it will continue to drop down.” (September 2024)
10. SMIC (Semis) “With more and more capacity building based on geopolitical considerations, coupled with the macroeconomic cycle and lagging consumption, in the short term it will be difficult for foundries to achieve high utilization.” (Feb 2024)](https://pbs.twimg.com/media/GY3uIqHXoAAqyNk.png)





![oxcapanalytics's tweet photo. The End of Revenge Capex: We read a lot of macro stuff about consumers engaging in ‘revenge spending’ since Covid ended. Looking at the charts below, we wonder if the same thing has been going on, on the corporate side. We took a look at the capex spend and intentions of ~72 companies in seven different industries since the GFC. We found that between 2010 and 2019, capex was growing at a boring ~2.7% CAGR. However, between 2019 and 2024, the combined capex has absolutely BOOMED from ~$392bn to ~$606bn, a stunning +55% gain. Sure, we get why Pharma and Semis are going up – but we’ve also been reading some fairly comical explanations about unprecedented demand for pet food and pork chops. Anyway, we’ve included recent company quotes which show that this phase of corporate excess may be ending. Automotive is bordering on a crisis (which is widely understood from Detroit to Wolfsburg), but we’d pay greater attention to below-the-radar statements like those from Moderna, Nestle, Pepsi. Even the tone in Semis has shifted. It’s funny to think that just a year or so ago, we were all in an new "Industrial Super-cycle". As of yesterday, we’ve seen ~23 months of contractionary ISM! Oxcap was in China last week. In >20 years we have never seen the situation this bad, a total collapse of confidence. So governments can just keep on stimulating and Wall Street can just keep on buying…just keep it going, please! Makes sense.
"One Company's Capex is Another Company's Sales" Figure 1: Recent Capex Commentary
1. Volkswagen (Autos) “Capex is currently at an elevated level with the high upfront investments in battery and software, as well as execution of our regional strategies…..it's our clear ambition to reduce investment in R&D and Capex to well below €170 billion between 2025 and 2029” (3Q24)
2. Ford (Autos) “Today’s electric vehicle consumers are more cost-conscious than early adopters. This, coupled with scores of new electric vehicle choices hitting the market over the next 12 months and rising compliance requirements, has amplified pricing pressures. With pricing and margin compression, we’ve made the decision to adjust our product and technology roadmap and industrial footprint”. (August 2024)
3. Stellantis (Autos) “We were in a dynamic of R&D/Capex and M&A expenses that proved to be too high, and we are now fixing that. As we move forward you're going to see us spend almost 60% on purely future-focused items: multi-energy platforms, software etc.” (June 2024 Investor Day)
4. NIO (Batteries) "We're making prudent control under management of the pace of our investment and expenses. We have already started by postponing certain projects or even cancelling some projects. The R&D or the Capex in the year of 2024 will be significantly lower than that in 2023." (2Q24 Call)
5. Moderna (Pharma) Capital expenditures will come down dramatically. So, this year we started with cash at $13 billion. We're going to $9 billion in cash, that's a $4 billion burn. But we're spending $900 million in capital expenditures in the year 2024. In 2025, we're spending $300 million. So, that's a $600 million reduction. (September 2024 CMD)
6. Intel (Semis) "We now expect gross Capex in 2024 to be between $25 billion and $27 billion. That is a reduction of over 20% from our plan entering the year and additionally reflects expectations for softer second half demand. For 2025, gross capital spending is targeted between $20 billion and $23 billion."
7. Nestle (Food) “Capex was temporarily elevated because we were putting in extra capacity [pet adoption a driver for Purina]. I think over time this will come down to around 5% as per the algorithm that we put forward for the year 2025.” (May 2024)
8. Pepsi (Beverage) “We've been very intentional about the [higher] levels of capital we've invested in the business. Part of that was to catch up on capacity. We're currently in the midst of big investments in IT and digitalization but over time, I think you'll see the level of Capex as a percent of sales begin to trend down” (Feb 2024)
9. AT&T (Telecom) "We may have run at a bit of higher than maybe traditional levels of capital investment in the business. It's come down from peak and it will continue to drop down.” (September 2024)
10. SMIC (Semis) “With more and more capacity building based on geopolitical considerations, coupled with the macroeconomic cycle and lagging consumption, in the short term it will be difficult for foundries to achieve high utilization.” (Feb 2024)](https://pbs.twimg.com/media/GY3uVpoXAAAr3iK.png)


![oxcapanalytics's tweet photo. ISM -- Double Dip?:
1. The ISM Chairman: “U.S. manufacturing activity entered deeper into contraction. Demand was weak again, output declined, and inputs stayed generally accommodative. Demand slowing was reflected by the (1) New Orders Index dropping further into contraction, (2) New Export Orders Index continuing in contraction, (3) Backlog of Orders Index remaining in strong contraction territory, and (4) Customers’ Inventories Index moving lower to the higher end of ‘too low’".
2. “Demand remains subdued, as companies show an unwillingness to invest in capital and inventory due to current federal monetary policy and other conditions. Production execution was down compared to June, likely adding to revenue declines, putting additional pressure on profitability".
3. Machinery Customer: “It seems that the economy is slowing down significantly. The number of sales calls received from new suppliers is increasing significantly. Our own order backlog is also diminishing. We are hoping for an increase in customer demand, or we will possibly need to make organizational changes.”
WHAT RESPONDENTS ARE SAYING
“Business is relatively flat — the same volume, but smaller orders.” [Chemical Products]
“Demand continued to soften into the second half of the year. Supply chain pipelines and inventories remain full, reducing the need for overtime. Geopolitical issues between China and Taiwan as well as the election in November remain weighing concerns.” [Transportation Equipment]
“Even though we are used to a seasonal reduction in business over the summer, consumer behavior is changing more than normal. Sales are lighter, and customer orders are coming in under forecasts. It seems consumers are starting to pull back on spending.” [Food, Beverage & Tobacco Products]
“Availability of parts is good, with small exceptions of missing materials here and there. Ordering is still well below typical levels as we continue to burn down inventory of raw goods, with ‘normal’ ordering trends expected to return sometime in the second half of 2024.” [Computer & Electronic Products]
“It seems that the economy is slowing down significantly. The number of sales calls received from new suppliers is increasing significantly. Our own order backlog is also diminishing. We are hoping for an increase in customer demand, or we will possibly need to make organizational changes.” [Machinery]
“Unfortunately, our business is experiencing the sharpest decline in order levels in a year. We were well below our budget target in June; as a result, it was the first month this year that we had negative net income.” [Fabricated Metal Products]
“Business is slowing, and we are taking cost actions.” [Electrical Equipment, Appliances & Components]
“Some markets that are usually unwavering are showing weakness. Weather is the common factor, but only so much.” [Nonmetallic Mineral Products]
“Our sales forecast for July and August are slow, but we’re making every attempt to remedy that situation. Our medical end-user customers continue to meet their forecasts, which is promising.” [Textile Mills]
“Elevated financing costs have dampened demand for residential investment. This has reduced our need for component products and inventory.” [Wood Products]](https://pbs.twimg.com/media/GT55ch1WEAAo0mp.png)