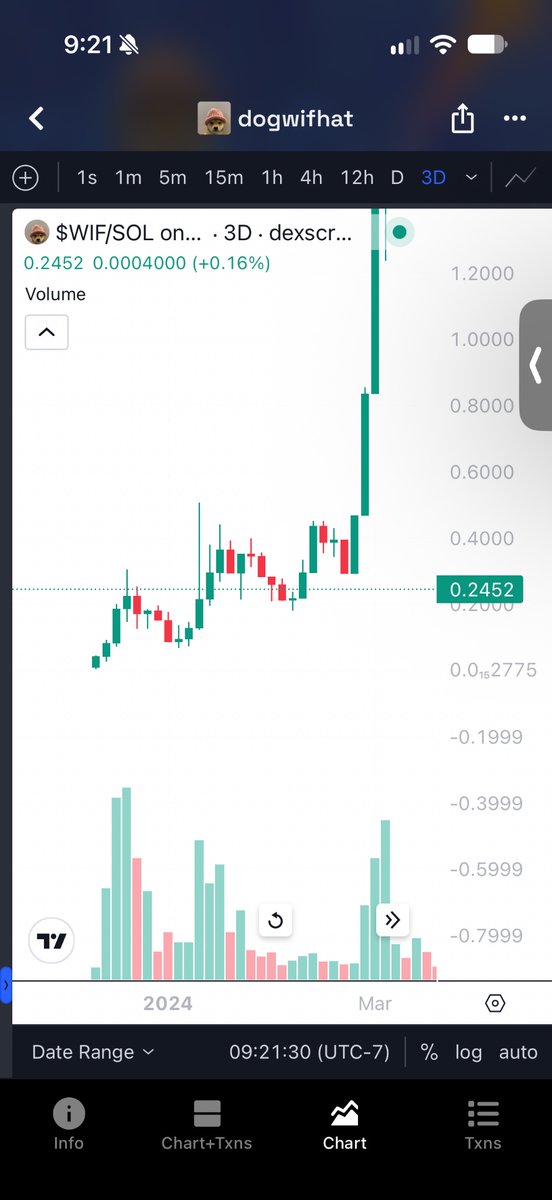
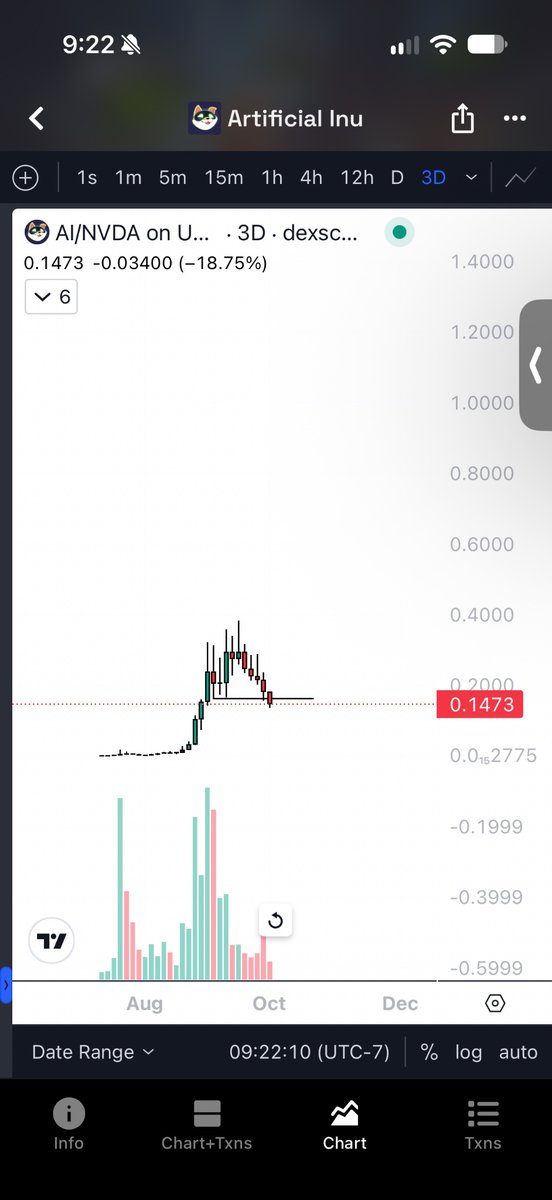
Comparing the 3D charts of early wif price action with ai
That big selloff on wif from 400m to sub 200m made me capitulate hard and think it was over. In hindsight that was dumb
Not tryna let that happen again with wif
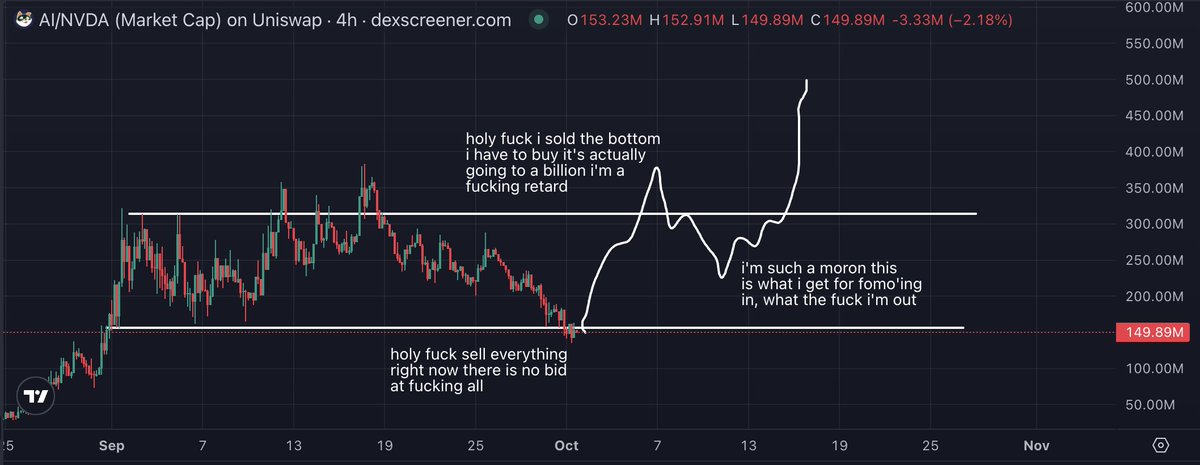
@SolSwizzle what do you think of the 2 charts of early wif days and ai right now where the run up and big selloff looks the same, especially with the same sentiment (aka its over)
Very plausible but I’m skeptical.
AI was already range bound for a while and tapped ATH like 3 or 5 times in that range before recent break.
That, coupled with massive tests of strength (2x 7 fig one clips) + rising majors (BTC above 80K) feels primed for continuation up.