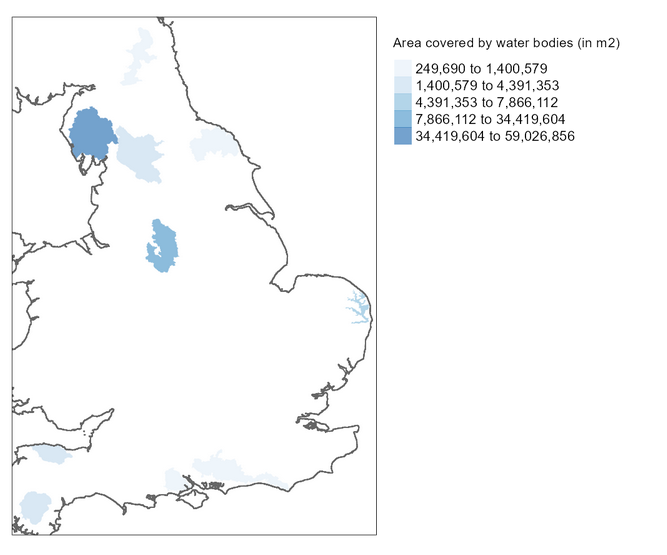
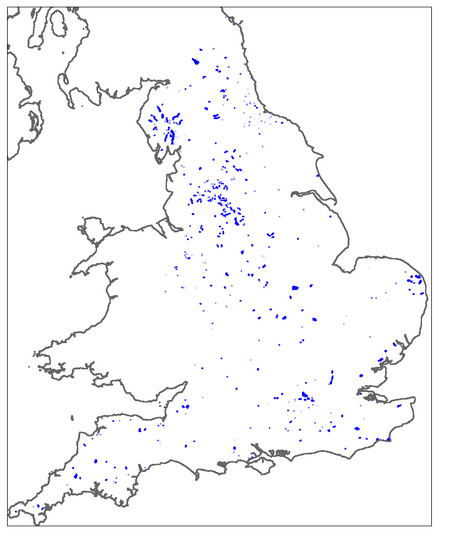
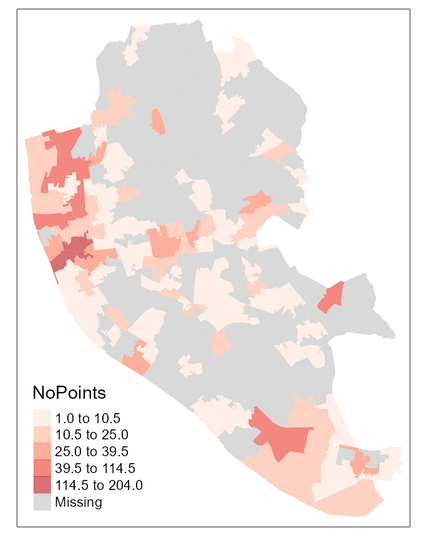
Our new #rstats package with @Fcorowe is out on #CRAN! Using #rspatial functionalities it provides summary statistics of local geospatial features within a given geographic area. More info here: https://t.co/01to6chicR 1/2
#gis#gischat
Glad to see this paper being recognised! Led by @pat_nikos in collaboration w/ @darribas, this paper shows how areas have evolved changing their population composition from 1970 to 2011. I did a deep dive into @nikos work 👉https://t.co/xDKNNGjuye
Paper: https://t.co/53B0UmgR1i
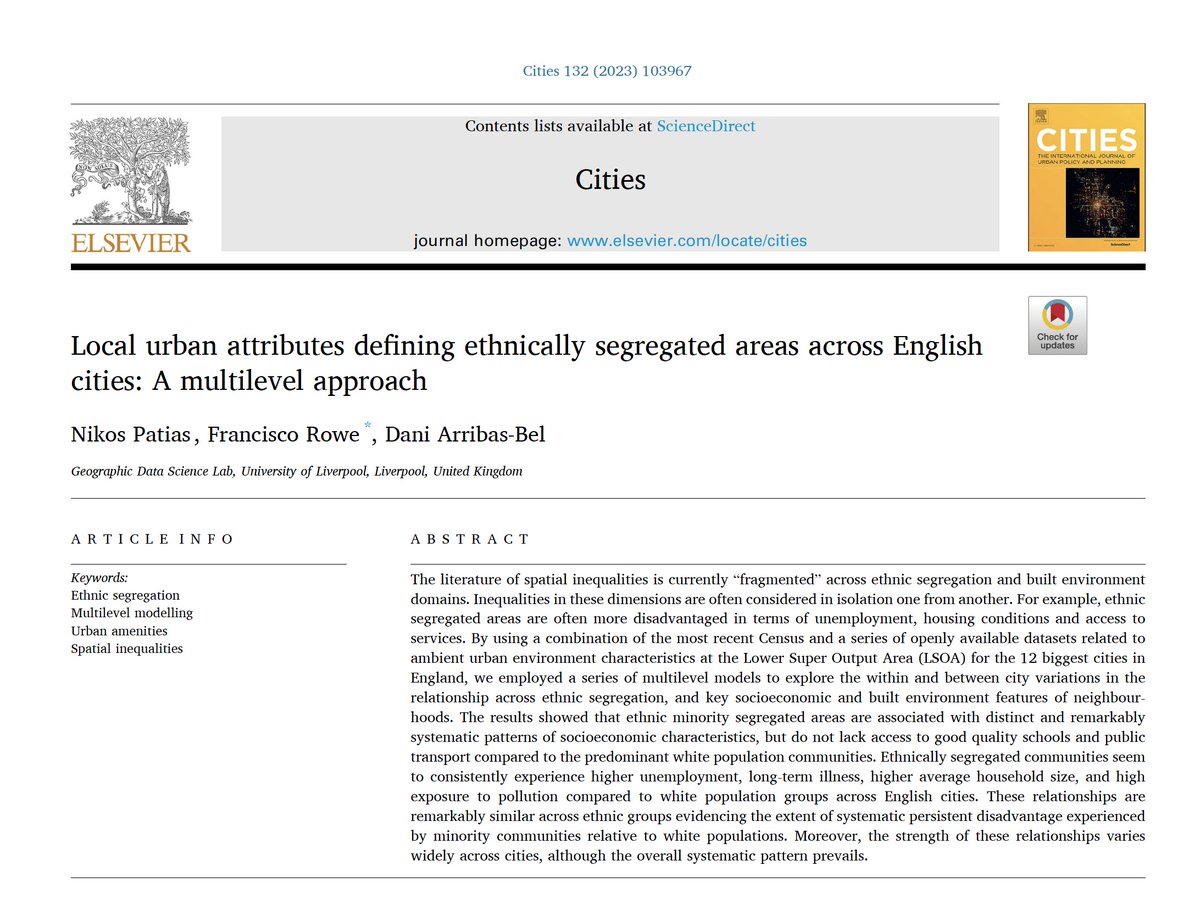
💫 Fresh from the oven, new paper in Cities w/ @darribas & led by the fantastic @pat_nikos. The last paper from his PhD saga 👏
🔓 https://t.co/Mgjo1MGc69
🧵1/n
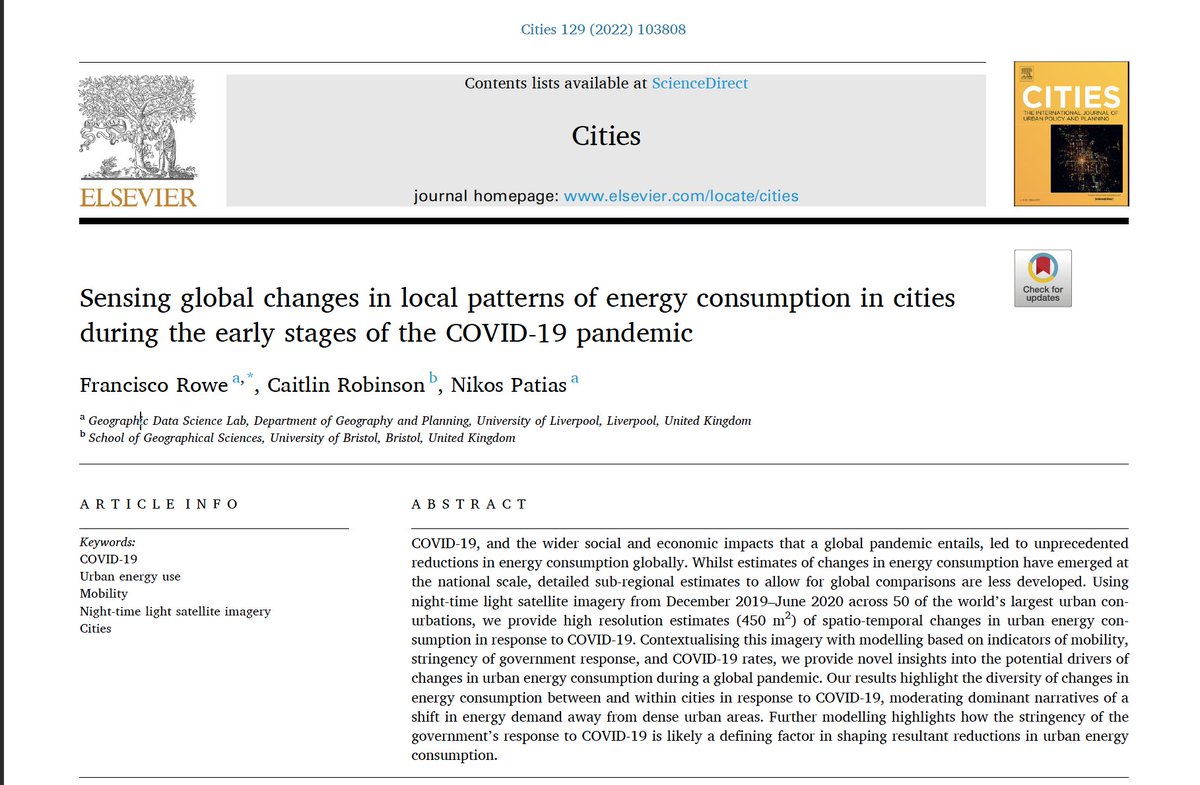
📯Finally out! New paper w/ @CaitHRobin (@BristolUni) & @pat_nikos (@OECD_local) in Cities. We analysed the impacts of the #COVID-19 pandemic on the spatial patterns of urban energy use 💡
🔓https://t.co/GCiopGEeM6
🧵
Back to Twitter! First of all, best wishes for everyone during 2022!🎆
New year, new paper! in @data_and_policy https://t.co/pLChXcFIS2
Using @Twitter to track immigration sentiment during #COVID-19🦠
Result of joint work w/ @IOM_GMDAC/@UNmigration & @DataScienceUDD
🧵1/n
So PhD is officially done! Many thanks to my supervisors @Fcorowe and @darribas for their massive help and support as well as my examiners @adam_dennett and @alexsingleton for a very fruitful discussion! Finally, thanks to @OrdnanceSurvey and @DataCDT for the support.
🥳🥳🥳Big @geodatascience win yesterday. @pat_nikos passed his viva. You can now call him Dr Patias! He's been a superb student, colleague & lab member. I've been lucky to supervise, co-author & learn from him..yeah you can learn so much from your PhD students
Openning 🧵 1/n
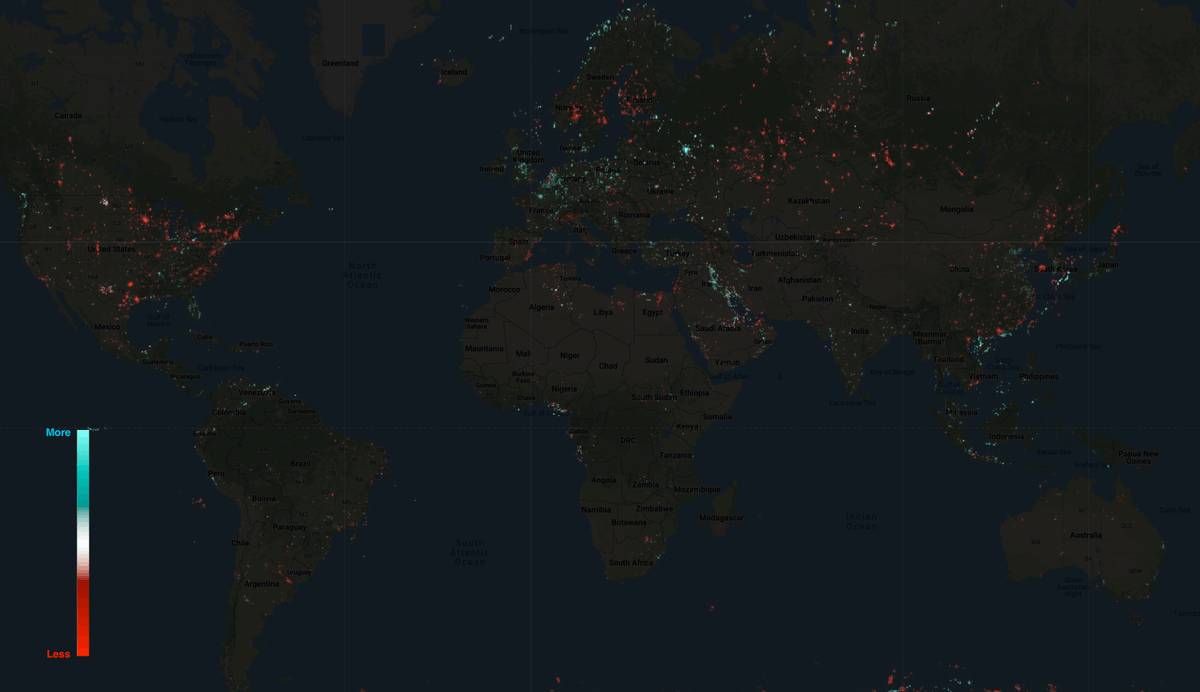
DAY THIRTY - METAMAPPING DAY 🌒 @fcorowe mapped changes in energy use during the early stages of #COVID19 globally using night-time 🛰 imagery. Joint work w/ @caithrobin & @pat_nikos 👉🏼 https://t.co/coOR51jeEI #30DayMapChallenge
DAY SEVENTEEN - LAND 🌆 @pat_nikos maps the Sustainable Urban Development Index that aims to promote sustainable urban land use and improve neighbourhood social cohesion https://t.co/FuofgBeYVd #30DayMapChallenge
New in The Geographical Journal: 'Trajectories of neighbourhood inequality in Britain: Unpacking inter-regional socioeconomic imbalances, 1971-2011' by @pat_nikos, Francisco Rowe, & @darribas (@geodatascience/ @livunigeog)
https://t.co/fQ011y7on8
🔥🔥get ready to submit your paper for the 2022 @GISRUK at @livuninews -organised by our awesome @geodatascience people @CaitHRobin & @Dr_Col_Nieve & supported by our excellent PhDs @pj_ballantyne @OliviaJH_@gekenyon & @NatalieRoseCDT
Call for papers ➡️ https://t.co/tngqUVN3yt
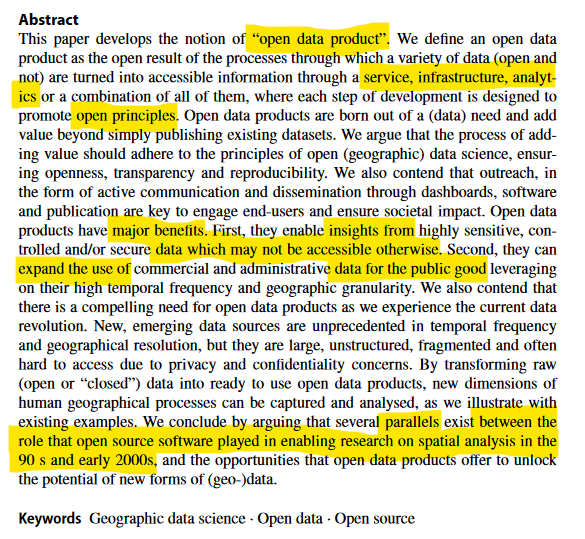
Together w/ @markalangreen, @Fcorowe and @alexsingleton, we have a new paper out in @JGeoSys pushing forward the idea of Open Data Products as a vehicle to make (Geographic) #DataScience more impactful. Open Access paper:
📜https://t.co/EVB08s4p9v
A quick 🧵to follow 👇
Finally, if you want to explore the spatial distribution of all the results presented in the paper, we have created a series of interactive maps https://t.co/0KJOfbqODc. n/n
New paper out on Landscape and Urban Planning with @Fcorowe , Stefano Cavazzi from @OrdnanceSurvey and @darribas . We present Sustainable urban indicators for Great Britain from 2001 to 2016 https://t.co/CwWVTIYoZR. Thread 1/n
This study can be used as a framework that can be applied to different settings. Take a look at extRatum package that can help on calculating simple yet useful spatial summary indicators https://t.co/01to6chicR. 8/n #RStats#rspatial