Last week, #California had some extreme fire activity. Here is the #BridgeFire and the #LineFire hotspots animated over the most active days.
Explore for yourself: https://t.co/mMsS1gLm6M
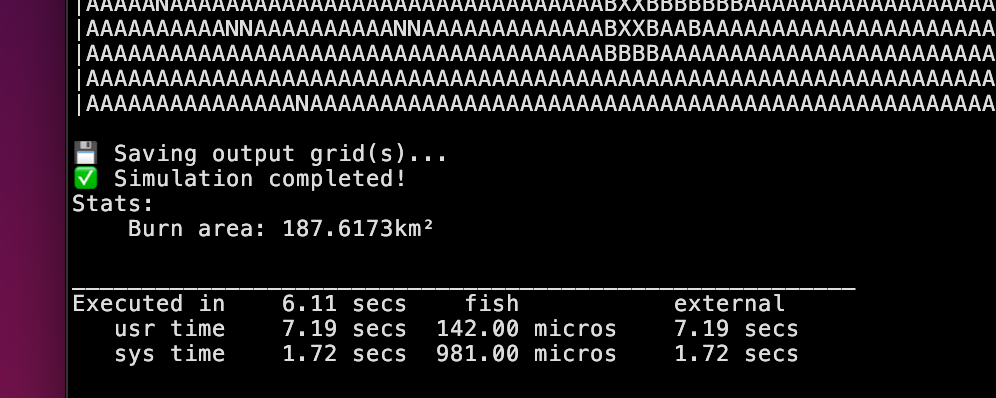
Wanna see something cool? We (@calebissharp) built a fire simulation model... in Rust... and it's blazing fast... also it outputs ASCII (for fun).
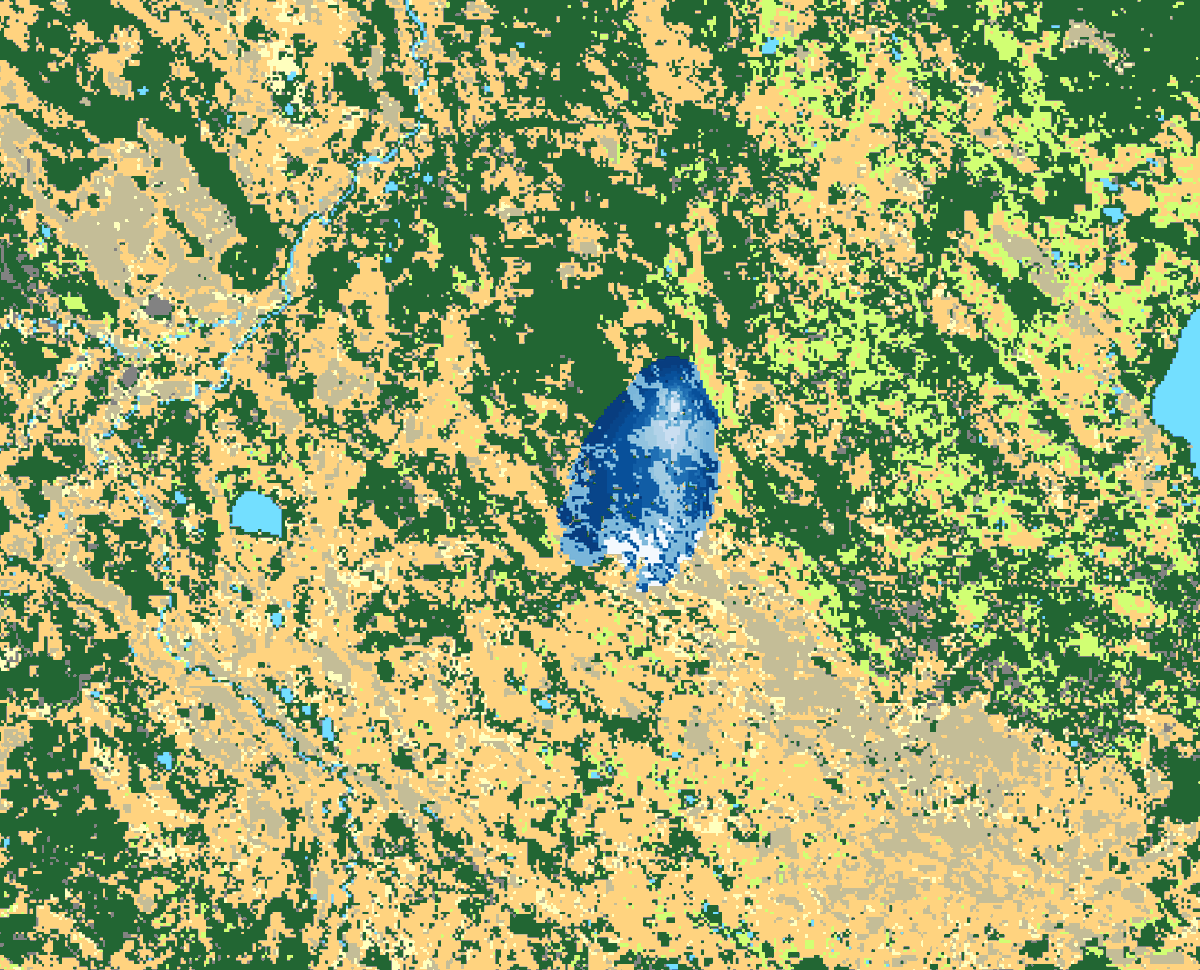
This dynamically pulls weather data, topography, fuel, runs a 12h burn period producing a 18,700ha fire all in 6 seconds.
#wildfire
Looking at #wildfire data often requires that you know exactly when a fire took place. It doesn't help you interact with or explore unfamiliar data.
Mother Nature just doesn't care about the fact that it's Saturday. 🗓️
Let's break down how we can do better. 🧵
How do we accurately measure and predict the evolving wildfire risk? We went on a deep dive and discovered some unexpected truths. Did any of them surprise you?
https://t.co/kNBbYayHZk
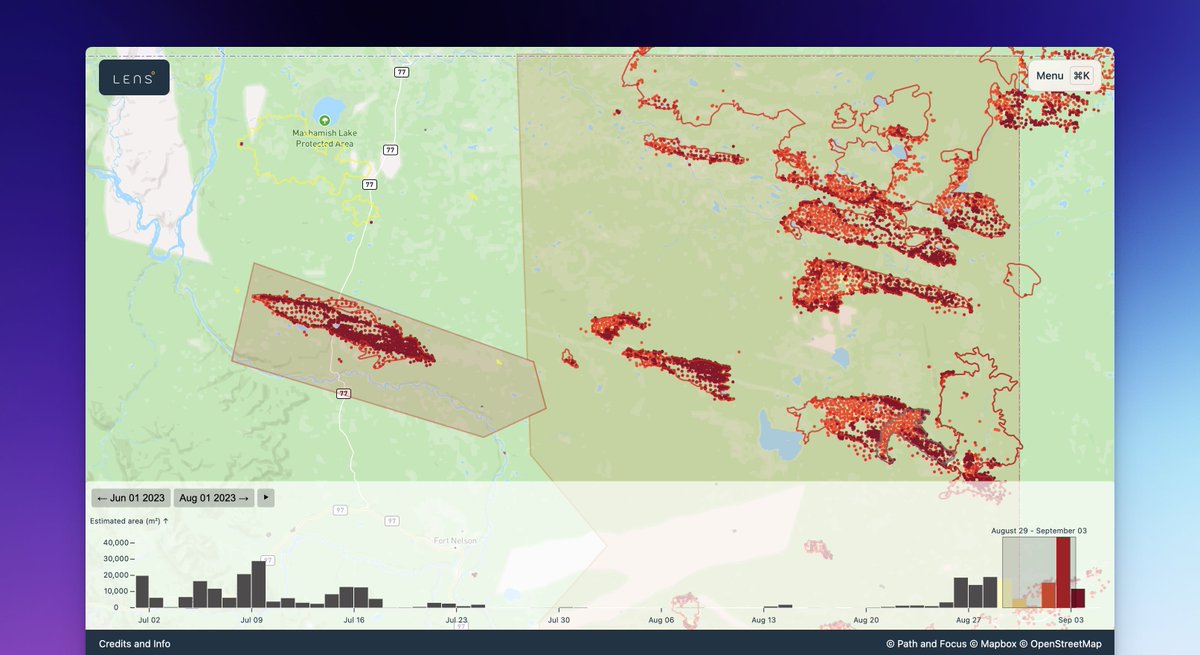
🔥 Next up, the record-breaking Donnie Creek wildfire in BC spanned 619,072 ha. But nearby fires surpassed its size, showing the immense scale of wildfires in the region. A complex fire situation challenging our perception.
More info: https://t.co/NDTEEcuKXs
#BCWildfire
🔥 The North Slave Fire near Yellowknife, discovered on June 28, prompted a historic evacuation. Around 20,000 residents fled, marking it as one of Canada's largest wildfire evacuations.
Read more in our series: https://t.co/DfLNlUlM0E
#wildfire
🔥 We're doing a series of posts looking at the 2023 Canadian #wildfire season. Starting w/ Nova Scotia: 2 major fires burned nearly 26,000 ha destroying 200 homes. This unexpected surge challenges our views on regional wildfire risks.
More: https://t.co/OlAEqPNusM
🔥 Next up, the record-breaking Donnie Creek wildfire in BC spanned 619,072 ha. But nearby fires surpassed its size, showing the immense scale of wildfires in the region. A complex fire situation challenging our perception.
More info: https://t.co/NDTEEcuKXs
#BCWildfire
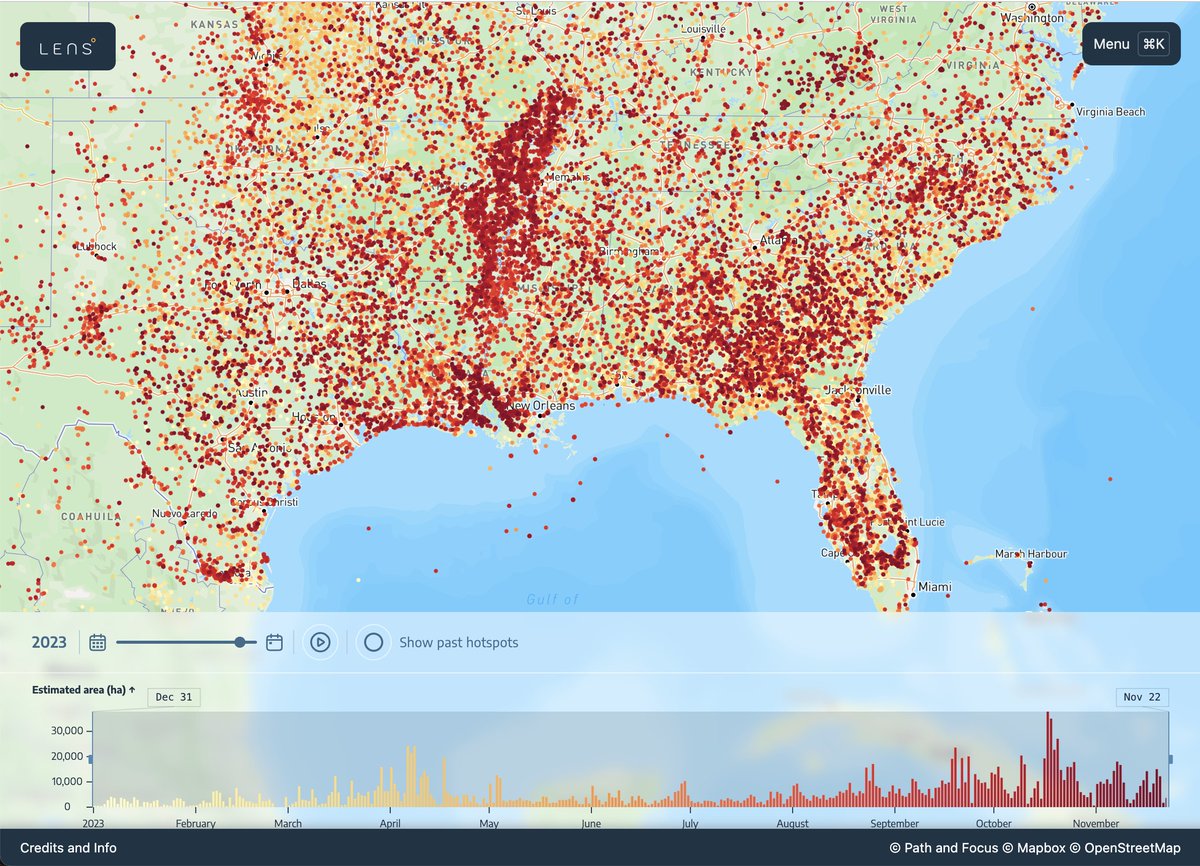
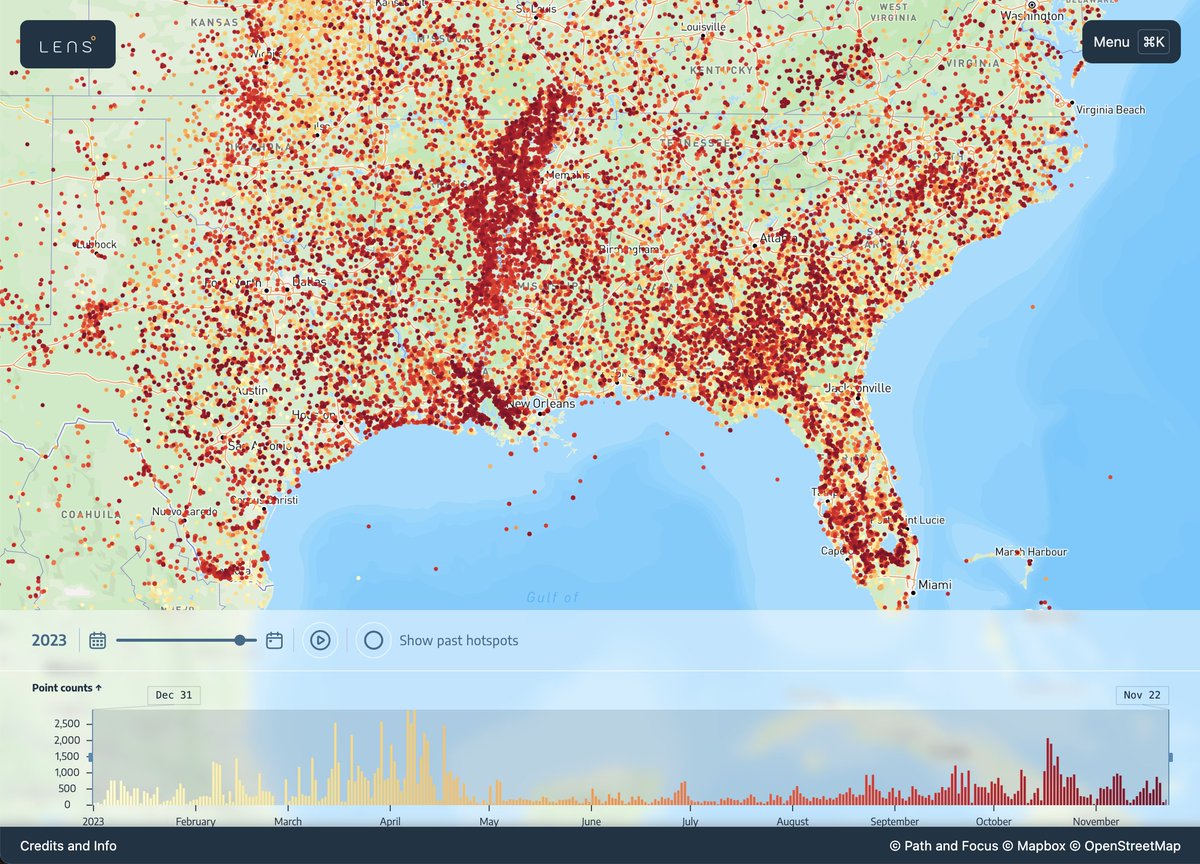
We're adding historic @CWFIS hotspot data to https://t.co/Alg6bj1ss5 and have noticed that the estimated size leans a particular way in certain regions at certain times of the year. E.g. in S.E. USA the est size is larger in later months. Anyone have ideas why?
🔥 We're doing a series of posts looking at the 2023 Canadian #wildfire season. Starting w/ Nova Scotia: 2 major fires burned nearly 26,000 ha destroying 200 homes. This unexpected surge challenges our views on regional wildfire risks.
More: https://t.co/OlAEqPNusM
We attended the @GoGeomatics conference. It was interesting to talk with Canadian geospatial data providers and hear from researchers applying data to understand climate change. Bonus, 3 remote team members go to spend some in-person time together.
#GoGeoExpo2023
Last minute we decided to attend @GoGeomatics Expo. Find @calebissharp and chat about how we used @protomaps PMTiles to cut tile serving fees by 95% (or maybe more) in https://t.co/pZYOqeCuWN #GoGeoExpo2023
Lens is a map of Canadian wildfire data created by @pathandfocus + @twostoryrobot
Explore wildfires interactively by date and area - built with a static set of pmtiles archives
https://t.co/MK53LIcJfA
@pwramsey might find it interesting!
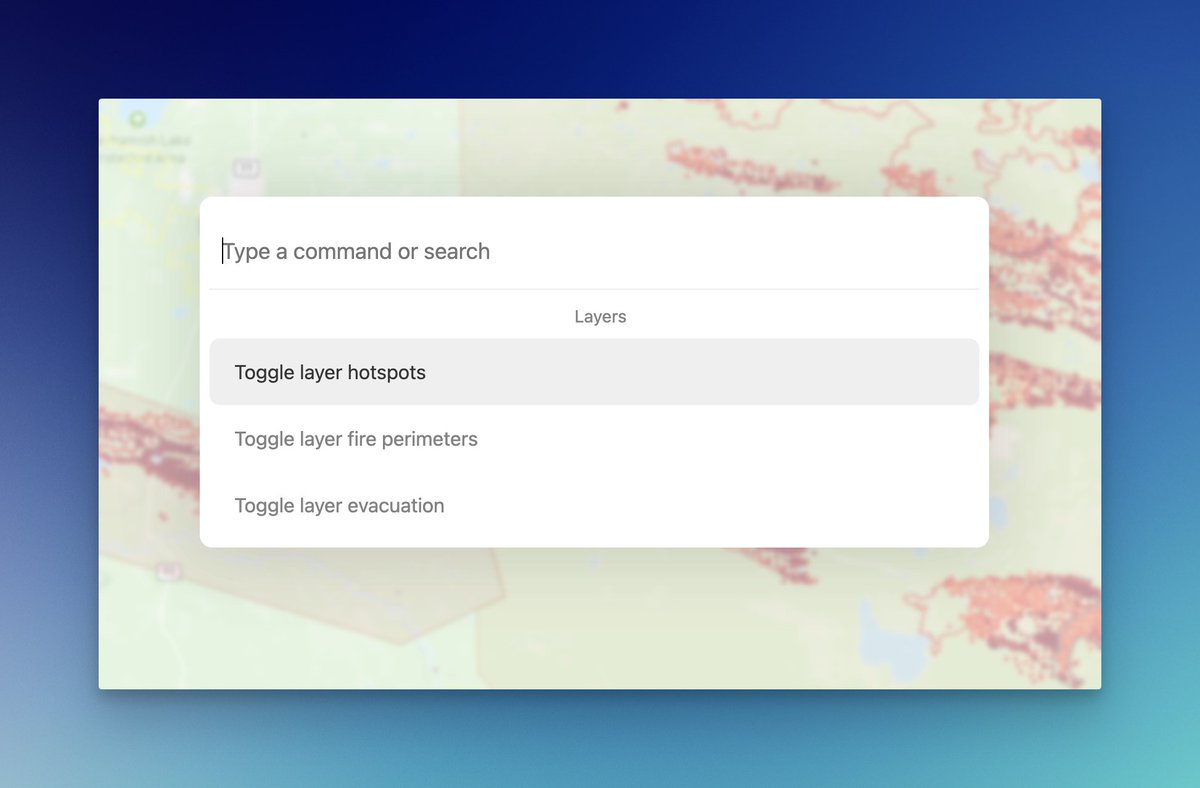
Updates to Lens: fire perimeters for #BCwildfire, a command palette for quickly toggling layers, and performance improvements.
We believe speed is a feature and we're regularly looking for ways to make things faster and more usable.
Try for yourself at https://t.co/pZYOqeCuWN
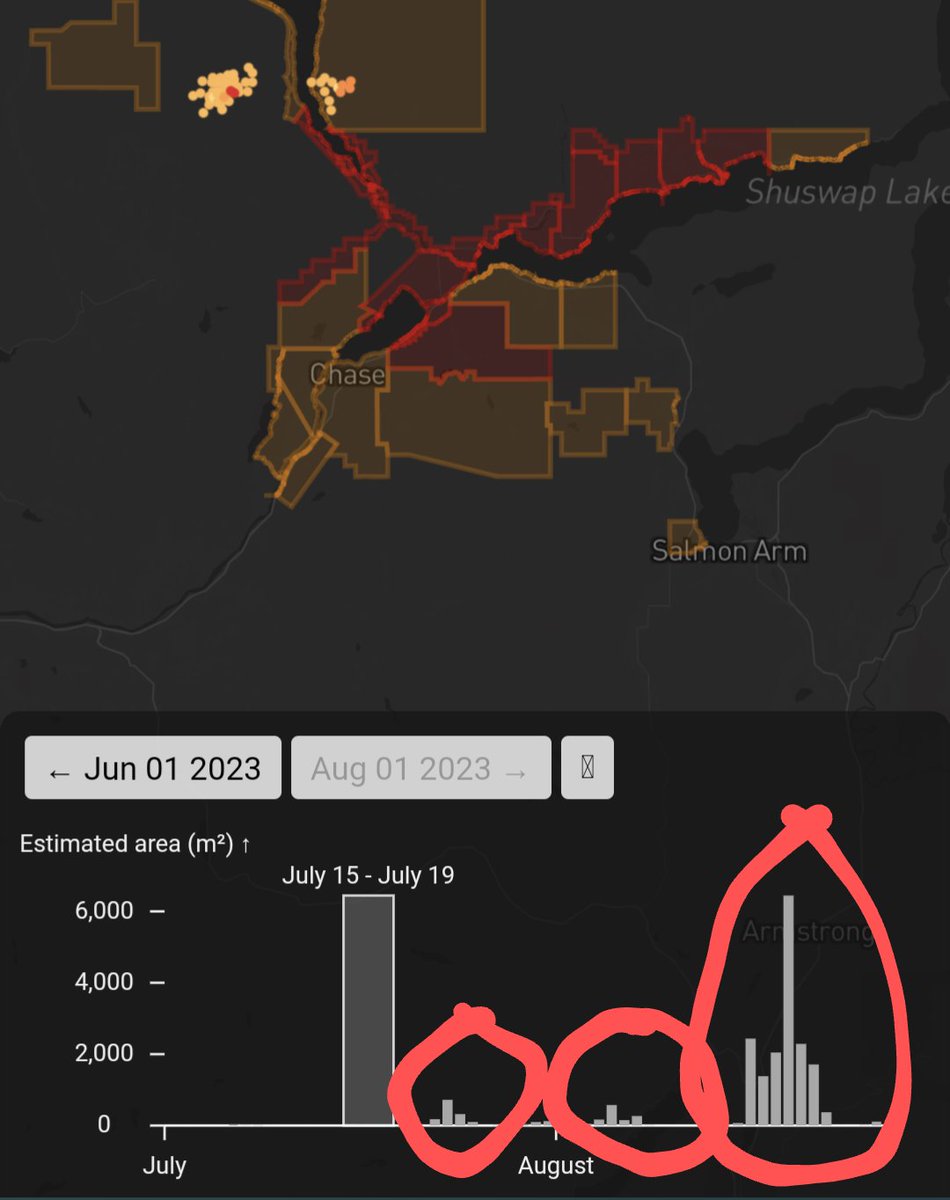
I often describe fire growth as a series of "sprints". It's not a steady jog, but rather large amounts of growth occurring in short timeframes.
@twostoryrobot's hot spot tool provides a great visual representation of this with the count of spots per day.
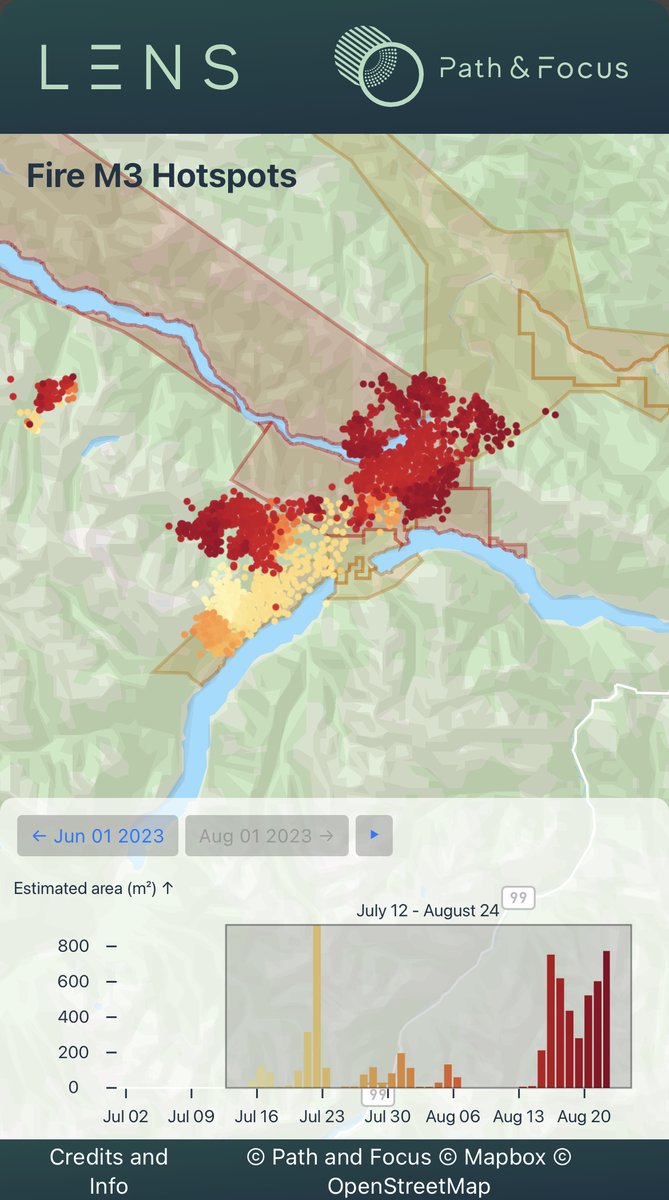
Lens now works better on mobile. You can properly scrub through the timeline with touch and expand the visible window fairly easily.
E.g. here is all hotspots for the Casper Creek #wildfire just outside Seaton Portage.
You can explore for yourself at https://t.co/pZYOqeBX7f
We just launched fire hotspot timelines in Lens. You can now view the entire 2023 hotspot history for all of Canada. You can even interactively explore the timeline and replay any point in time. E.g. here's the timeline for the Bush Creek East #wildfire.
https://t.co/pZYOqeCuWN