Unser neuer Atlas thematisiert die Lebensbedingungen in Städten, Landkreisen und Regionen vor dem Hintergrund der #COVID19-Pandemie. Mehr erfahren:
➡️https://t.co/jSqGXiRkJu
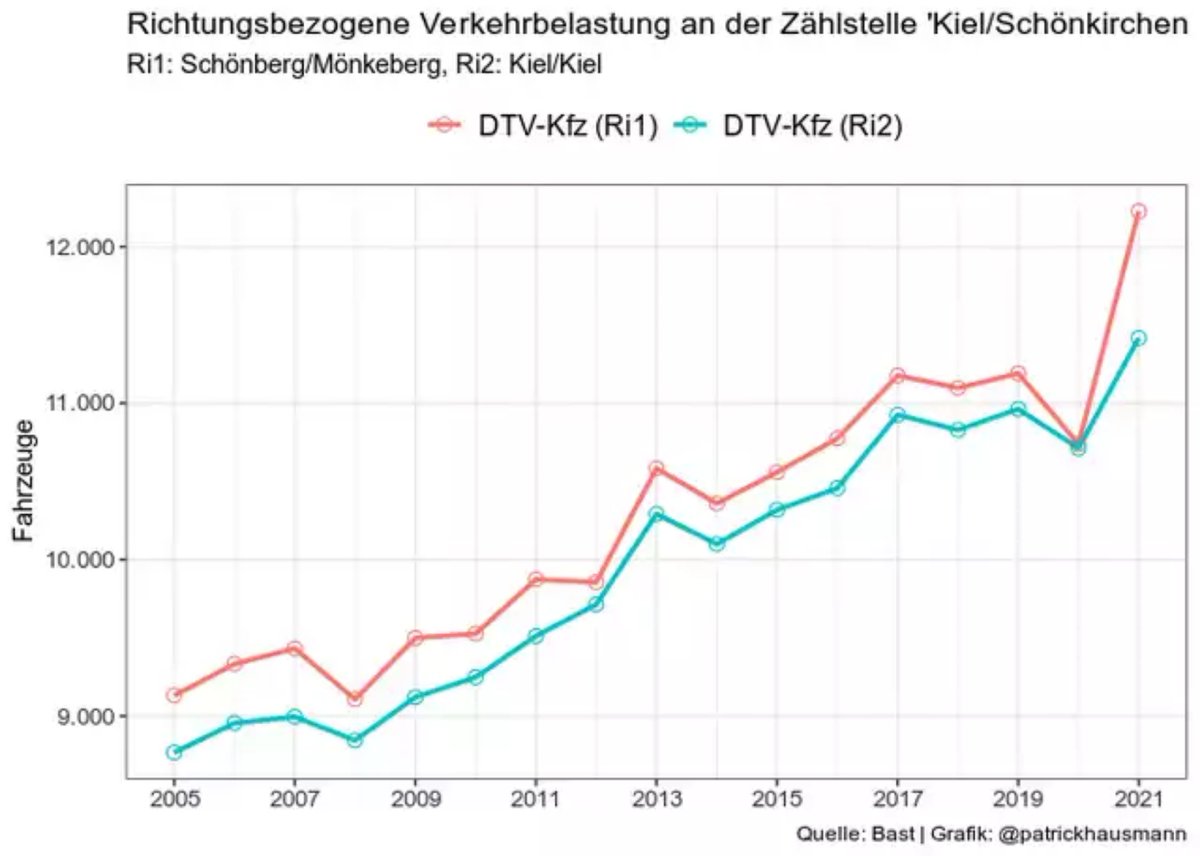
@smartsurfer99 @dregelies @KielDolphin@stadt_kiel Auf Stadtteilebene liegen die Daten nur als PDF im Statistischen Jahrbuch vor. Aufbereitet liegen sie hier https://t.co/Wv1DXhyOvD
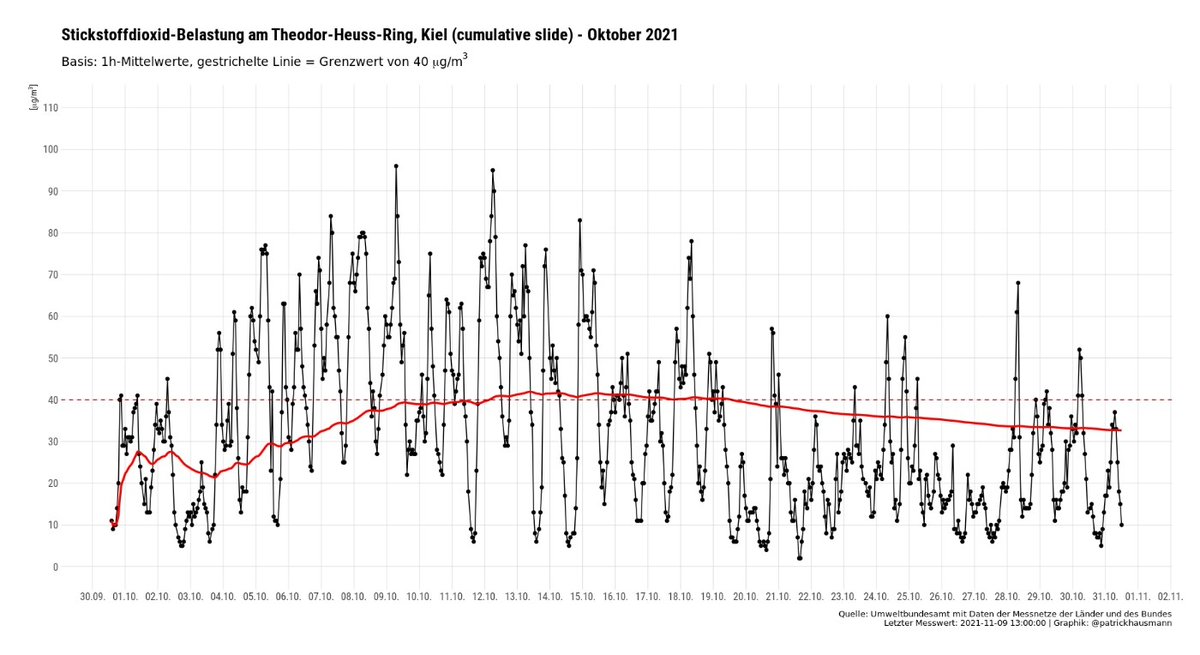
@nelling83 @dregelies @NiklasWieczorek Das Jahr 2021 ist nur bedingt aussagekräftig, da nur 97 Tage in die Auswertung gingen. In den Vorjahren waren es rund 250. #Kiel
One of my main motivators for contributing to DuckDB early on was the impact that open-source software can make on society.
I love learning how we facilitate or influence areas we couldn't foresee when thinking of "just building" a DBMS.
New blog post! What's an interpolation? Why is it important for your choropleth maps? And what are the different kinds of interpolations (linear, natural, quantiles, deciles, etc.) good for? Our writer @lisacmuth explains it all in simple terms: https://t.co/Su6q5qvMle
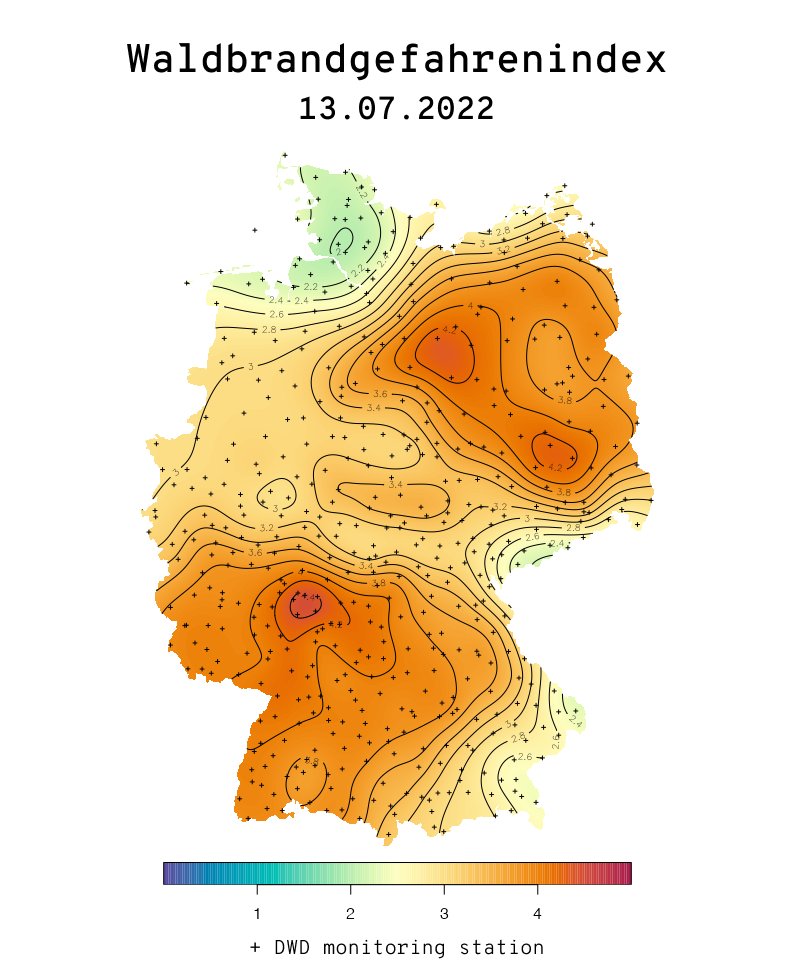
☑️ 1/3 done - turning the "Waldbrandgefahrenindex" (index of a forest being in danger of fire) by the @DWD_klima into an interactive app.
The following repository contains daily updates in spatial and tabular format:
https://t.co/QOz2grkp7n
#rstats#rspatial#climate
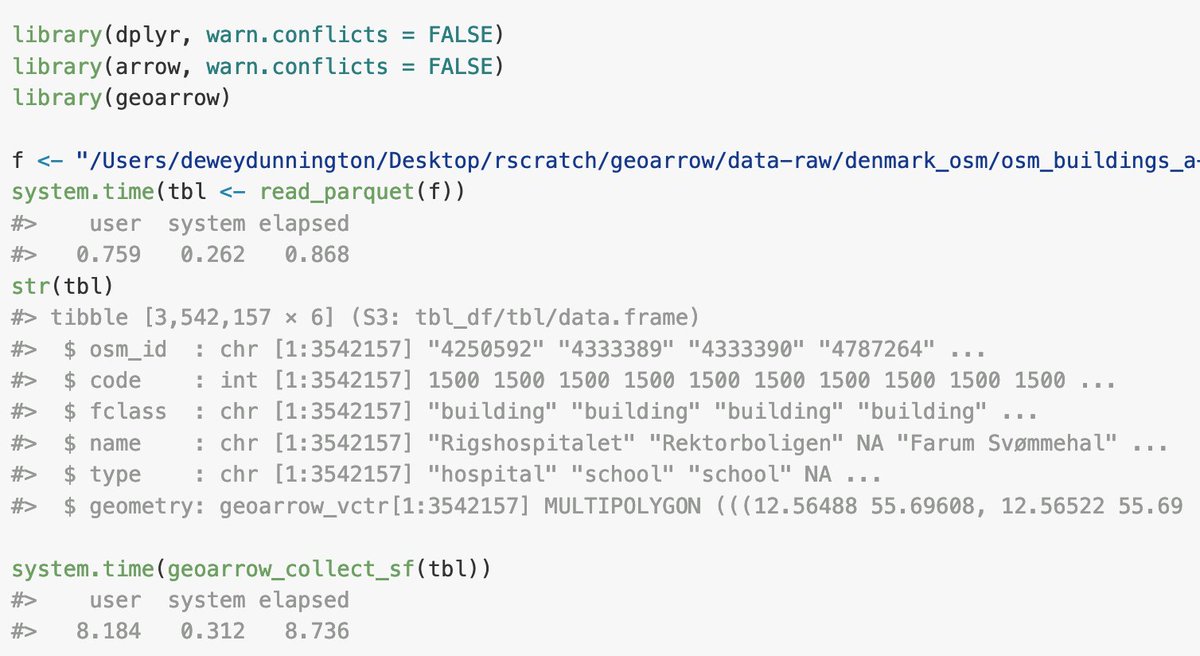
I'm excited to write in detail about this in the coming weeks, but the teaser version is that #rstats geoarrow 🌏⏩ will (1) make the arrow 📦 "just work" with spatial data and (2) make working with big files faster/multi-file datasets possible!
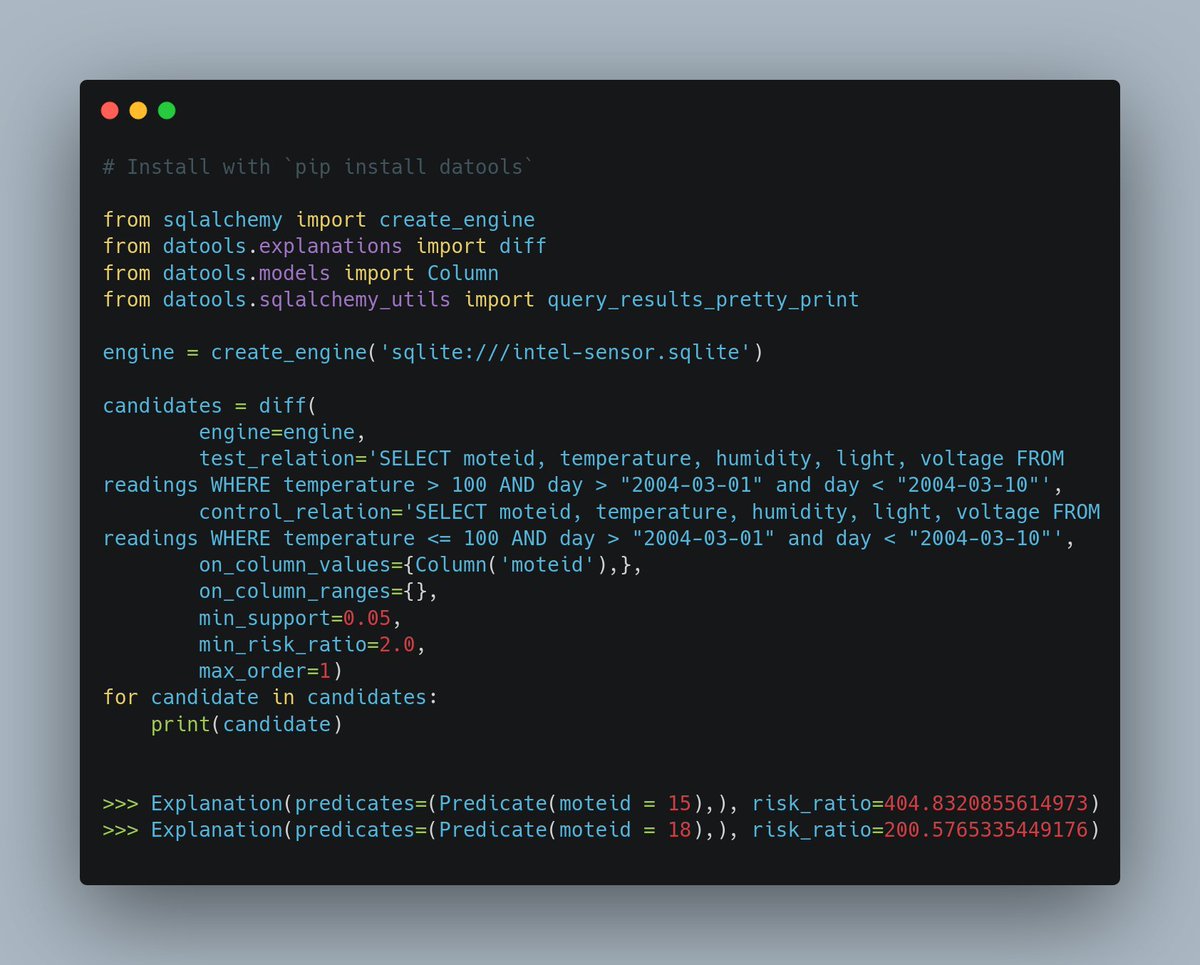
For the past few months, I’ve been implementing a data differ (a tool that takes two SQL queries and explains what makes their results different), and I finally wrote a blog post about it here: https://t.co/5vAyArQrq8
An excellent introduction to @ApacheArrow in R: https://t.co/lrEHBsC76L
Written by one of my favorite technical article writers @djnavarro, who manages to keep even longer pieces entertaining
#rstats
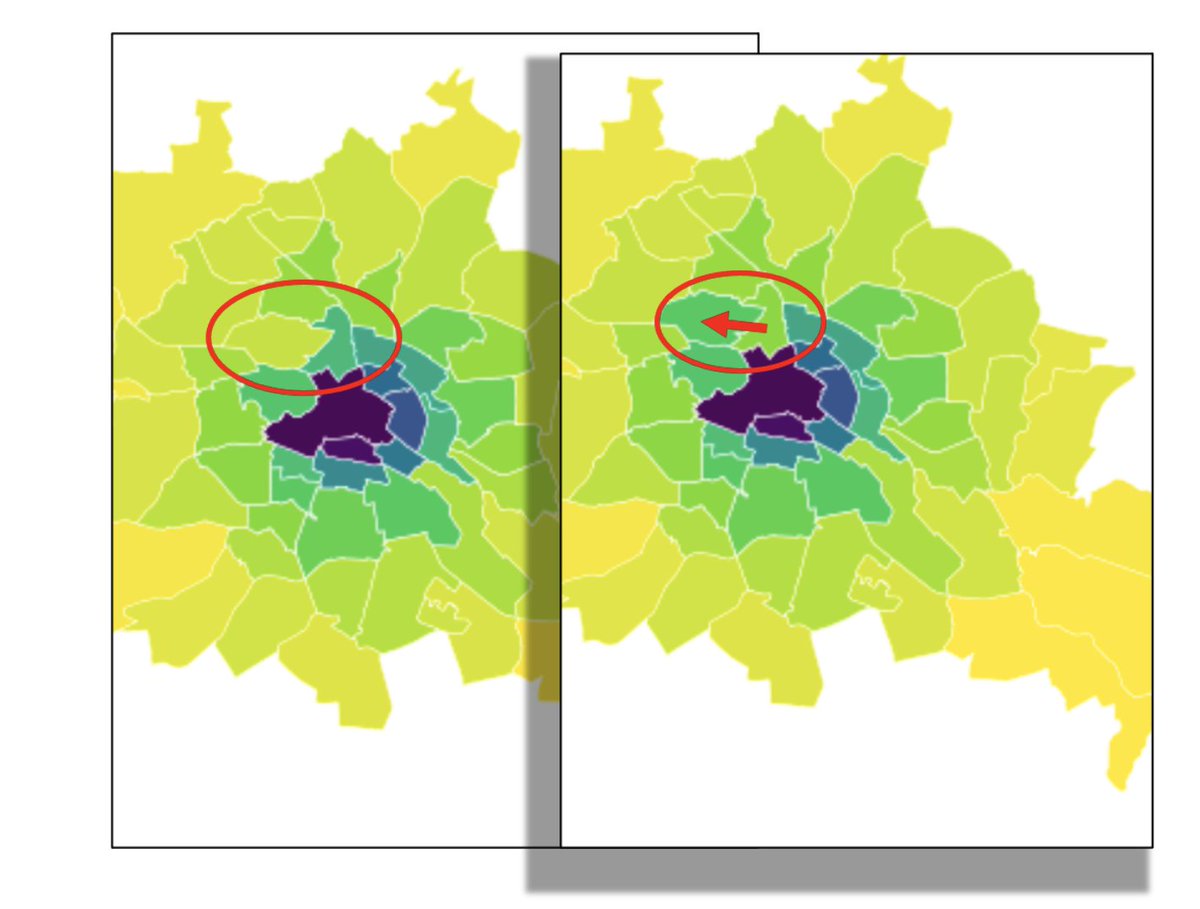
The change in the left image is obviously smaller than in the right. But how can this be measured?
In my first blog post, I explain how to quantify similarities between maps with the earth movers distance how this is implemented in #python and #rstats
https://t.co/JF02tz0Dac
🌐 How many decimal digits do you need for longitude and latitude? Not as many as you think. Visualized on this @observablehq notebook: https://t.co/6AwWMGck5G