This is all you need to time the stock market. Save this. Screenshot it. You will need it.
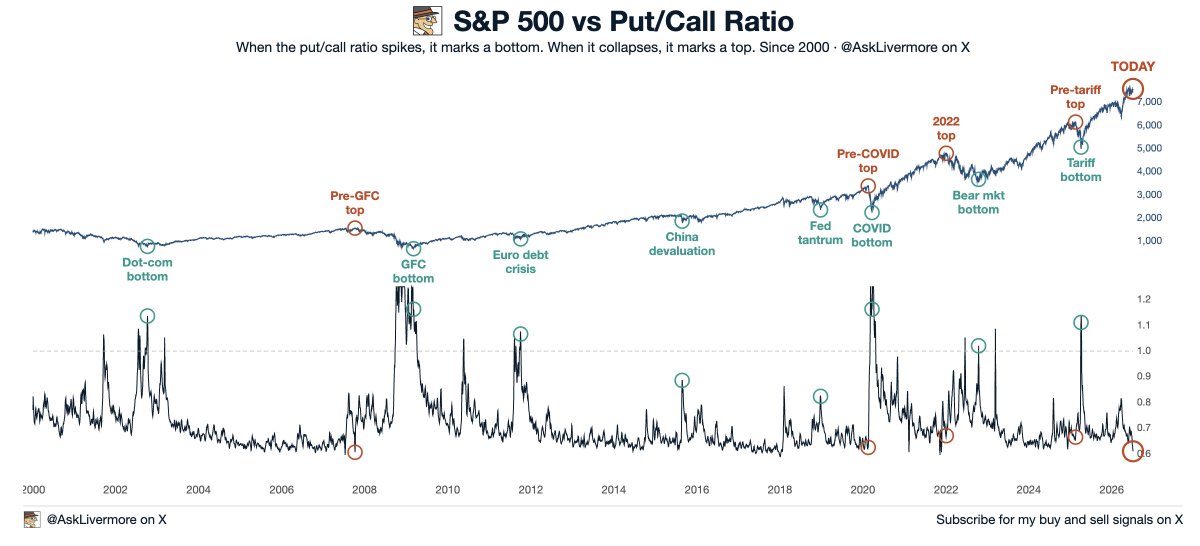
The put/call ratio tells you when everyone is panicking and when everyone is too comfortable.
Every single time the put/call ratio spiked above 1.0 since 2000, it marked a generational buying opportunity:
- Dot-com bottom (2002)
- GFC bottom (2009)
- COVID bottom (2020)
- Tariff crash (2025)
Every single time it collapsed below 0.70, a pullback followed:
- Pre-GFC top (2007)
- Pre-COVID top (2020)
- 2022 top
- Pre-tariff top (2025)
Right now? The put/call ratio just hit 0.61, the lowest since December 2020. That means options traders are the most bullish they've been in nearly 6 years.
Does that mean sell everything? No.
But it means this is the time to stay balanced, not all-in into one sector. The best buying opportunities will come soon, stay patient.
When everyone is greedy, be cautious.
When everyone is fearful, be aggressive.
The S&P put/call skew just collapsed to 0.71. Not a low. The lowest reading on record.
The 10-year average is 12. The 2020 panic peaked at 34. We're at 0.71.
What this measures: how much investors pay to protect against a crash versus betting on a rally. At 0.71, crash protection is essentially free. Nobody wants it.
Think about what that means. After two years of gains, at record concentration, with households at record equity exposure, the options market has priced hedging like insurance on a house that cannot burn.
History's lesson is consistent: markets don't crash when everyone fears a crash. Fear is the hedge. This chart says the hedge is gone.
Nobody buys insurance at the top.
That's what makes it the top?
🚨Oracle's risk of DEFAULT has never been higher:
Oracle's 5-year credit default swaps (CDS) surged to 198.18 basis points on Friday, the highest closing level EVER, officially surpassing the 2008 Financial Crisis peak.
The cost of insuring against Oracle's default has QUADRUPLED since mid-2025.
This comes as Oracle has become the most popular instrument for investors to hedge or bet against AI-related debt, with ~$120 billion of bonds in the Bloomberg US high-grade corporate bond index, the largest non-bank issuer.
Oracle also has the most-liquid investment-grade CDS, with average weekly trades topping $830 million.
Investors' bets against AI have never been larger.
Die Wall Street hat eine Formel entwickelt, die vorhersagt, wann Trump einknickt.
Sie heißt TACO. Trump Always Chickens Out. Trump knickt immer ein.
Die Formel hat Tradern im letzten Jahr Milliarden eingebracht. Man kauft, wenn Trump eskaliert. Man wartet. Man verkauft, wenn er zurückrudert. Denn er rudert immer zurück.
Jetzt hat die Investmentbank BCA Research diese Formel in einen Index gegossen. Den “Trump Pain Point Index”. Er misst den wirtschaftlichen und politischen Druck auf den Präsidenten in einer einzigen Zahl.
Die Bestandteile: Inverse Aktienmarktrenditen des S&P 500, Renditen auf 10-jährige US-Staatsanleihen, 30-jährige Hypothekenzinsen, Benzin-Futures, einjährige Inflationserwartungen und Trumps Zustimmungswerte.
Sechs Variablen. Eine Zahl. Ein Schmerzindex.
Und dieser Index hat gerade zum ersten Mal in seiner Geschichte die Marke von zwei Standardabweichungen über dem Durchschnitt erreicht. Ein statistisches Extremereignis.
Die historische Trefferquote ist dabei perfekt.
April 2025: Der Index schießt hoch nach den “Liberation Day” Zöllen. Trumps Reaktion: 90-Tage-Pause auf fast alle Zölle.
September 2025: Neuer Spike während des Government Shutdowns. Trumps Reaktion: Er beendet den Shutdown.
November 2025: Der Index steigt nach erneuten Angriffen auf die Fed. Trumps Reaktion: Rückzug.
Dezember 2025: Spike nach der Grönland-Drohung. Trumps Reaktion: Er lässt Grönland fallen.
März 2026: Der Index erreicht sein Allzeithoch. Trumps Reaktion: Er zieht seine Drohung zurück, iranische Kraftwerke zu bombardieren. Die 48-Stunden-Frist, die er am Samstag gesetzt hatte, wird am Montag auf fünf Tage verlängert. Er spricht plötzlich von “produktiven Gesprächen”.
Sechs Spikes. Sechs Rückzieher. Kein einziges Mal hat Trump den Schmerz durchgehalten.
Und genau hier wird es gefährlich.
Denn jemand hat am Montag gewusst, was kommt. Zwischen 6:49 und 6:50 Uhr morgens New Yorker Zeit wurden Öl-Futures im Wert von 580 Millionen Dollar gehandelt. In einer einzigen Minute. An den fünf Vortagen lag das durchschnittliche Volumen zur selben Uhrzeit bei 700 Kontrakten. An diesem Morgen waren es 6.200.
Fünfzehn Minuten später postete Trump auf Truth Social, dass er die Bombardierung pausiere.
Der Ölpreis fiel sofort um 15 Prozent. Der Dow sprang über 1.000 Punkte nach oben. 1,7 Billionen Dollar Marktkapitalisierung wurden in Minuten geschaffen.
Nobelpreisträger Paul Krugman schrieb dazu einen einzigen Satz: “Wir haben ein anderes Wort für Situationen, in denen Personen mit Zugang zu vertraulichen Informationen über die nationale Sicherheit diese für Profit ausnutzen. Das Wort ist Landesverrat.”
Die Financial Times schätzt, dass parallel zu den Öl-Futures auch S&P 500 Futures im Wert von 1,5 Milliarden Dollar in demselben Zeitfenster gehandelt wurden. Auf der Wettplattform Polymarket platzierten acht Nutzer zeitgleich verdächtige Wetten auf einen Waffenstillstand.
Und Irans Parlamentssprecher Ghalibaf? Er nannte Trumps Behauptung über produktive Gespräche ein Zitat: “Fake News zur Manipulation der Finanzmärkte.”
Das ist der Punkt, an dem die TACO-Formel ein Problem bekommt.
Zölle sind ein Schalter. Trump dreht ihn an, die Märkte fallen, er dreht ihn wieder aus, die Märkte steigen. Dieselbe Logik funktionierte bei jedem Rückzieher der letzten 15 Monate.
Aber Krieg lässt sich nicht per Social Media Post beenden.
Bloomberg schreibt: “Das TACO-Regime an den US-Aktienmärkten, in dem jeder Rückgang eine Kaufgelegenheit war, könnte offiziell vorbei sein.”
Fortune bringt es auf den Punkt: TACO hat eine versteckte Annahme. Es funktioniert nur, wenn die Gegenseite genauso schnell runterfahren will wie Trump. Iran will aber nicht. Teheran hat gestern Trumps 15-Punkte-Friedensplan abgelehnt und den Krieg fortgesetzt.
Die Zahlen zeigen, warum der Druck so hoch ist wie nie.
Trumps Zustimmung liegt bei 36 Prozent, dem tiefsten Wert seiner zweiten Amtszeit laut Reuters/Ipsos. Seine wirtschaftliche Zustimmung ist auf 29 Prozent gefallen. Das ist niedriger als jeder Wert, den Joe Biden jemals hatte. Nur 27 Prozent der Amerikaner sind mit Trumps Umgang mit den Benzinpreisen zufrieden. Der US-Durchschnittspreis pro Gallone liegt bei 3,98 Dollar. Vor einem Monat waren es 2,93 Dollar.
BCA-Chefstratege Marko Papic warnt: Wenn der Konflikt nicht innerhalb von 7 bis 10 Tagen gelöst wird, droht ein globaler wirtschaftlicher Shutdown.
Morgan Stanleys Chefanlagestrategin Lisa Shalett schreibt in einer Kundennotiz von einem Szenario, das sie “chaotisches Abgleiten in Richtung Stagflation” nennt. Steigende Ölpreise würden die Nachfrage zerstören und das globale Wachstum bremsen, während die Inflation gleichzeitig steige.
Die Wall Street hat in den letzten 15 Monaten eine perfekte Formel gefunden, um Trumps Verhalten vorherzusagen. Sie hat damit Milliarden verdient.
Aber jetzt kennt auch die Gegenseite die Formel. Iran weiß, dass Trump bei zwei Standardabweichungen einknickt. Die ganze Welt weiß es. Und ein Präsident, dessen Schmerzgrenze öffentlich berechenbar ist, hat seine stärkste Verhandlungsposition bereits verloren.
In diesen Recherchen steckt eine Menge Arbeit. Wenn dich solche Makro Insights interessieren und dir helfen, interagiere gerne mit dem Post. 🧡
🚨The Iran War is putting the semiconductor industry on high alert:
The shutdown of Qatar's Ras Laffan facility, the world's largest LNG export plant, has knocked out ~33% of global helium supply, as helium is a byproduct of natural gas processing.
With the facility offline, the global market is losing ~5.2 million cubic meters per month, while there is almost no spare capacity as helium must reach end users within ~45 days before it evaporates.
As a result, Helium spot prices have risen over +100% since the Iran War began.
Notably, in 2025, Qatar produced 63 million cubic meters of helium, making it the 2nd-largest producer in the world after the US.
If the disruption lasts 60 to 90 days, prices could surge another +50%, potentially exceeding $2,000 per thousand cubic feet, according to AKAP Energy.
Helium is essential for semiconductor manufacturing, MRI machines, fiber optics, and space exploration, with no viable substitutes, meaning higher helium prices will directly raise the cost of making every chip in the world.
Chipmakers hold ~6 months of inventory, but Samsung and SK Hynix are already scrambling to find alternative sources, with 64% of South Korean helium imports coming from Qatar alone.
The Iran War is sending shockwaves well beyond the energy market.
Indeed it's time to ask the question why does US have more data centers than the whole rest of the world combined? China gets by with 555 and Apple just the other day said they're only a 10% and have a ton of excess capacity so what's up with this, just creating markets for chips and servers?
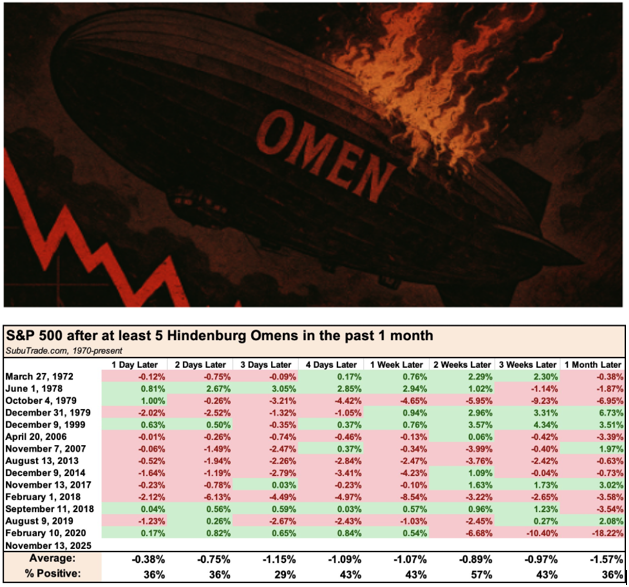
Stock Market Crash "Hindenburg Omen" Triggered 🚨
The Hindenburg Omen, an indicator that correctly detected the 1987 and 2008 stock market crashes, has been triggered for the 5th time over the last month 👻😱
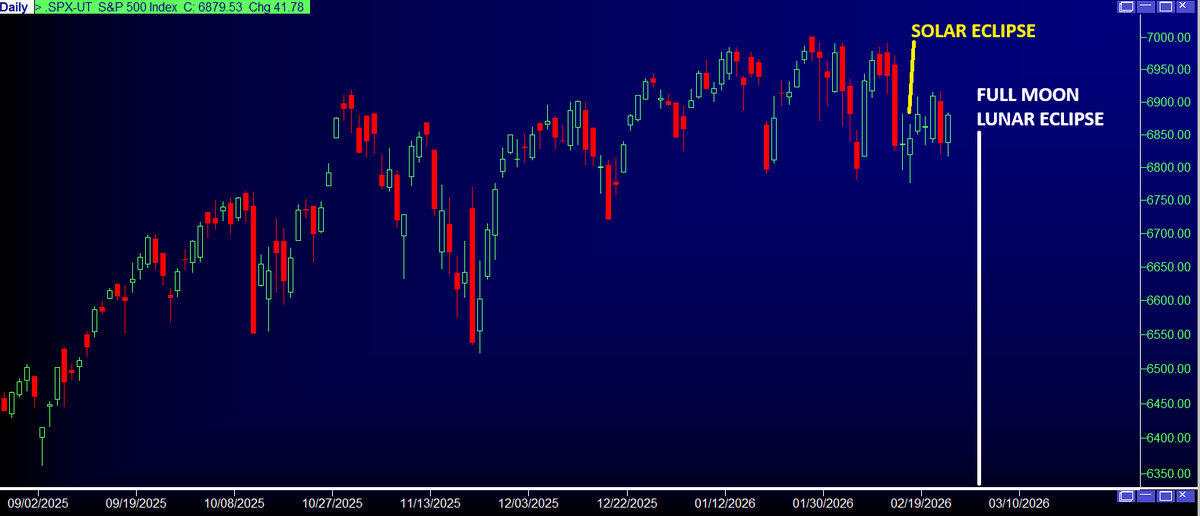
You Are Now Entering the Puetz Crash Window
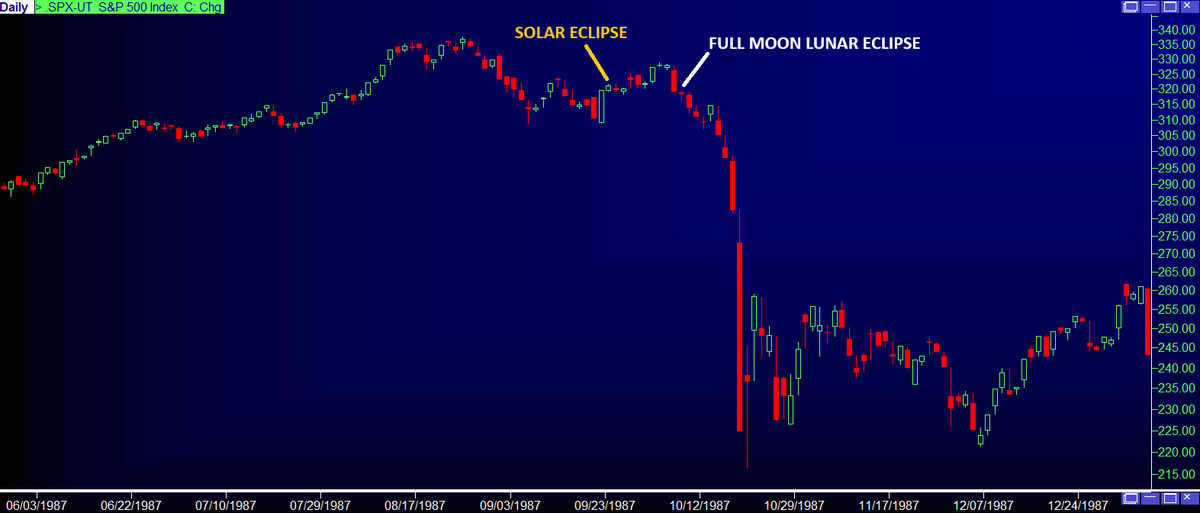
What are the odds that eight of the greatest market crashes in history would all occur within six days before to three days after a full moon that fell within six weeks of a solar eclipse?
According to Steve Puetz, the probability is so small that it stands out as a statistical anomaly, ultimately leading him to define what is now known as the "Puetz Crash Window".
Puetz’s theory suggests that crashes most often begin after the first full moon following a solar eclipse when that full moon is also a lunar eclipse. In this pattern, markets tend to peak a few days ahead of the eclipse full moon, then drift sideways to slightly lower as the date approaches. Once the full moon arrives, or just after, the panic phase begins, typically lasting two to four weeks.
This Puetz Crash Window aligns in 2026. We saw the solar eclipse on February 17, 2026, which will be followed by a full moon and total lunar eclipse on March 3, 2026.
Under Puetz’s framework, the idealized market peak would have occurred 2-4 days before the eclipse full moon, placing the expected high between February 27 and March 2, the final trading sessions before the lunar‑eclipse trigger date.
🔴US margin debt has NEVER been higher:
US margin debt as a $ of real disposable personal income exceeded 6.0% for the first time EVER, according to Real Investment Advice analysis.
This is more than 2 TIMES higher than at the 2000 Dot-Com Bubble peak.
Nominally, margin debt is at a record $1.2 trillion, surging for 8 months STRAIGHT.
In the past, such spikes usually ended with a market correction or a bear market.
Will history repeat itself?
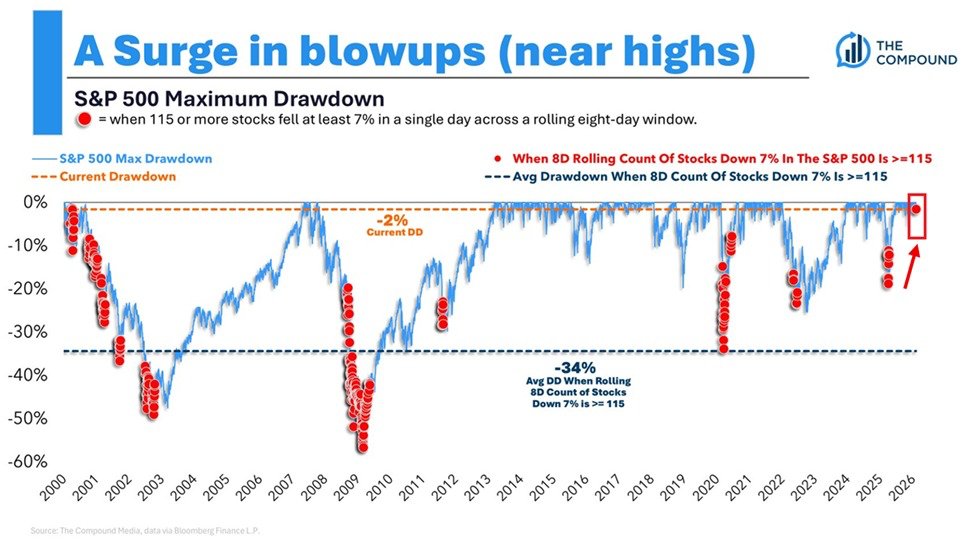
This is incredible:
At least 115 S&P 500 stocks have dropped -7% or more in a single day over the last 8 trading sessions.
And yet, the S&P 500 is down just -2% from its all-time high.
In the past, when at least 115 stocks saw a decline of -7% or more in an 8-day trading period, the average index drawdown was -34%.
The last time this many stocks were hit while the index was still near all-time highs was during the 2000 Dot-Com Bubble.
By comparison, in 2008, this threshold was triggered when the index was already in a bear market.
Markets are truly in unprecedented times.
⚠️THIS IS INSANE:
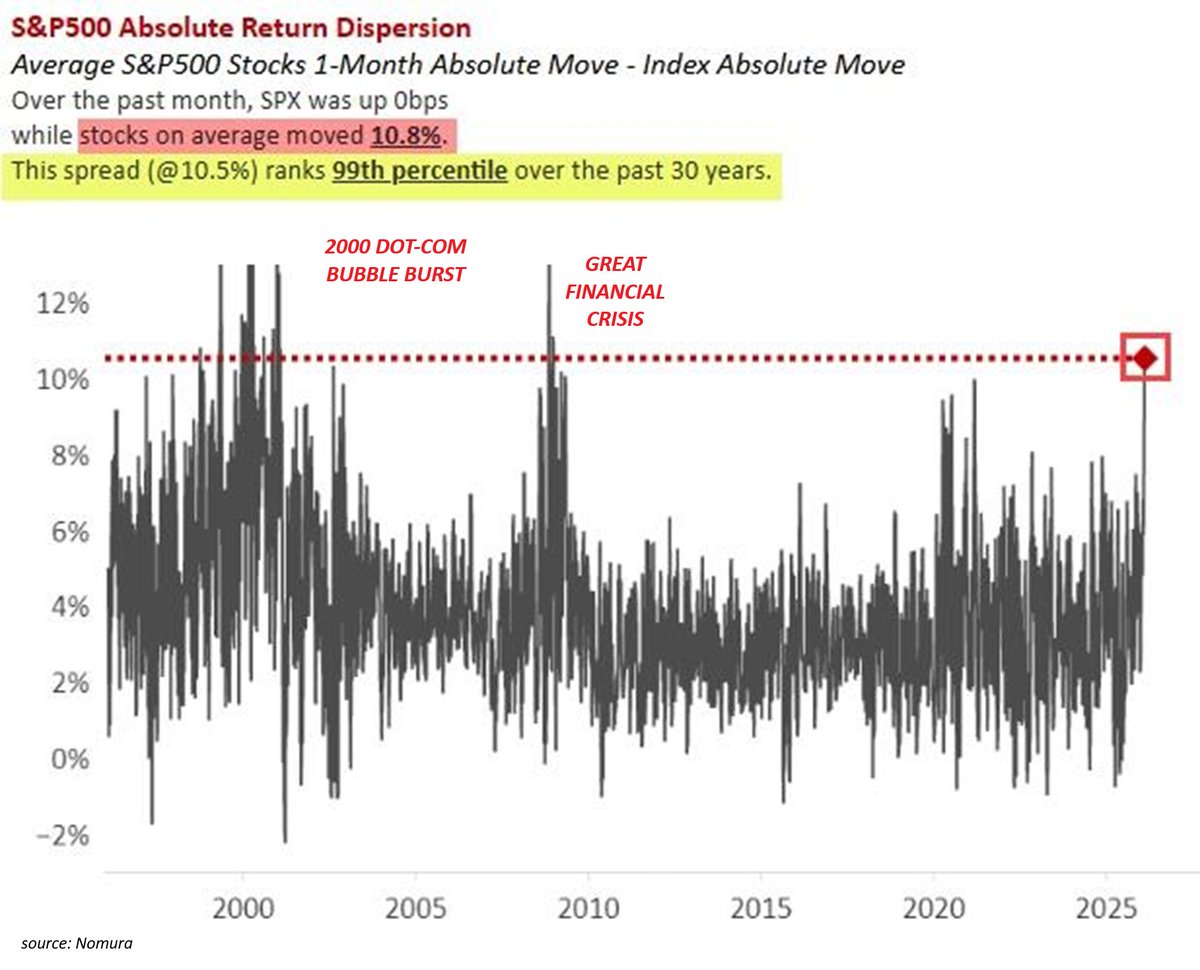
The volatility of an average stock in the S&P 500 index spiked to ~11% over the last month, the highest level since the Great Financial Crisis.
At the same time, the index has been flat.
In the past, such a divergence occurred only during periods of EXTREME market STRESS.
Higher single-stock volatility versus the S&P 500 has been observed only 1% of the time over the last 30 years.
The market is falling apart under the hood.
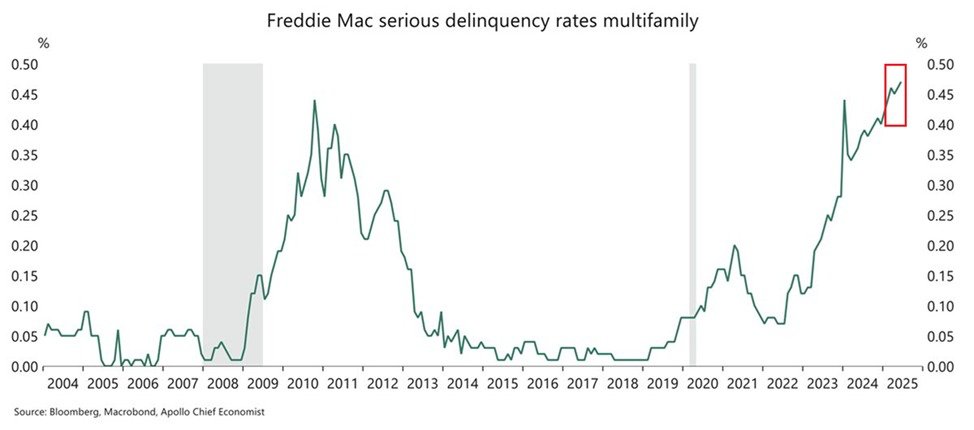
Multifamily mortgage delinquencies are surging:
Seriously delinquent rates in multifamily mortgages at Freddie Mac are up to 0.48%, the highest in at least 21 years.
The percentage has DOUBLED over the last 2 years.
At the same time, Fannie Mae multifamily serious delinquencies rates are up to 0.75%, the highest since 2021.
By comparison, the 2008 Financial Crisis peak was 0.80%.
Multifamily 90+ days delinquency rates at Freddie Mac and Fannie Mae averaged ~0.01%-0.10% between 2014 and 2019, well below current levels.
Multifamily mortgage pressures are building.
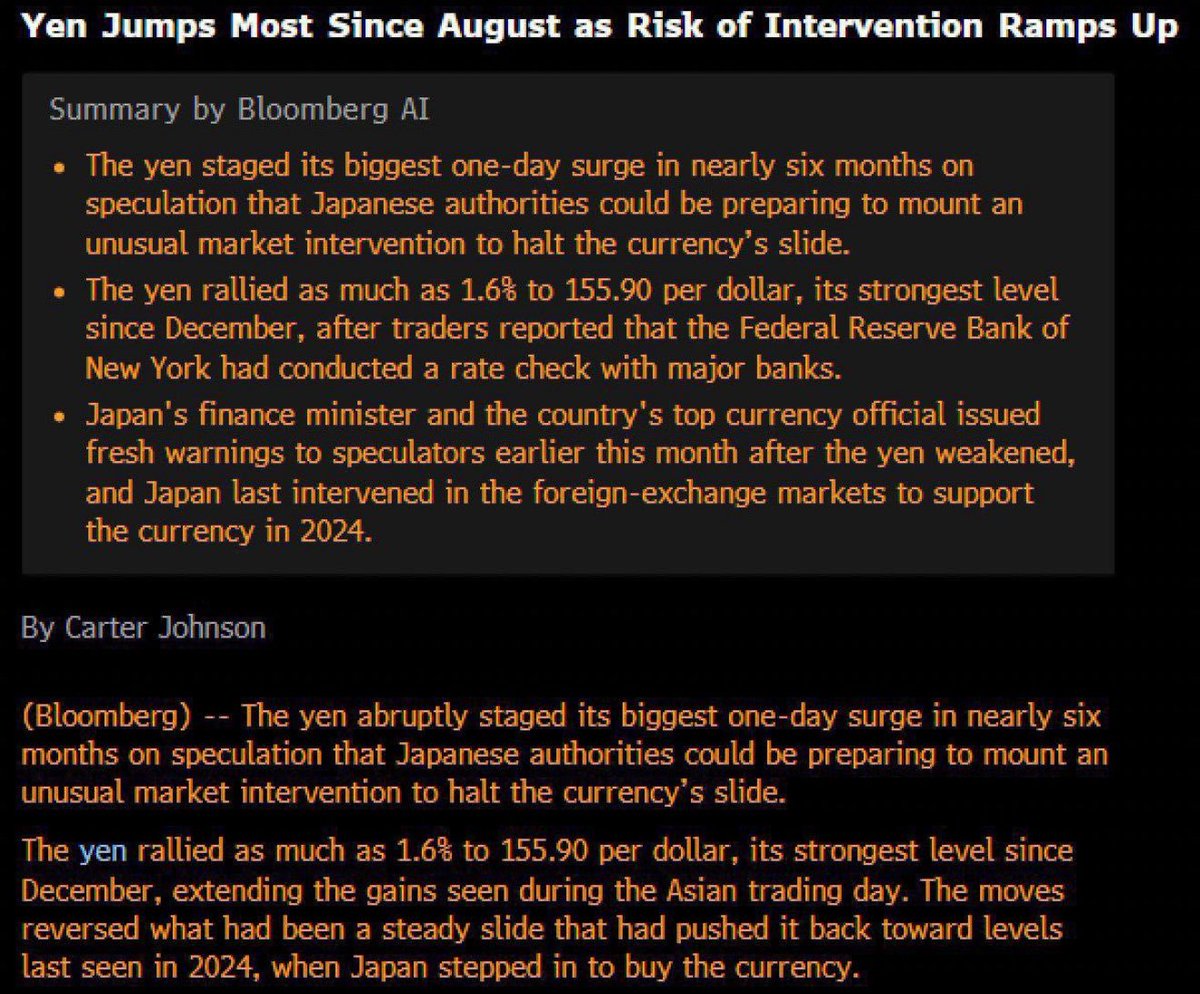
The Fed is intervening to save the Yen.
Why?
Because if the BoJ does it, that means they must sell Treasury holdings to raise dollars to do it.
I was wrong.
It’s not that Japan will panic.
It’s the Fed that will panic.
Few understand this.
"The International Monetary Fund is preparing for the possibility of a rapid sell-off of US dollar-denominated assets, its managing director, Kristalina Georgieva, said," per Euractiv.
🇺🇸 THE FED IS PREPARING TO SELL U.S. DOLLARS AND BUY JAPANESE YEN FOR THE FIRST TIME THIS CENTURY.
The New York Fed has already done rate checks, which is the exact step taken before real currency intervention. That means the U.S. is preparing to sell dollars and buy yen.
This is rare. And historically, when this happens, global markets surge.
Japan is under heavy pressure. The yen has been weak for years, Japanese bond yields are at multi decade highs, and the Bank of Japan is still hawkish. Together, this creates stress not just for Japan, but for global markets. That is why central banks are now taking the situation seriously.
Japan has already tried to defend its currency many times on its own. But it failed in 2022 and 2024. Even the July 2024 intervention only worked for short time.
History is very clear on this: When Japan acts alone, it does not work. When the U.S. and Japan act together, it does.
We saw this in 1998 during the Asian Financial Crisis. Japan’s solo interventions failed, but when the U.S. joined, the yen stabilized. We saw it even more clearly in 1985 with the Plaza Accord, when coordinated action pushed the dollar down nearly 50% over two years.
That changed everything: The dollar weakened. Gold, Commodities, Non US markets all pumped.
If the Fed intervenes, this is how it'll play out :
- The Fed creates dollars, sells them, and uses those dollars to buy yen.
- That weakens the dollar and increases global liquidity.
- And whenever the dollar is intentionally weakened, asset prices usually surge.
Now look at crypto.
Bitcoin has one of the strongest inverse relationships with the dollar and one of the strongest positive relationships with the yen. Right now, BTC yen correlation is near record highs.
But there is a catch.
There is still hundreds of billions of dollars tied into the yen carry trade. People borrow cheap yen and invest in stocks and crypto. When the yen strengthens suddenly, they are forced to sell those assets to repay loans.
We saw this in August 2024: A small BOJ rate hike sent the yen higher. Bitcoin crashed from $64K to $49K in six days. Crypto lost $600B in value.
- So yen strength creates short term risk for crypto.
- But dollar weakness creates long term upside.
Now, why is this bullish for crypto ?
Because Bitcoin is still well below its 2025 peak. It is one of the few major assets that has not fully repriced for currency debasement.
If coordinated intervention actually happens and the dollar weakens, capital will look for assets that are still cheap relative to the macro shift. Historically, crypto benefits strongly from that environment.
This may become one of the most important macro setups of 2026.