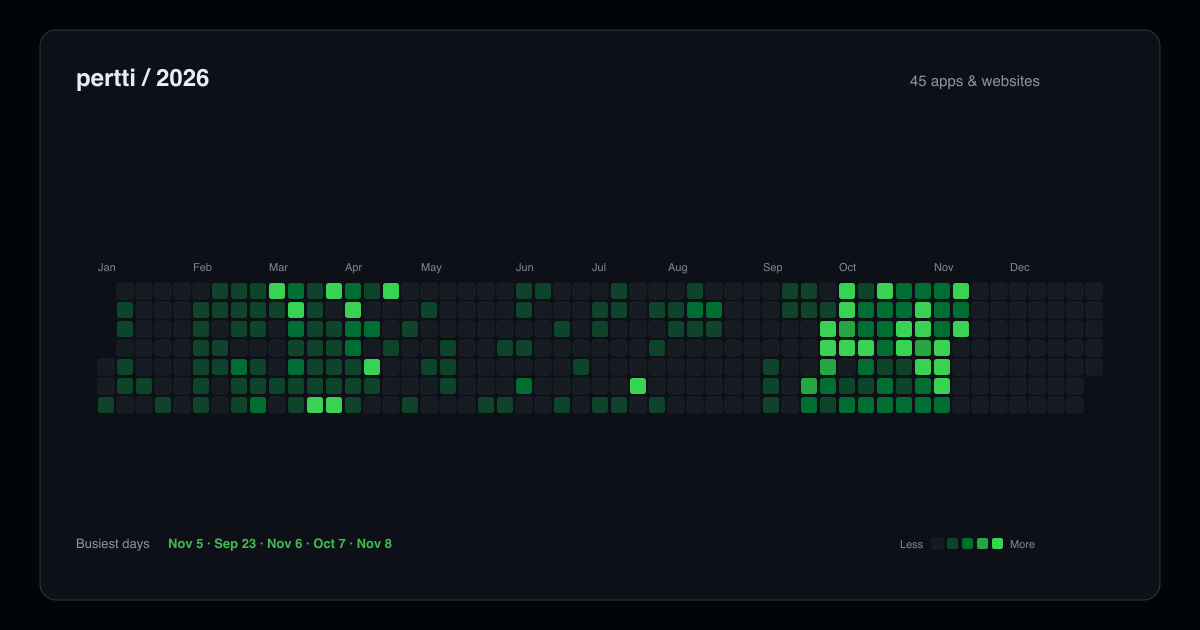
Counted my side-project folder for 2026:
45 apps & websites
37 web · 8 apps
~4/month — on top of a full-time dev job.
Most “prolific indie” posts are ~6–8 products/year with no day job.
Not sure if that’s skill or focus. Probably both.
#buildinpublic
@Pawzgm That’s the whole idea. Add a pack as a row with what it used to cost, tap every time you don’t buy one. The week adds it up, the total keeps going.
Counted my side-project folder for 2026:
45 apps & websites
37 web · 8 apps
~4/month — on top of a full-time dev job.
Most “prolific indie” posts are ~6–8 products/year with no day job.
Not sure if that’s skill or focus. Probably both.
#buildinpublic
Building my own mission control for all my projects, in public.
New: personas. It reads last week's DataFast visitors, AI groups them by what they actually did, and every visitor gets a label.
#buildinpublic
Agree, comparing changed vs untouched pages is the honest version. The hard part is knowing which pages changed. A deploy doesn't tell you that (CMS edits ship without one, and a shared component touches every page), and mapping code to routes is framework-specific.
So I'm making it page-first instead of deploy-first: read the sitemap's lastmod per URL, and since lastmod is often just the build time, also hash each page's main content daily. Changed hash = changed page, whether it came from a deploy, the CMS or a one-off edit. Then compare those pages to the untouched ones.
Building my own mission control for all my projects, in public.
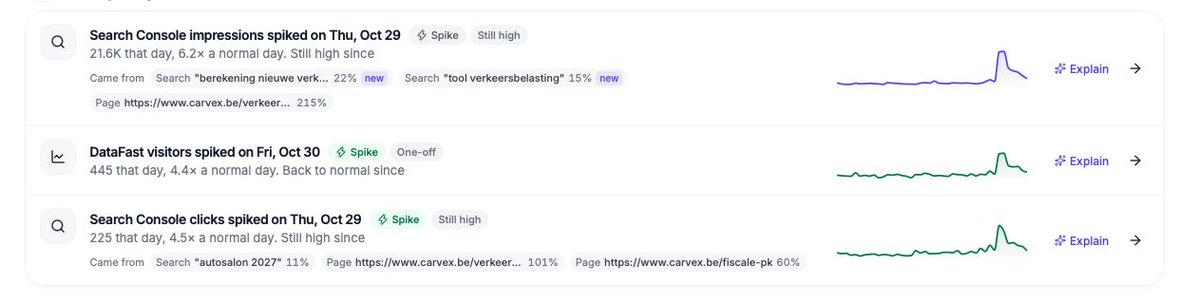
New Trends page. Once a day it flags what's unusual across all my projects: spikes, drops, records and weekly shifts. The AI writes a short overview, and Explain tells me what any change means.
Good call. Trends now shows where a spike came from: the exact search query, page or referrer behind it, and it flags when it's not real traffic
Next: GitHub and Vercel connectors, so deploys show up as markers on the timeline.
The tricky part: a deploy rarely lines up with a spike. Google takes days or weeks to recrawl and re-rank, and Search Console data arrives 2–3 days late. So deploys will show as context on the chart, not as "this caused it".
Building my own mission control for all my projects, in public.
Added a small AI box. It knows my projects and what each data source can show, but not my numbers. I ask "what should I track for Carvex?" and add its suggestions in one click.
Building my own mission control for all my projects, in public.
New: combine data sources in one widget. Search clicks, signups and revenue on one chart, or a formula like signups per 1k clicks. Every source stops at the same last full day.
Building my own mission control for all my projects, in public.
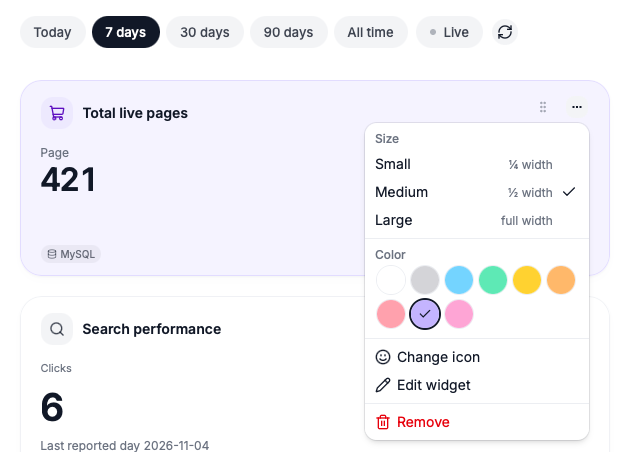
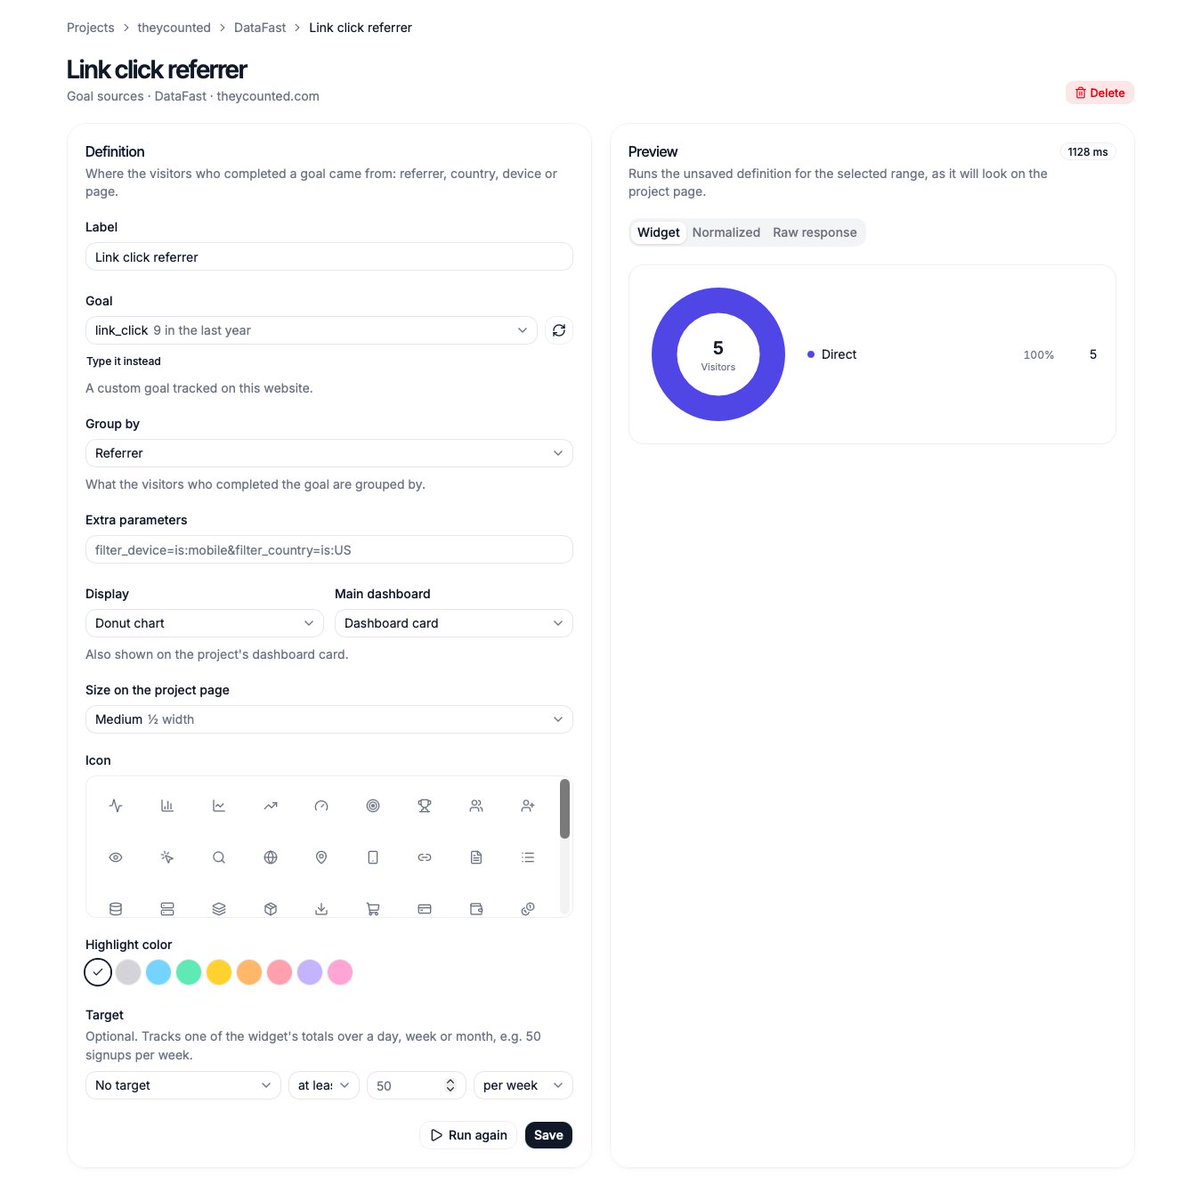
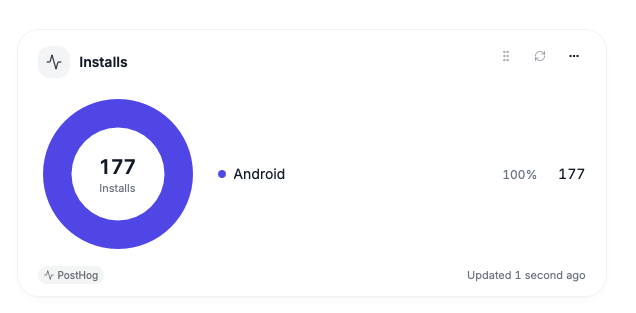
Today: a query builder for whatever data I've connected, like PostHog, MySQL or Search Console. Pick what to count, split it, see the result and save it as a widget.
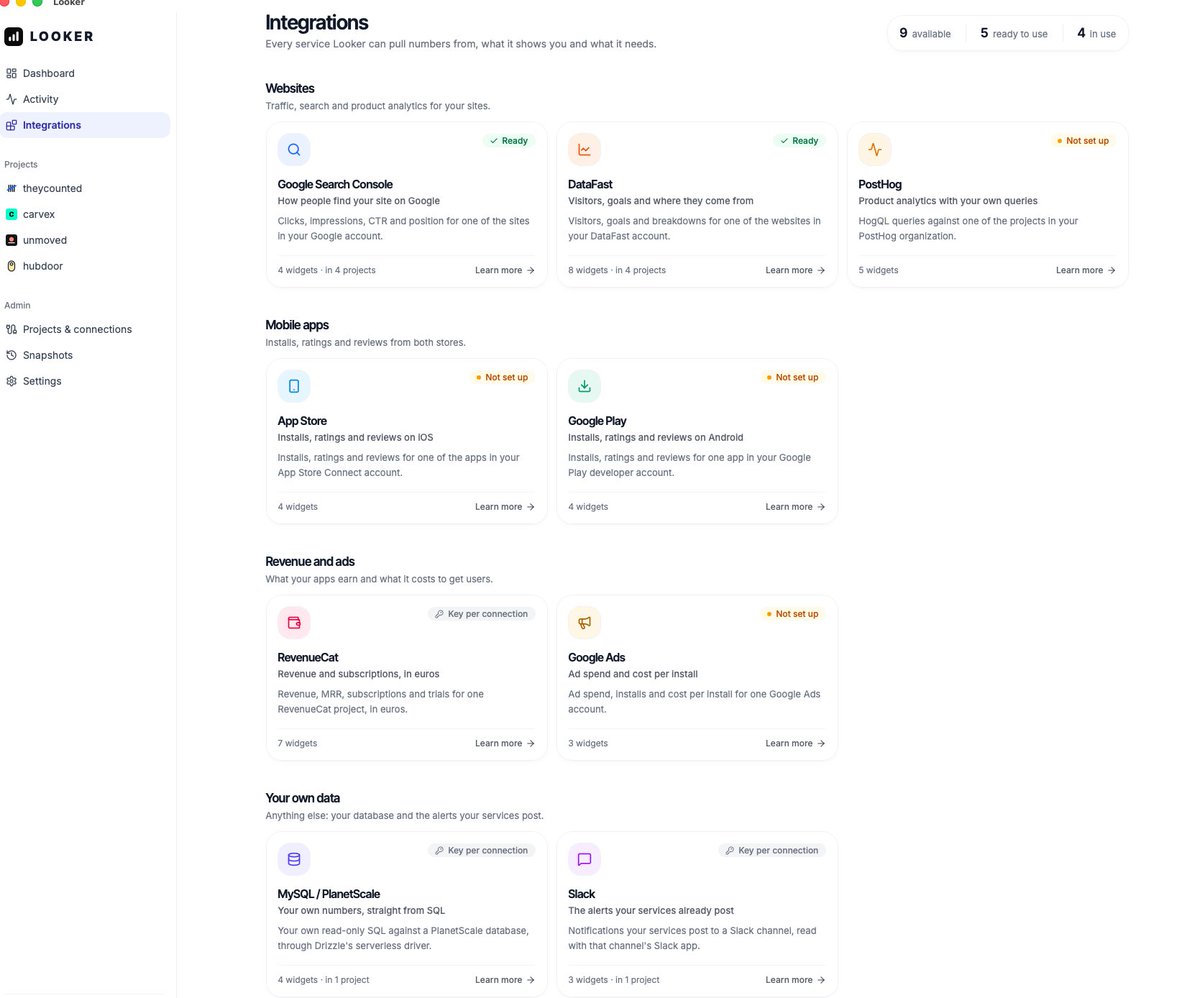
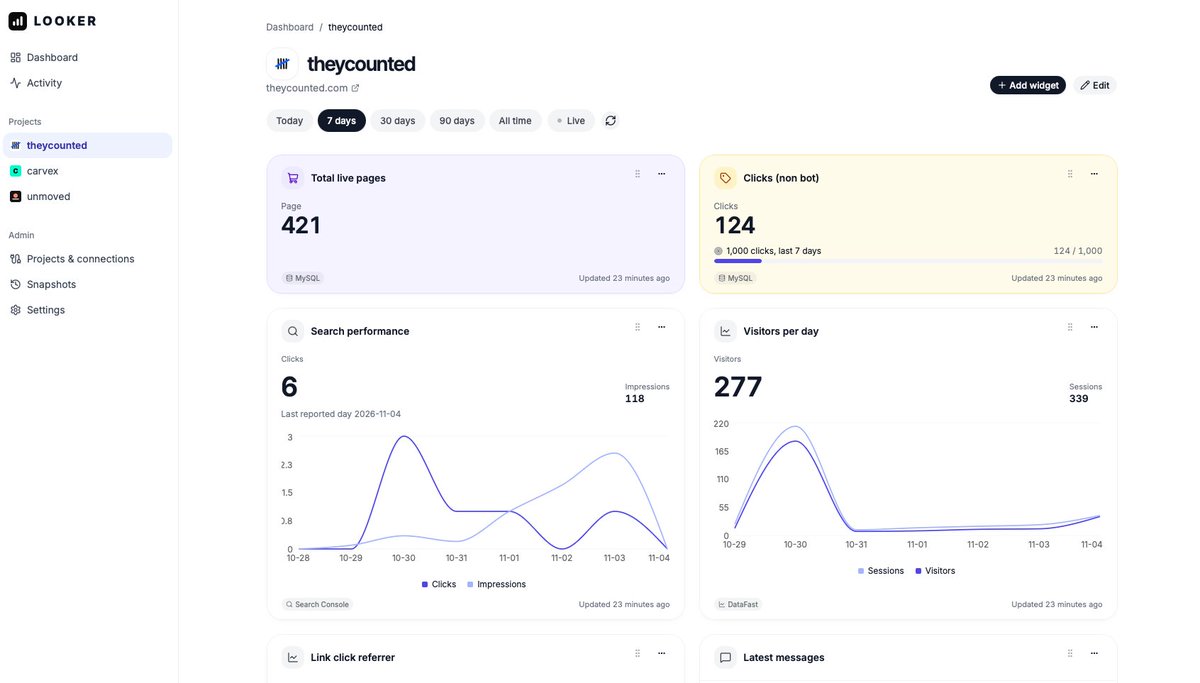
I was tired of jumping between DataFast, Search Console, Slack and my own database just to see how my websites & apps were doing.
Visitors here, clicks there, signups in a SQL query somewhere else.
So I built one app that puts it all on one screen.
Read further in the thread 🧵