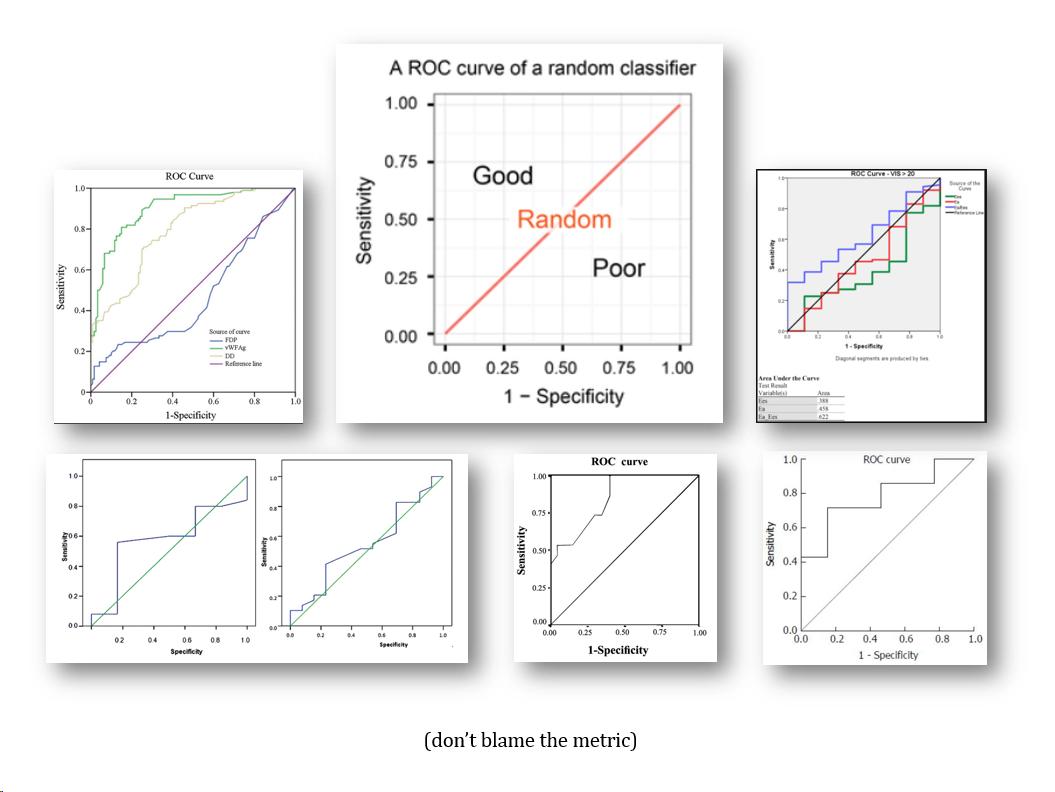
The area under the ROC curve (AUC) is so frequently criticized and misunderstood that I often wonder whether I am the metric’s only fan. Let me explain why how I see and value the AUC.
(thread)
A nice fact I like: Every matrix corresponds to a graph, and so familiar things (e.g. matrix multiplication) have nice pictures! Another nice fact: joint probability distributions *also* correspond to graphs. They have telling pictures, too. New blog post! https://t.co/EP67IhGAr0
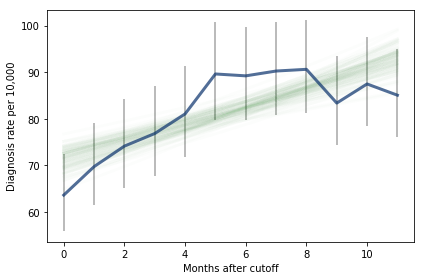
A recent paper in NEJM shows that children born in August are 30% more likely to be diagnosed with ADHD than children born in September, probably because they start school younger.
I reanalyzed the data using Bayesian logistic regression:
https://t.co/fok41Hdgpj
@rctatman Imagine predicting what I’m like based on a sibling. He is a model of me. If you don’t learn about him to predict me, you are excluding useful info (bias) But if you learn everything about him and apply it to me thats using too much info since we are different ppl (variance)
One of the top questions we've been getting from new Python coders is "how should I structure my Python projects?"
With this tutorial, we want to give you a dependable Python application layout reference guide that you can refer to: https://t.co/qW5fHc5hma
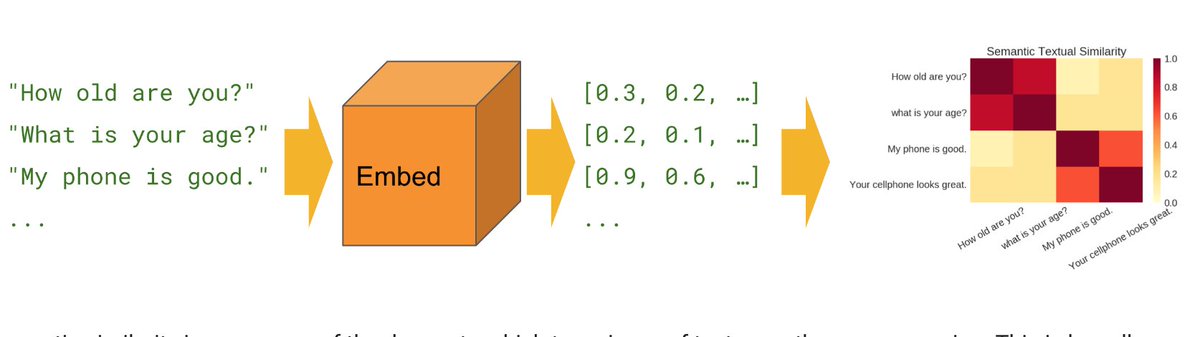
"Advances in Semantic Textual Similarity": @GoogleAI's new post on universal text embeddings: https://t.co/Xk2vyZTndj
Pre-trained 512 dim #Tensorflow model: https://t.co/6FOngCGXHm (already available in @scaletext_ai)
"Context is Everything: Finding Meaning Statistically in Semantic Spaces." A replacement of tf-idf that is actually better than tf-idf (finally?!)
https://t.co/mvFYZmt47h
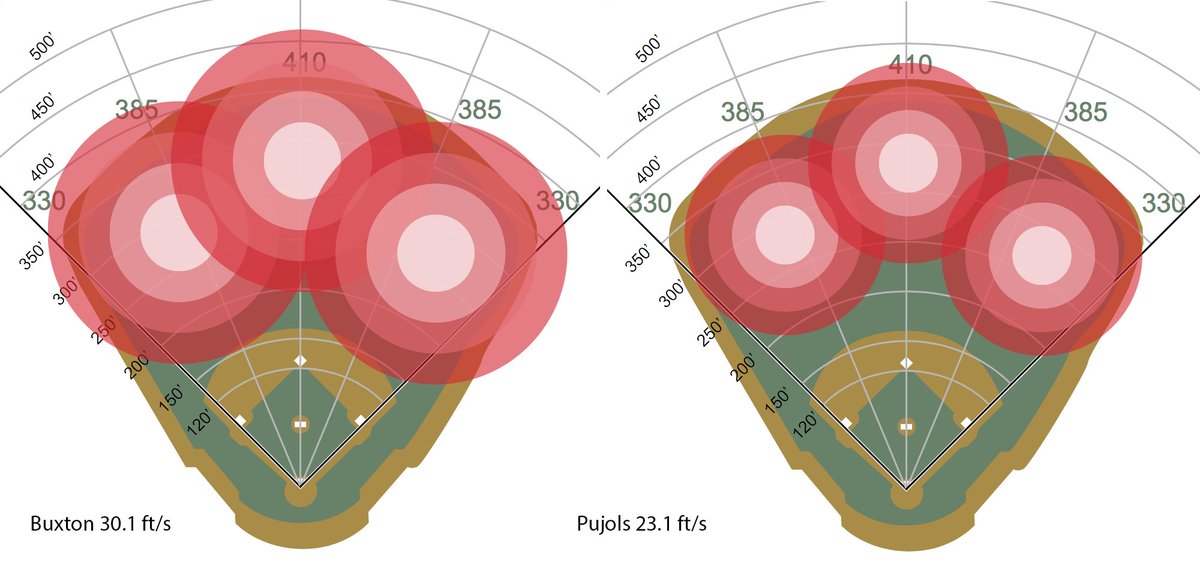
Just for fun... Here's how an outfield of all Buxton would compare to an outfield of all Pujols based on 2017 sprint speed. Each colored band is a second of hang time. outer band is 6 seconds, inner band 3.