Most flow tools give you a dashboard with thousands of data points and say "figure it out."
Research shows that makes you more confident, not more accurate. More data → more trades → worse returns.
We built the opposite. Here's what Pinpoint Alpha does differently. 🧵
$XYZ is one of the most interesting setups right now. Four years in this range between $45 and $90. If this can clear $80 soon a re-test of $100 could come quickly.
It's end of month so this is partly expected, but there were some absolutely MASSIVE ranked trades today at the market on close (MOC)
$NVDA, $MSFT, $GOOG, $INTC, $MU, $AMD etc....
The Pinpoint Intraday scanner picked up some notable put buying on $ARM today. Premium isn't anything crazy, but 7DTE and -15% OTM...
This is supportive of the local topping patterns we're seeing across the semi space.
The newly launched Block Trade Tape - uncovering some of the largest single + MOC trades of the day
Top of the list = $MU at $2B, $IVV at $1.35B, and $AMD at $1.06B
Why should you care? Top 25 ranked trades tend to come at or near inflections
More at https://t.co/LEnu1neImI
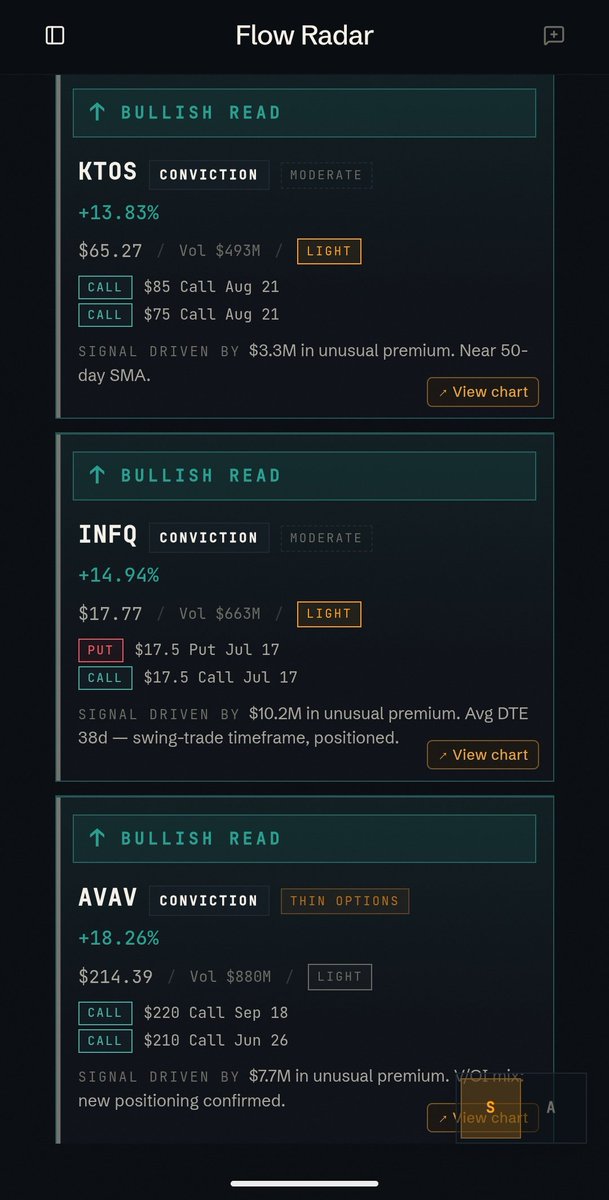
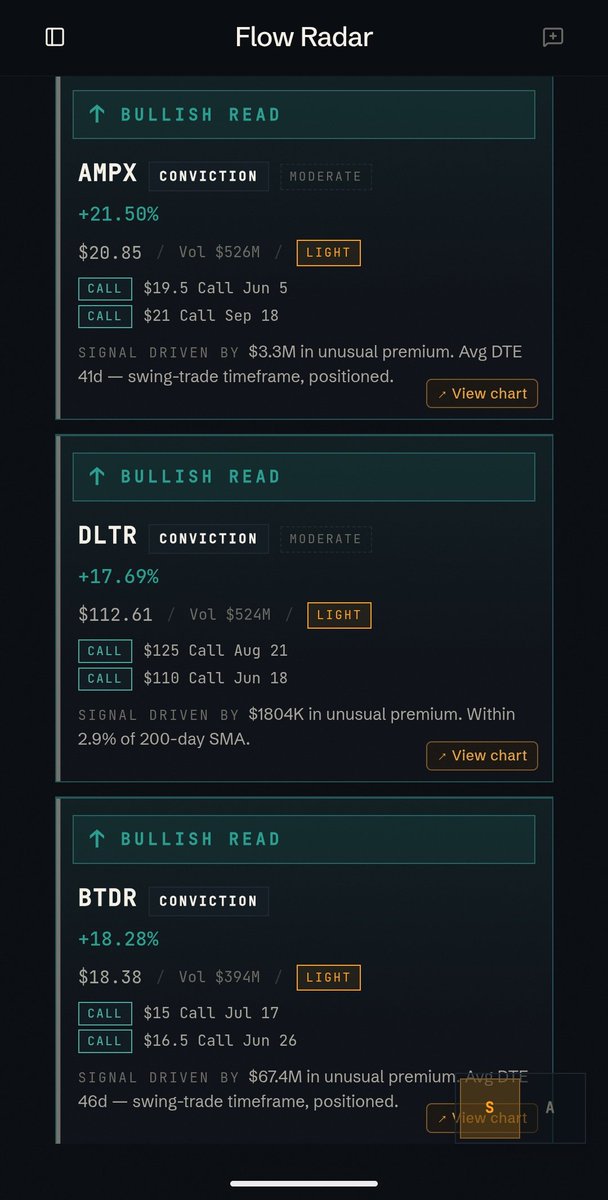
The full list of Flow Radar Momentum hits today that went out to subscribers 👇
$KTOS, $INFQ, $AVAV, $AMPX, $DLTR, $BTDR
All are names flagged for irregular institutional trading patterns. Directional read isn't always accurate, but outsized moves setting up generally are.
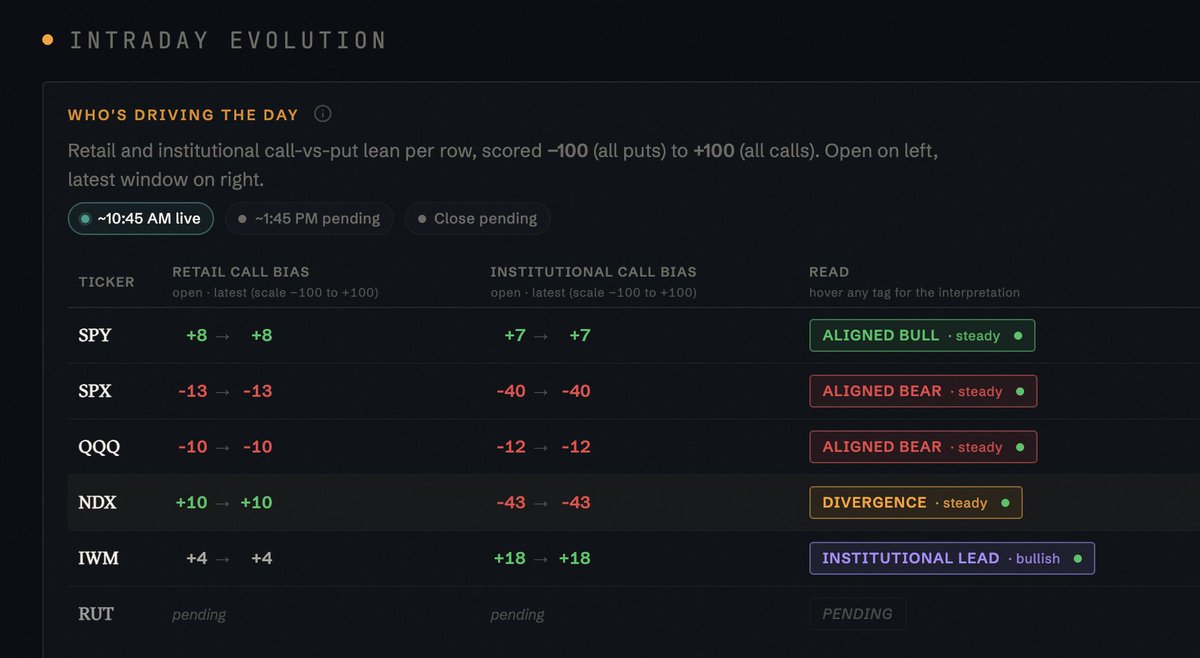
Despite the new highs, today's PA Institutional Positioning tracker picked up net selling on both Indices and individual stocks.
It would not surprise us at all to see a 2-3% pullback in the next few sessions (possibly starting tomorrow).