Regional Wall Motion Abnormality vascular territories and the corresponding ECG distribution for #POCUS
Each color reflects the corresponding vascular territories (see ALT)
👇adapted from 📕Advanced Point-of-Care Ultrasound, a comprehensive review (Michael Gottlieb · Nova Panebianco)
#FOAMultrasound #FOAMpocus #FOAMacutemedicine
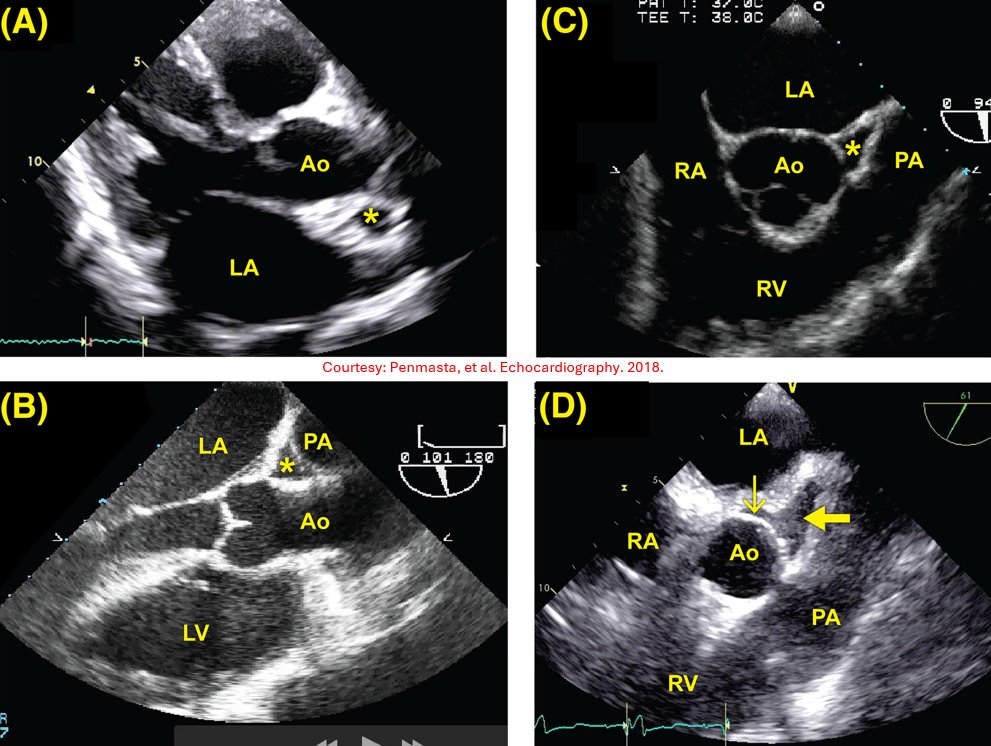
🫀#echoboards prep question
The asterisk in panels A-C and the arrow in panel D all indicate the same anatomic structure. What is it?
📌 Panel A is a transthoracic echocardiogram
📌 Panels B–D are transesophageal echocardiograms
📌 Mitral Regurgitation: Signal Density & Contour on CW Doppler
Continuous-wave (CW) Doppler assessment of the mitral regurgitation (MR) jet provides important clues about MR severity.
Follow this thread 👇
@POCUSpeek 1/ Sure. There is a force driving venous return to the heart that is made of a combination of intravascular volume & vascular compliance—more volume and/or stiffer vessels increase this force is called “mean systemic filling pressure” or Pmsf.
Thank you, glad to hear that.
More videos are on the way. I started with hepatic vein Doppler because the physiology is a bit more complex compared with portal and intrarenal venous Doppler, which are relatively straightforward. I'll definitely be making more using these sketched illustrations.
#POCUS#echofirst#Nephpearls
RVOT pulse-wave Doppler can provide useful clues about pulmonary vascular resistance.
In normal individuals (A), the waveform has a smooth, dome-shaped appearance, with peak velocity occurring in mid-systole, reflecting a compliant, low-resistance pulmonary circulation.
As RV afterload increases, the waveform gradually becomes more triangular. The RVOT acceleration time shortens, and the peak velocity shifts earlier into systole (B).
With further increases in pulmonary vascular impedance and reduced arterial compliance, a characteristic mid-systolic notch may appear (C), creating the classic "W sign."
In advanced pulmonary hypertension with RV failure, the Doppler envelope becomes smaller and more abbreviated, with a very short and steep AccT (D). This reflects rapid equilibration of RVOT and proximal pulmonary artery pressures due to severe afterload elevation.
Like most POCUS findings, RVOT Doppler should be interpreted in the context of the overall echocardiographic picture rather than in isolation.
#POCUS#Nephpearls#FOAMed
The RV should normally appear smaller than the LV in the apical 4-chamber view and should not exceed about two-thirds of the LV size. If the RV appears equal to or larger than the LV, significant RV dilation should be suspected.
Another helpful visual clue is when the RV becomes the apex-forming ventricle instead of LV. While this finding has not been formally validated with quantitative thresholds, it generally suggests at least moderate RV dilation.
If you remember just one measurement, remember this: the upper limit of normal RV basal diameter is 4.2 cm, measured at end-diastole in an RV-focused apical 4-chamber view.
Also assess RV wall thickness. An RV end-diastolic free wall thickness >5 mm (typically measured in the subcostal view) indicates RV hypertrophy, which often accompanies chronic pressure overload and RV dilation.
Finally, don’t forget to look for interventricular septal flattening on the parasternal short-axis view. Septal flattening (“D-shaped” LV) is another important clue to RV pressure and/or volume overload.