This data visualization by @nicolaraluk shows the occurrence of earthquakes on Earth between July 2017 and July 2018, but differently from other charts, this ones shows them with their depth. Here you can find the interactive version: https://t.co/ctsei4wsDo
#ArcGIS API for #JavaScript (v4.25) was released! New features include related records in popups, custom cluster styles (like this image showing clusters of 311 calls in NYC as pie charts), dimension layers in 3D, and more! Get the scoop: https://t.co/iQ1a1beMBV
When is the right time to communicate #3D visualizations in urban planning. Lisa Stähli, Senior Product Engineer @esri kick-starts a conversation in this storymap. https://t.co/KTJCPvXQmd #ArcGISUrban
What a great start to the 2022 @EsriUC !!! One thing not to miss, the the virtual map gallery:
https://t.co/djZbdki1tz
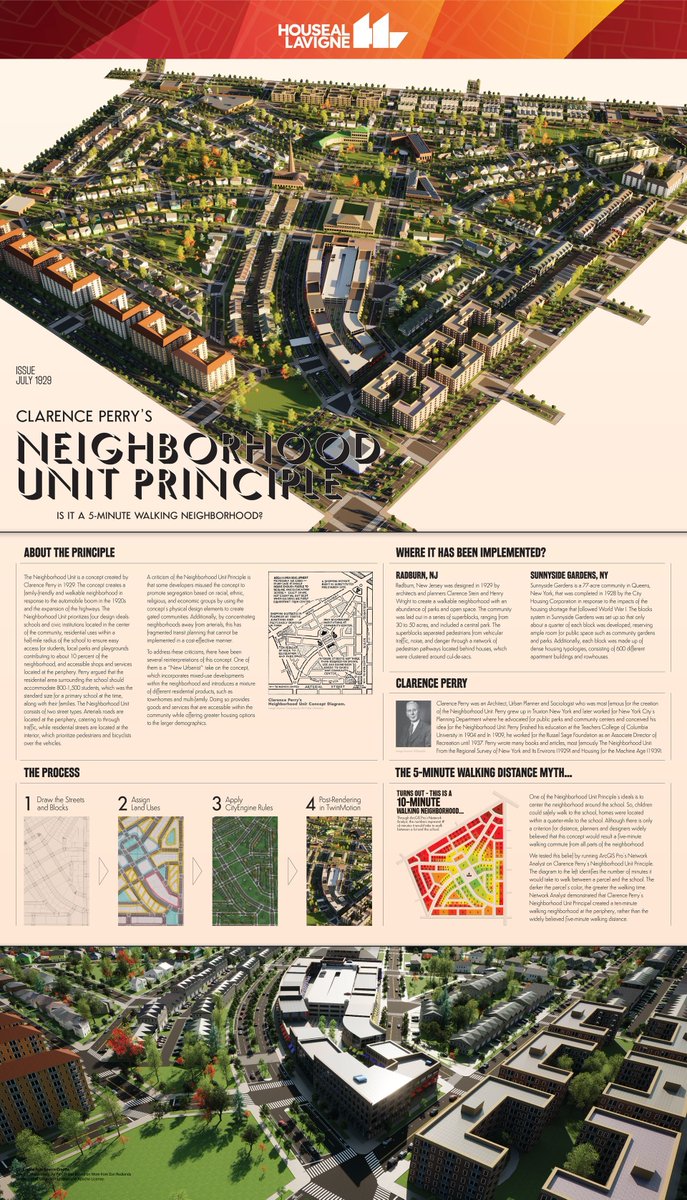
Our friends at @HousealLavigne entered an awesome map created in @CityEngine and @ArcGISPro about 1929 neighborhood planning:
https://t.co/mrWfJIsrnV
Don't miss tomorrow's #Twitch stream at 11am PDT / 8pm CET to get the run-down of an architectural workflow in #NVIDIAOmniverse and to see the importance of connectors, such as the one for @Esri's ArcGIS CityEngine.
📺https://t.co/T1JPgM86LF
Asteroids aren't the only things flying by Earth. This 3D visualization features thousands of active satellites orbiting our planet. 🛰️ Explore the app:
https://t.co/sU6DdlFdYe
We're bringing you new additions in #3D data visualization with the 3D #JavaScript API!
🔹Line styles and heatmaps
🔹More data formats - GeoJSON and Voxels
🔹Powerful analysis tools all in the browser
Learn more: https://t.co/Eo0mlpuDJD #DevSummit
3D scenes that make you say "oh my!" 😲 New realistic weather effects let you toggle between sunny, cloudy, rainy, and foggy.🌦 See this and other updates to the #ArcGIS API for JavaScript. https://t.co/XmmQU8Qidu
Great news out before the holidays, @CityEngine released #Puma, the new plugin for #Rhino3d / #Grasshopper. This means designers don't have to leave the Rhino environment anymore to leverage @CityEngine procedural modeling power. Check it out:
blog: https://t.co/08a9QomWiQ
#ArcGIS API for #JavaScript version 4.22 is out the door! It brings a wide range of capabilities such as weather in 3D scenes, performance optimizations, animated streamlines, better cartography, key updates to GeoJSON layers, and more. Learn more here! https://t.co/4QbQHZPKMl
NVIDIA's #GTC21 was a great success! And in case you missed it, @CityEngine announced the beta release of the #Omniverse connector for CityEngine 2021.1! If you haven't read up on this, do check out all the details in our blog:
https://t.co/GWMAE9QaJZ
#3dgis#nvidia
NVIDIA's #GTC21 is in full swing, and today, the CityEngine team is extremely excited to announce the beta release of the #Omniverse connector for ArcGIS CityEngine 2021.1! Read our blog for this exciting announcement and how to get started today.
https://t.co/GWMAE9QaJZ
Here is a new Storymap Collection of #LaPalmaEruption teaching resources, including a GIS lesson from @lcgeography
https://t.co/BmXZsaqaAD
It includes stunning high res #drone imagery of the lava flow from @lapalmaopendata plus a selection of GIS based apps #geographyteacher